EdStatica
craig willers
UI, UX design, and strategy of a data platform for decision makers in the education sector, providing a means to understand how well schools are performing in the view of their stakeholders.
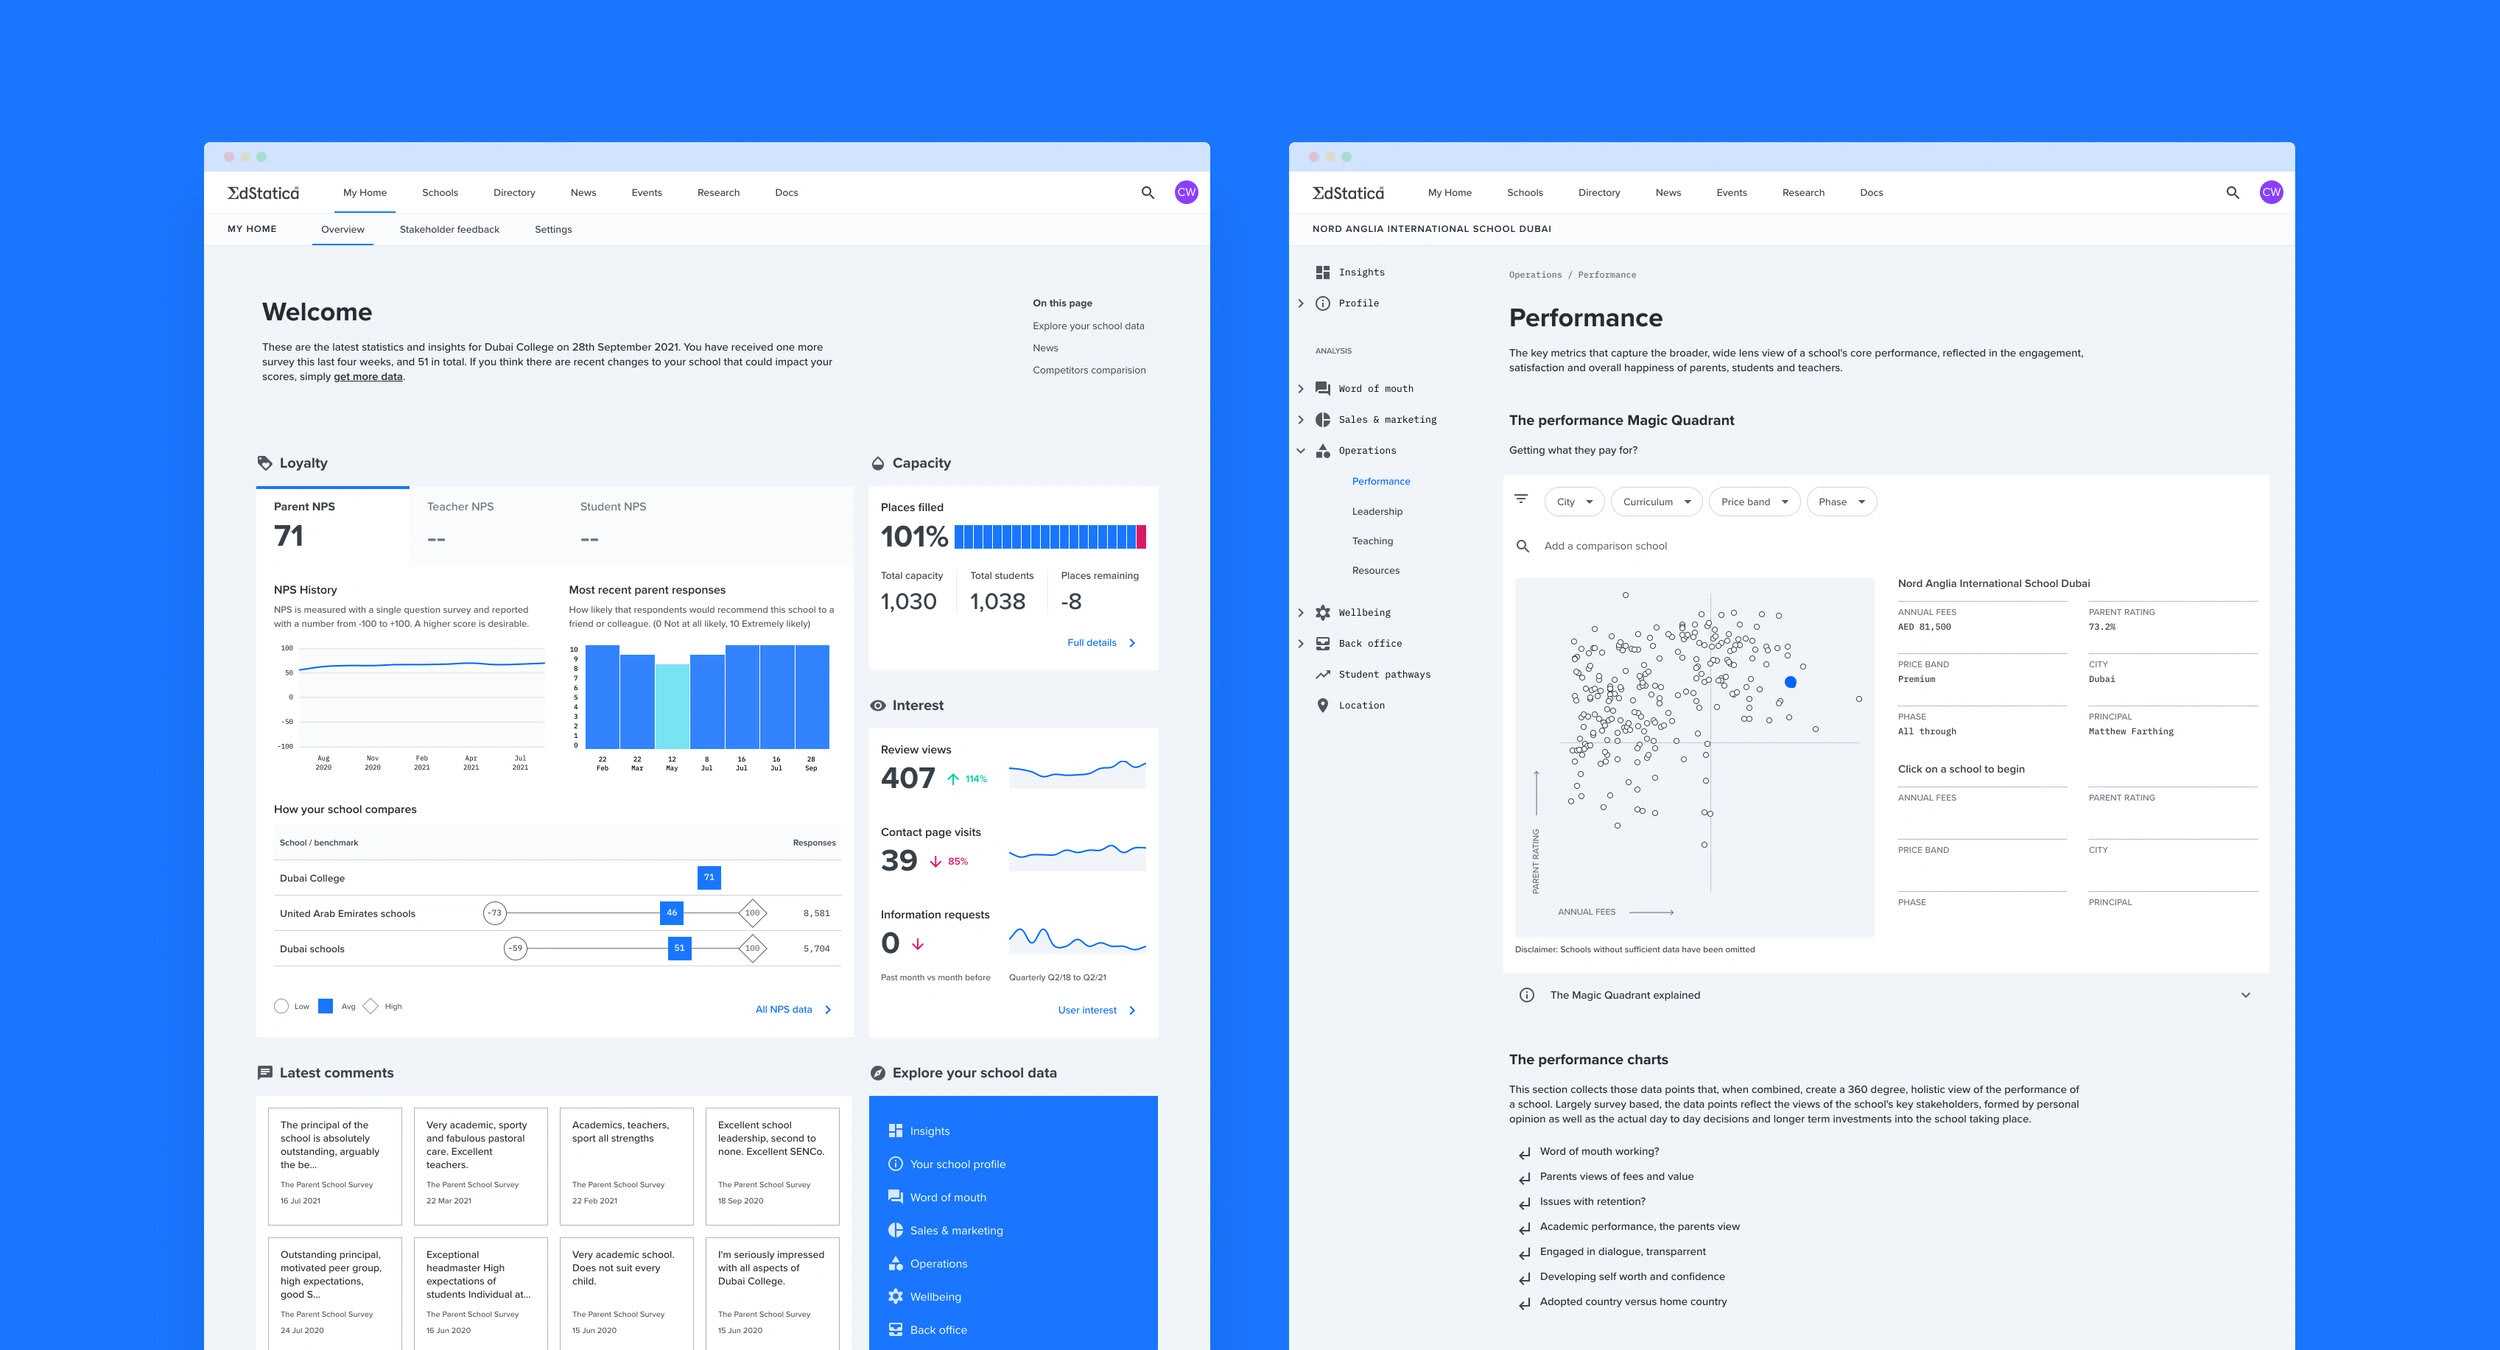
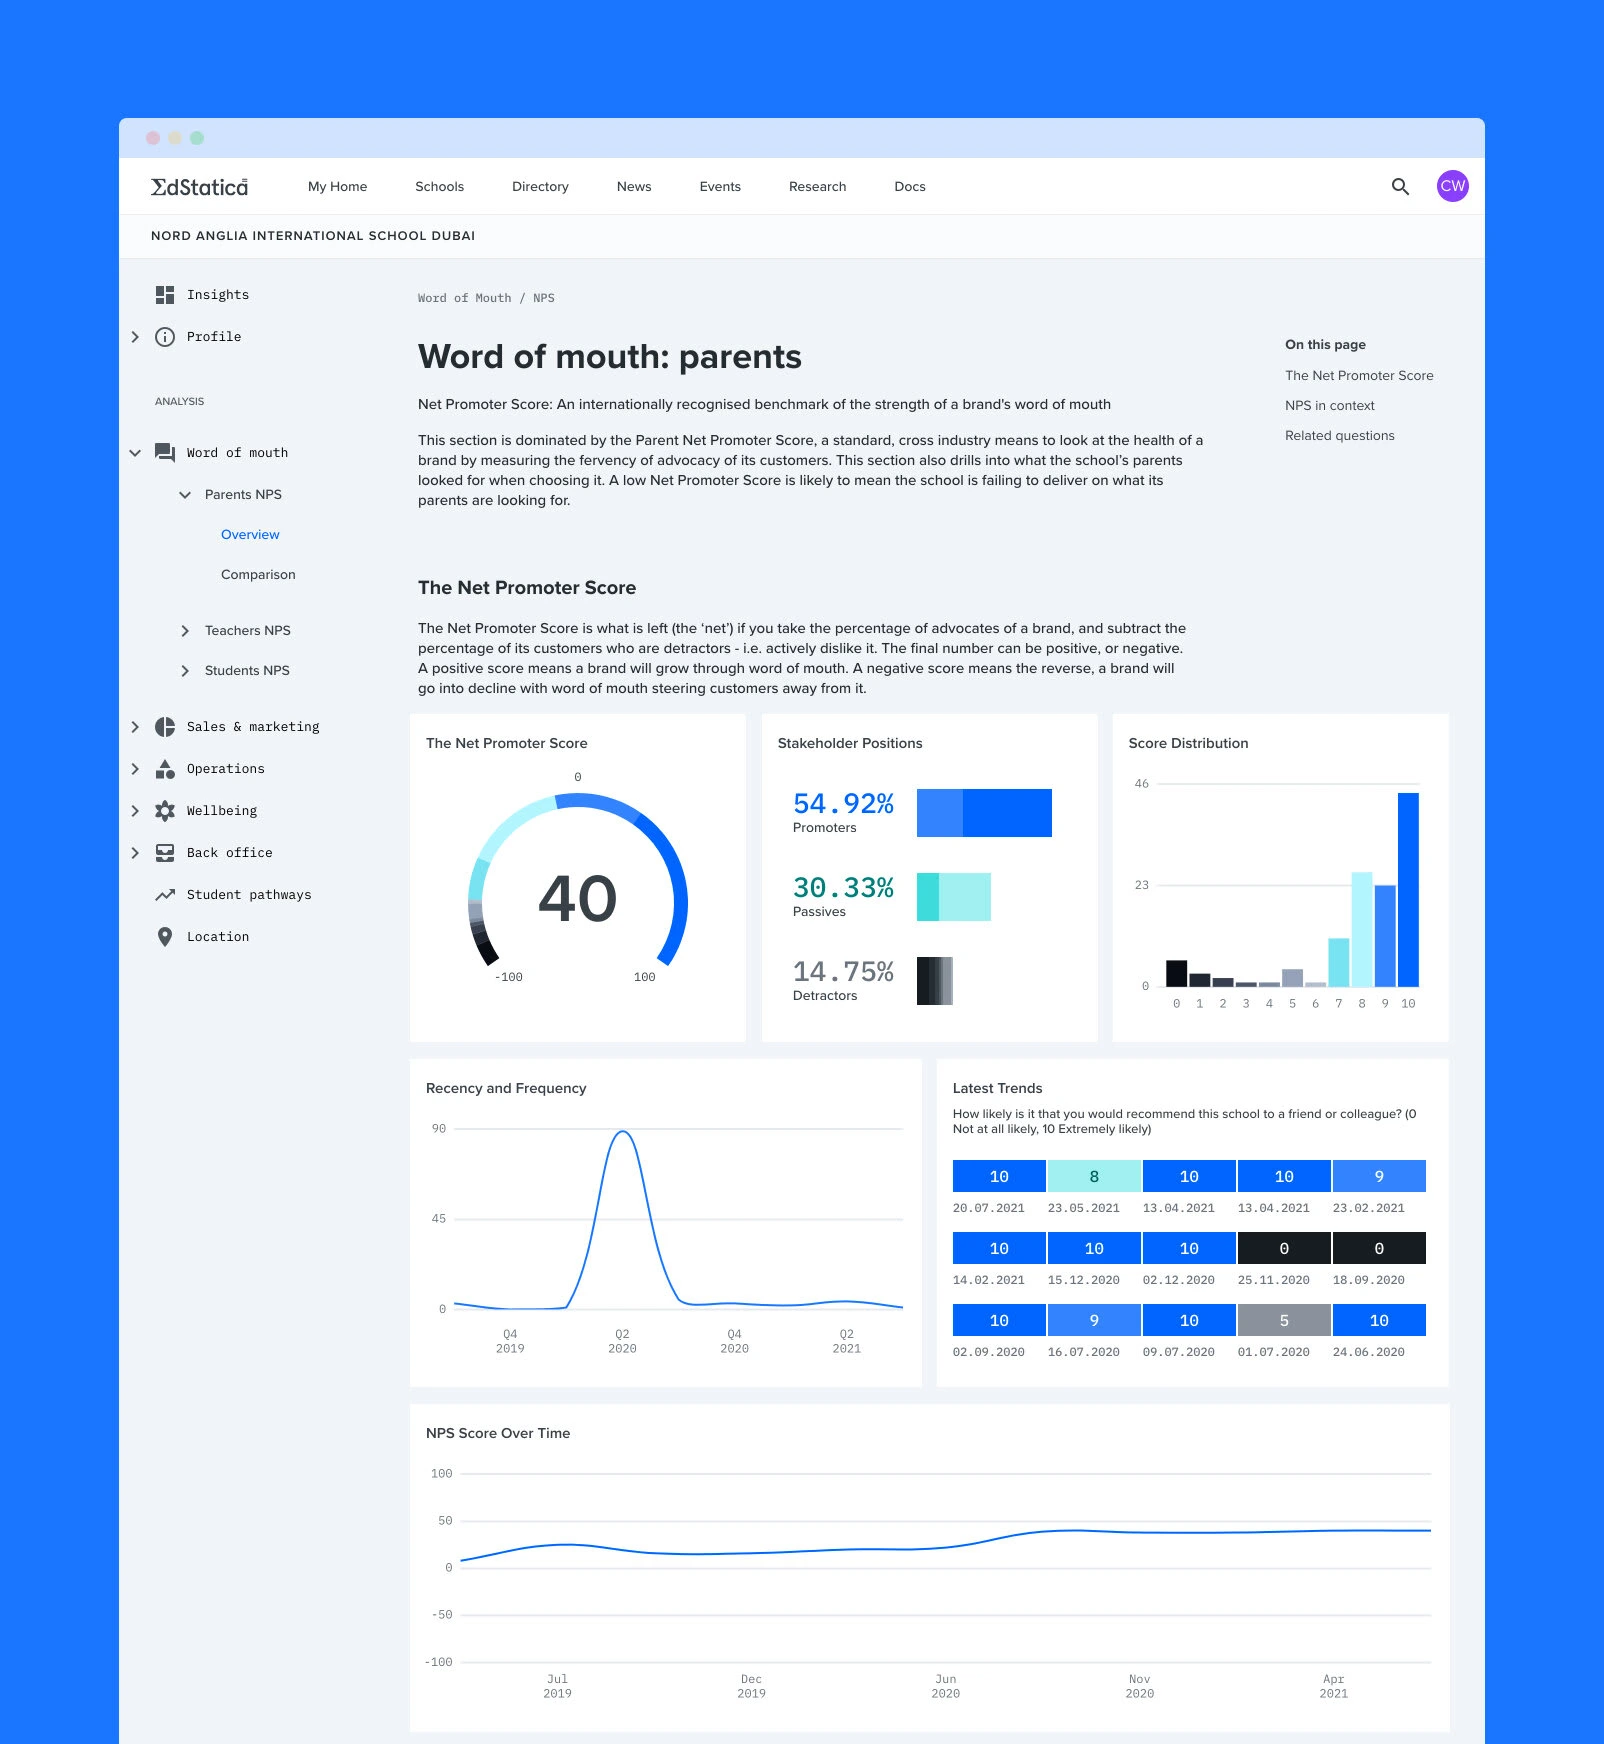
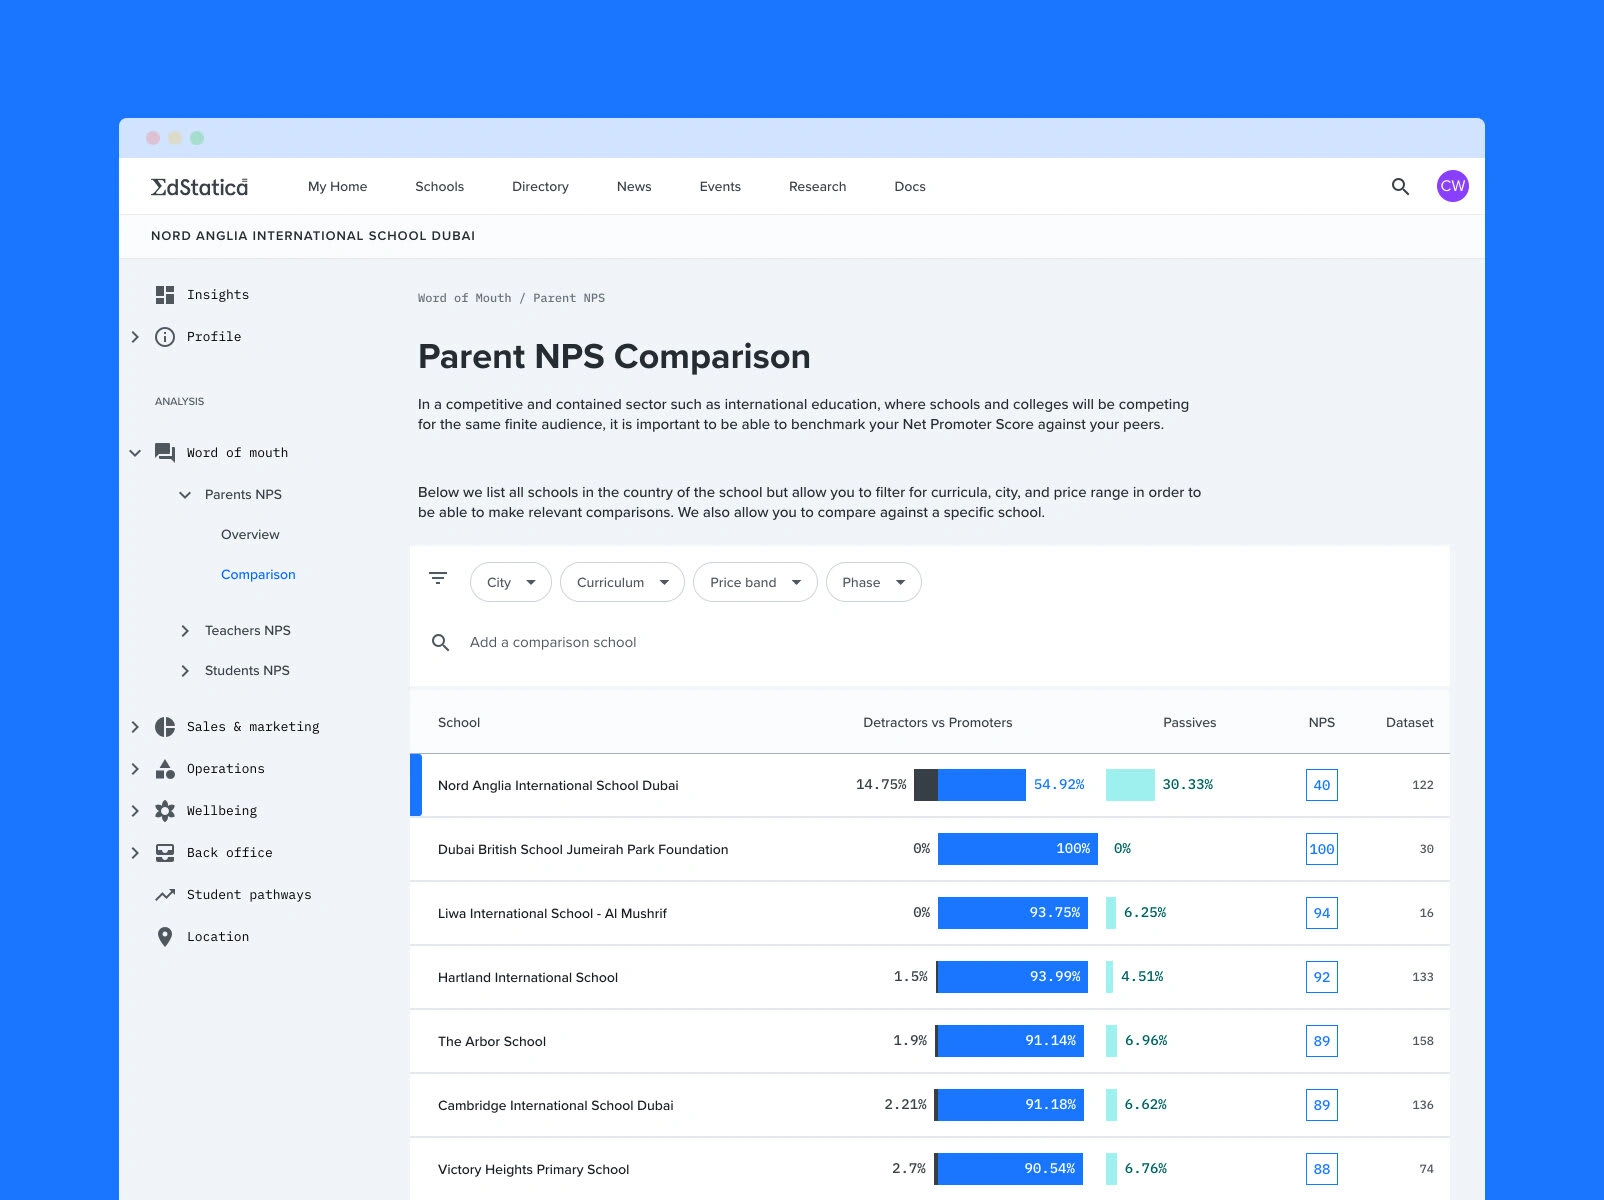
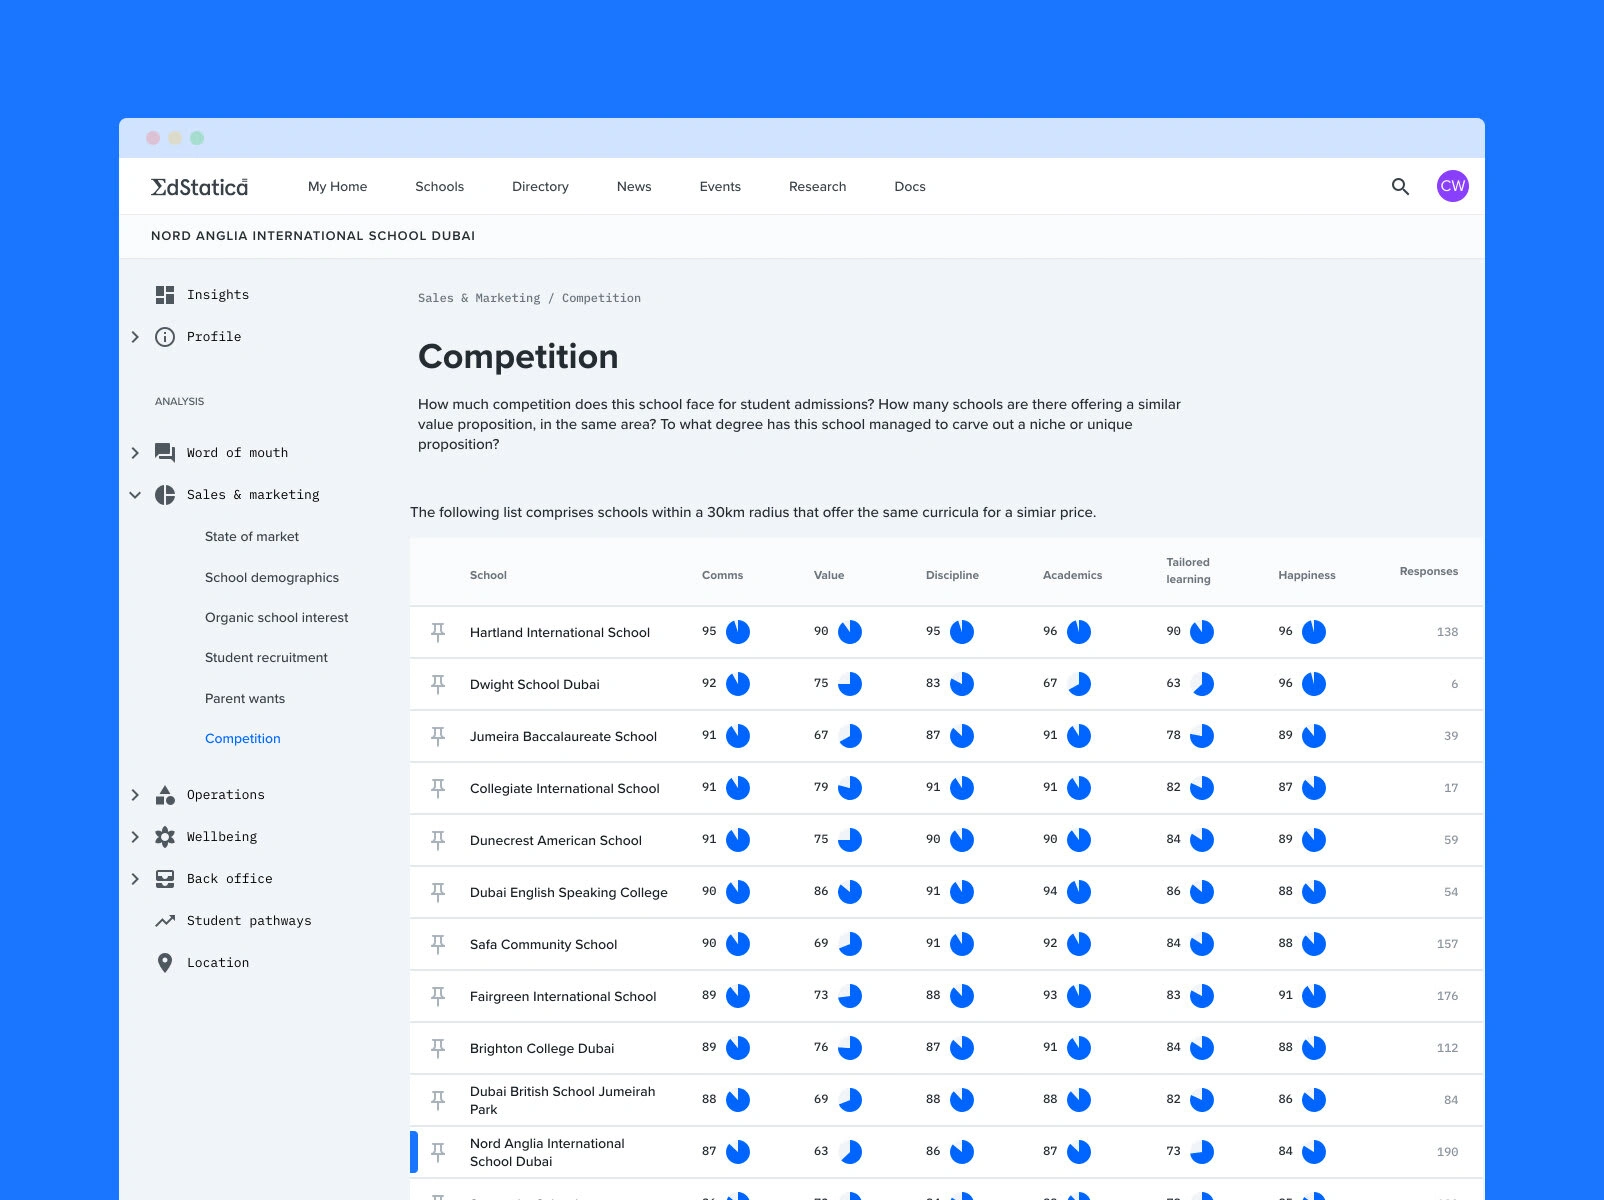
At its heart, EdStatica takes “word of mouth”, widely acknowledged to the single biggest driver in school choice, and converts it into a set of meaningful, comparable data points which are then displayed in ways to reveal differences in the offering of schools. It converts sentiment and what parents, teachers and students say, into data and numbers. Editors, and schools, can use these numbers to assess where they are, by comparing to national, curriculum and price point based benchmarks.
My role was to deliver an end-to-end solution from business and product strategy, to UX, brand identity, UI, and data visualisation.
Discovery
Before jumping into the design and experience of the platform it was vital that we had a pretty good understanding of the elements that would go into a successful launch. Part of my involvement was to research the education sector from a business and investor point of view, this was achieved by interviewing stakeholders and business owners and documenting which date points would be invaluable to decision making.
Key Insights & Challenges
Data: The wealth of data points which were collected via two editorial websites surveys, open data from governments, and aggregated data from private education providers.
Users: The potential users of the product such as principals, heads of faculties, school investors, CEOs, HR, …
Monetisation: The ‘why’ each of the users (and some outliers) would pay for the product.
Time and Target: Development resources and release. We needed to work within pretty hard constraints which we offset by creating a better underlying platform for the parent company's other revenue sources.
Navigation / Architecture: User journeys across 30+ screens, across thousands of schools and thousands of comparable data points.
Development resources: Understanding development complexity (frontend and backend), weighing visual whimsy against core information presentation.
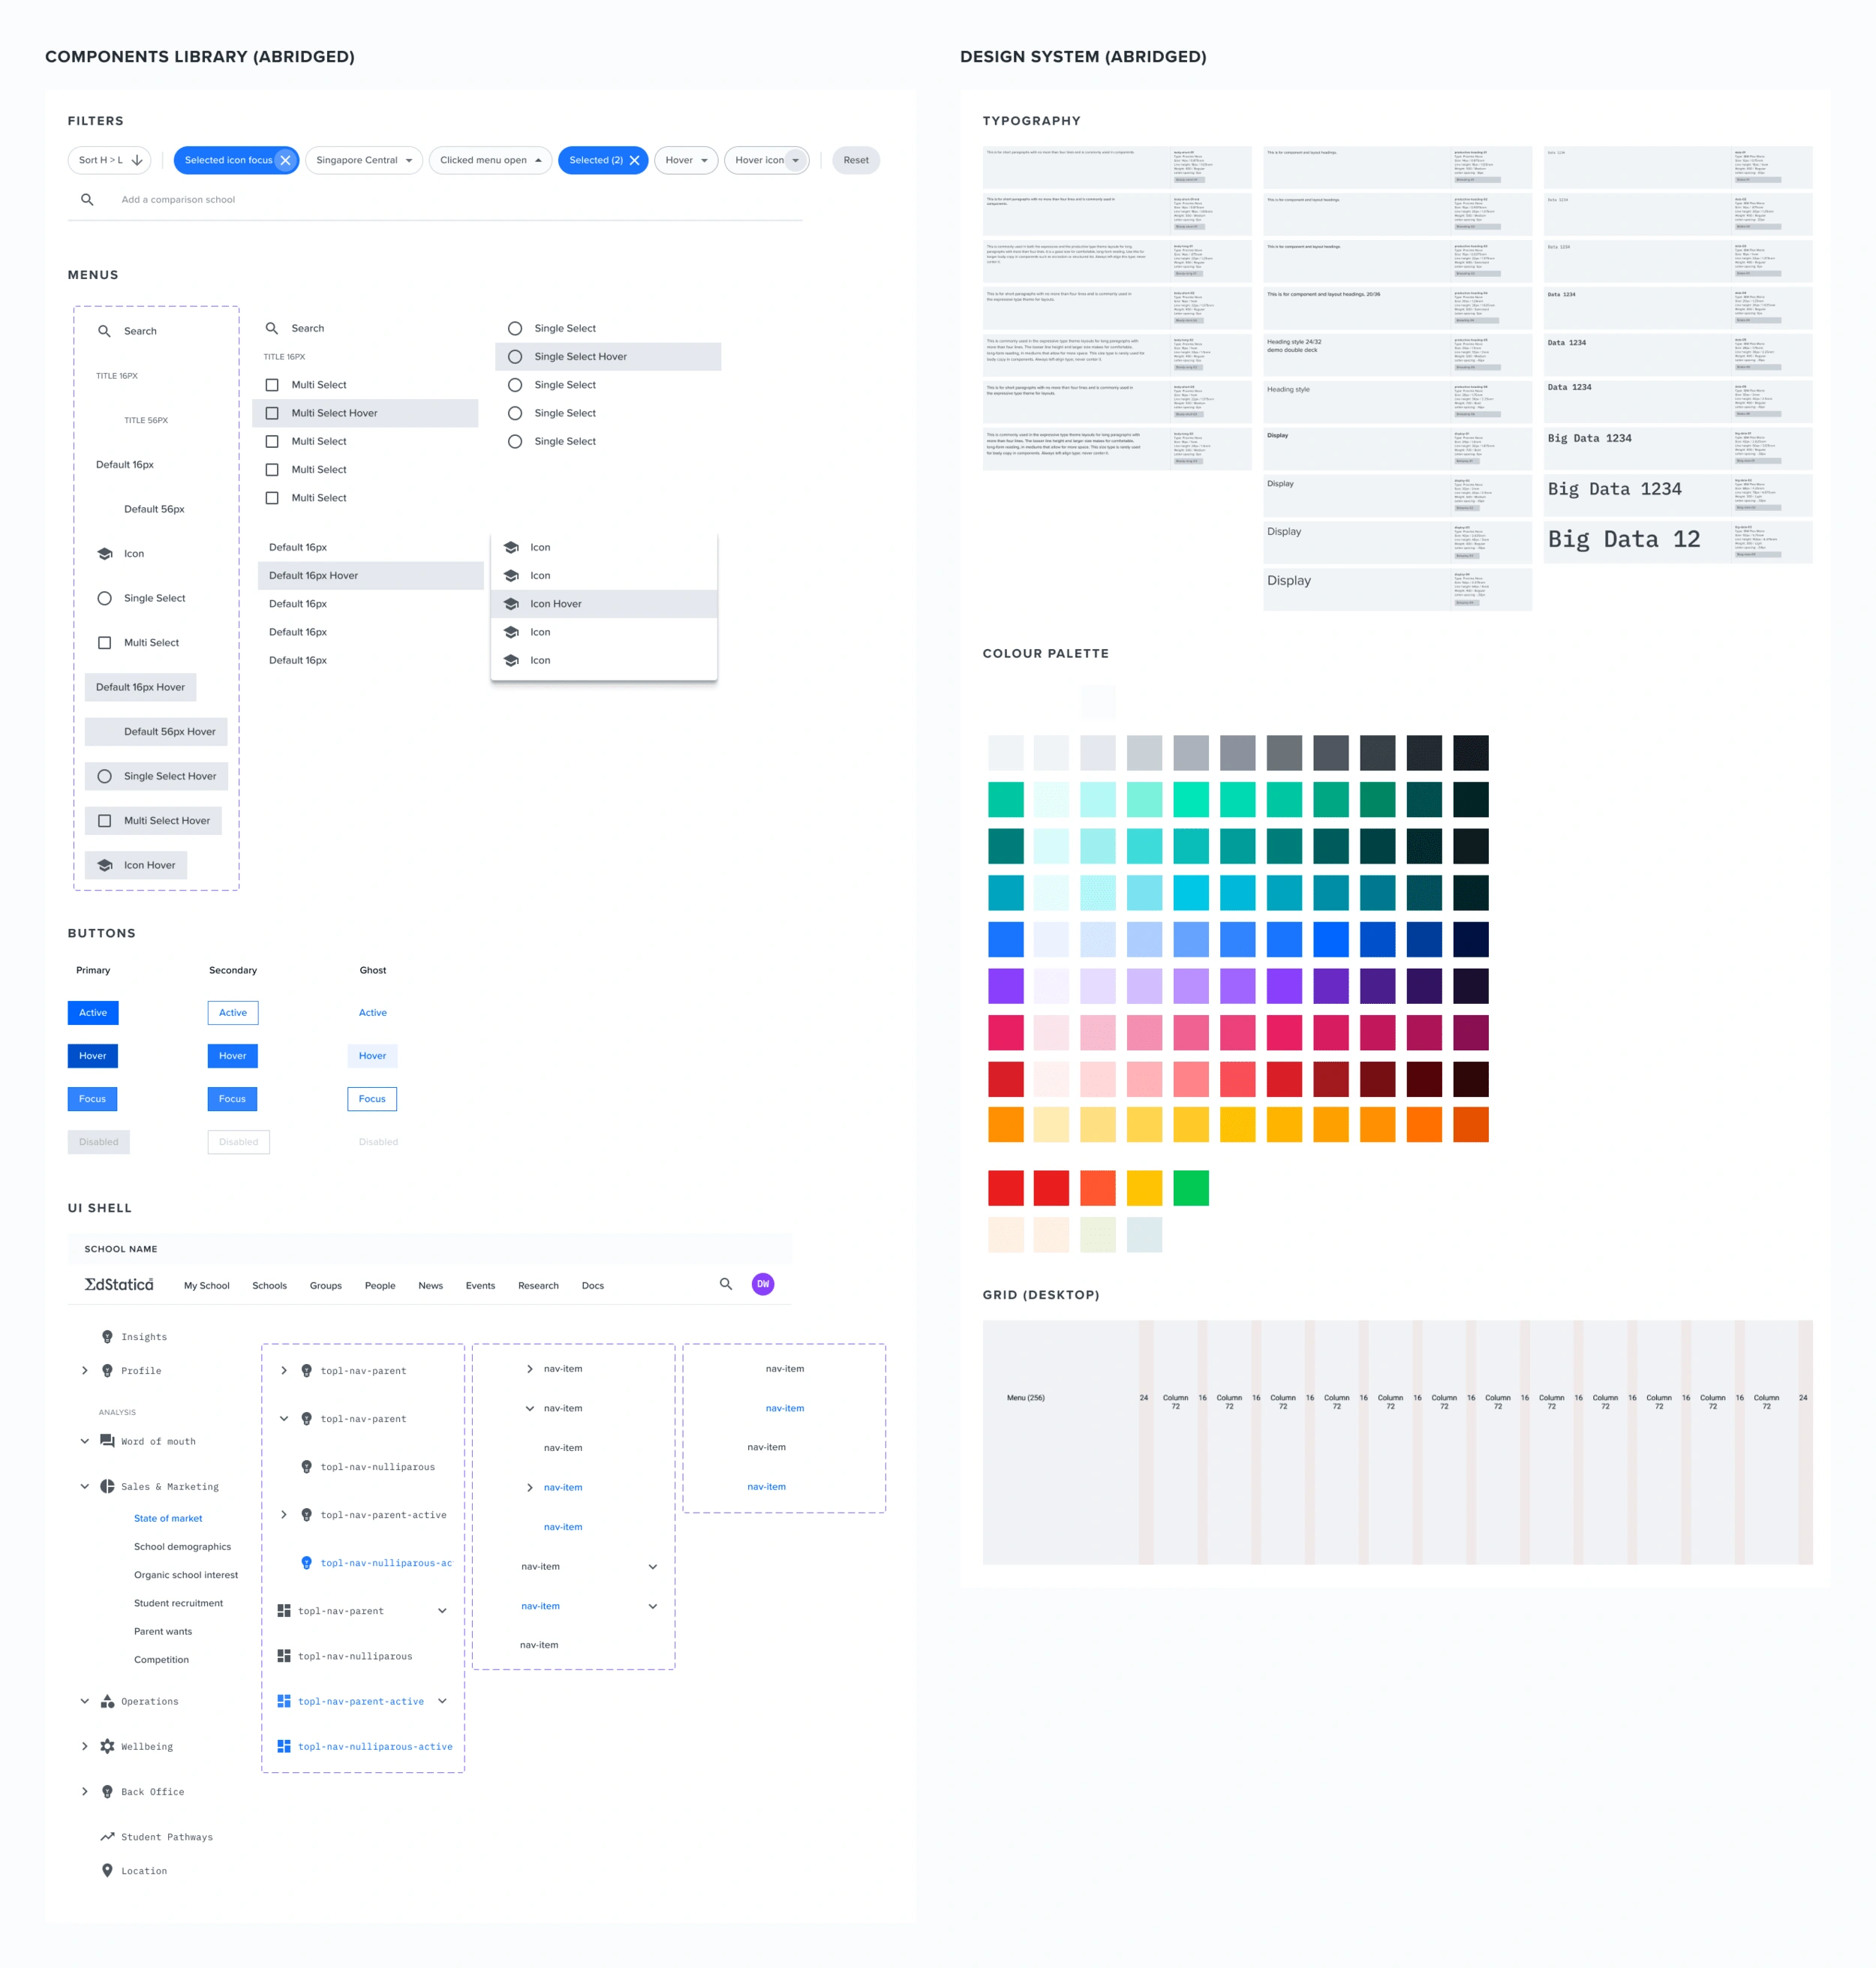
Budgeting: Manage the value of every aspect of the design process to keep within a fixed monthly budget. Such as weighing up ROI on how deep to go with components builds and a design system.
Approach
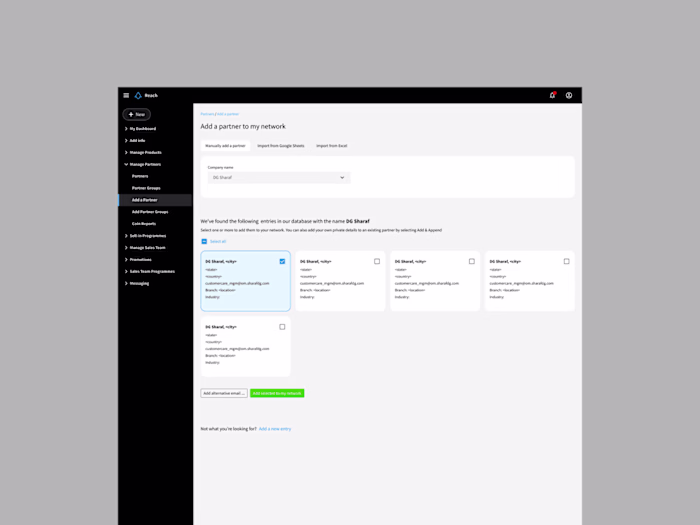
To successfully execute the vision of what the client wanted to take to market, we opted for a web app based on the company’s sister products admin (semi-shared frontend) and database.
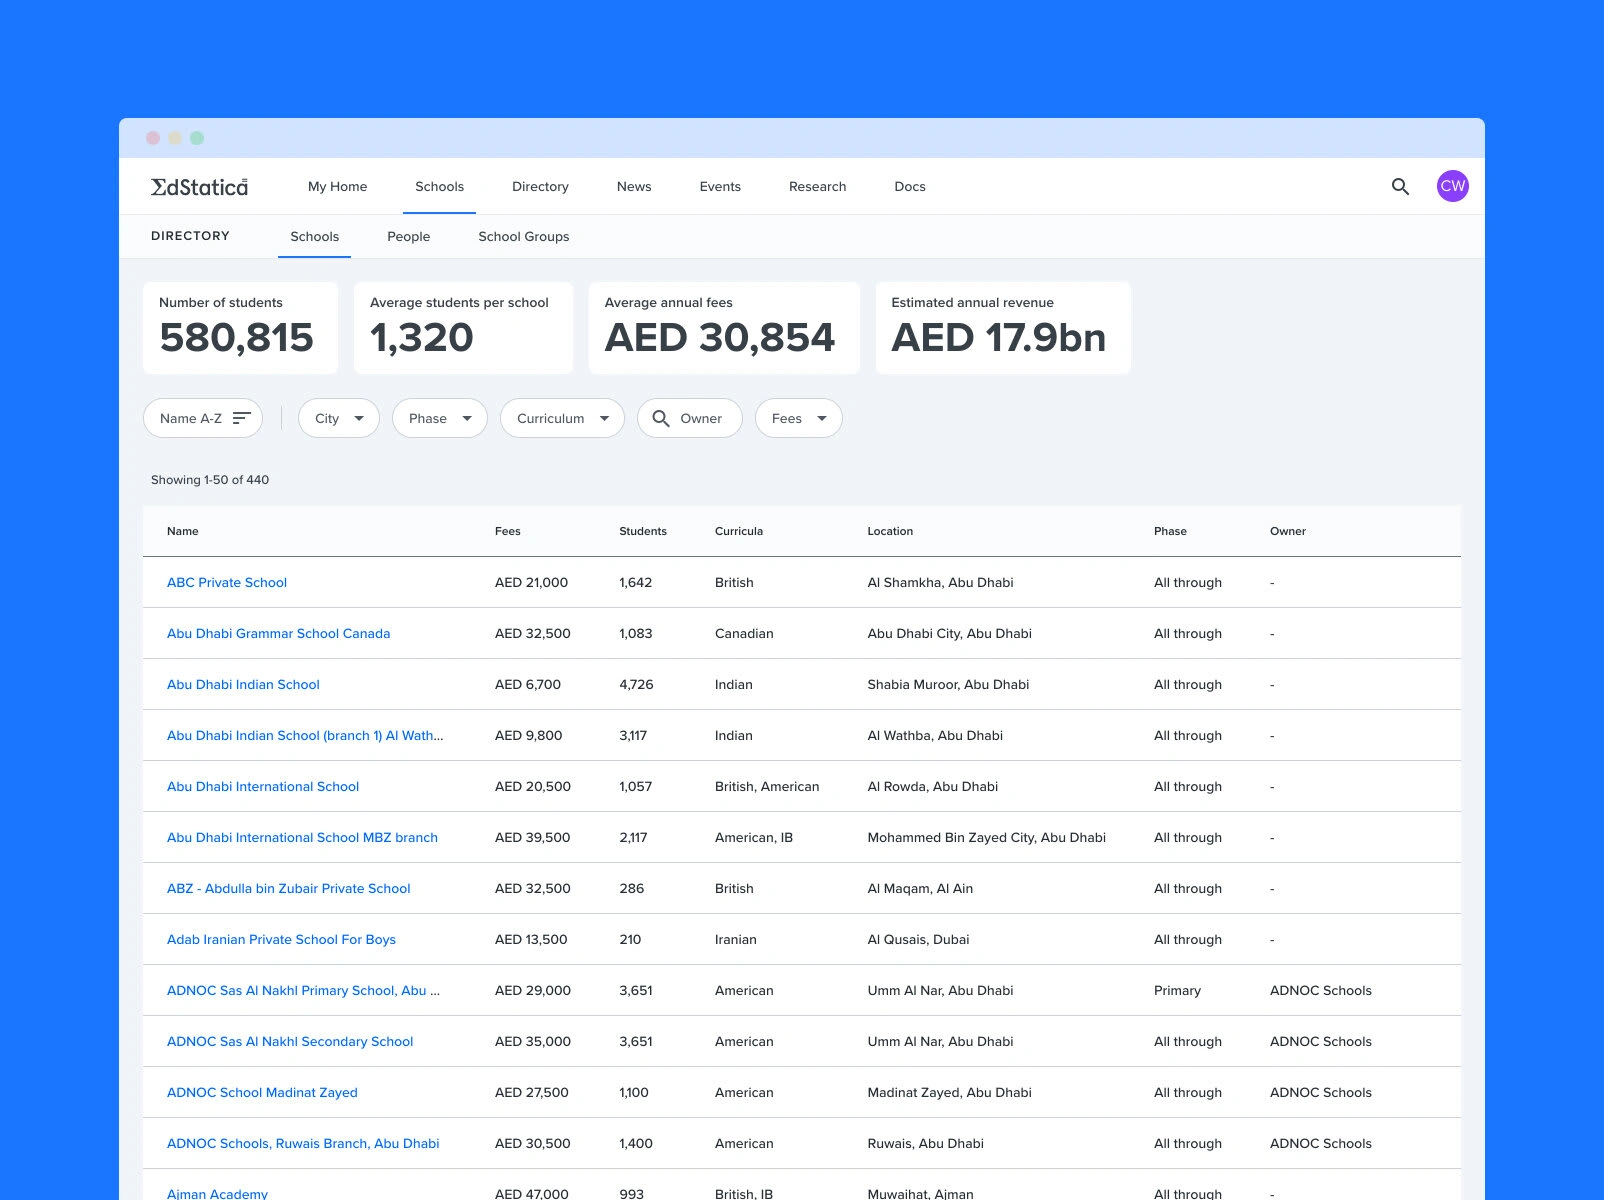
Due to stakeholder interviews during the design and build, the initial MVP was expanded to include approximately 50 pages of data visualisation, directory pages to add navigation, a filtering schema and async ‘omnisearch’ feature.
The brand identity was developed during the course of the project, with the client opting for the option of the Greek Sigma symbol in the wordmark to evoke a mathematical equation.
Solution
To successfully execute the vision of what the client wanted to take to market, we opted for a web app based on the company’s sister products admin (semi-shared frontend) and database. Due to stakeholder interviews during the design and build, the initial MVP was expanded to include approximately 50 pages of data visualisation, directory pages to add navigation, a filtering schema and async omnisearch feature.
The brand identity was developed during the course of the project, with the client opting for the option of the Sigma symbol in the wordmark to evoke a mathematical equation.
Roles
Product strategy, editorial strategy, data visualisation, architecture, wireframing, prototyping and UI, project management.
Collaborators
David Westely (Owner, Editorial)
Luke Joyce (Development)
Tools
Sketch and Figma (Wireframes, Visual Design, UI/UX Deliverables), Zeplin (Development Handoff)
Platform
Website
Like this project
Posted Sep 30, 2023
UI, UX design, and strategy of a data platform for decision makers in the education sector, providing a means to understand how well schools are performing in
Likes
0
Views
1