
Ever.Ag Desktop
Producers can compare a swine herd’s projected margins with feed costs and sales.
Role Product design lead
Studio Foundry, 2022 to 2024
Scope Web app, Design system
Industry Agriculture, SaaS
Team Myself, Paige Guggemos, Jonathan Kaiser, Elle Yesnes
I pitched the Ever.Ag engagement and led design across its products. The desktop workspace puts projected swine margins beside feed costs and sales. Our team established the design system, and I later took over maintaining it.
The chart and table use the same units, whether you’re looking at total profit and loss, profit per head, or profit per hundredweight (CWT). The recording steps through each view.
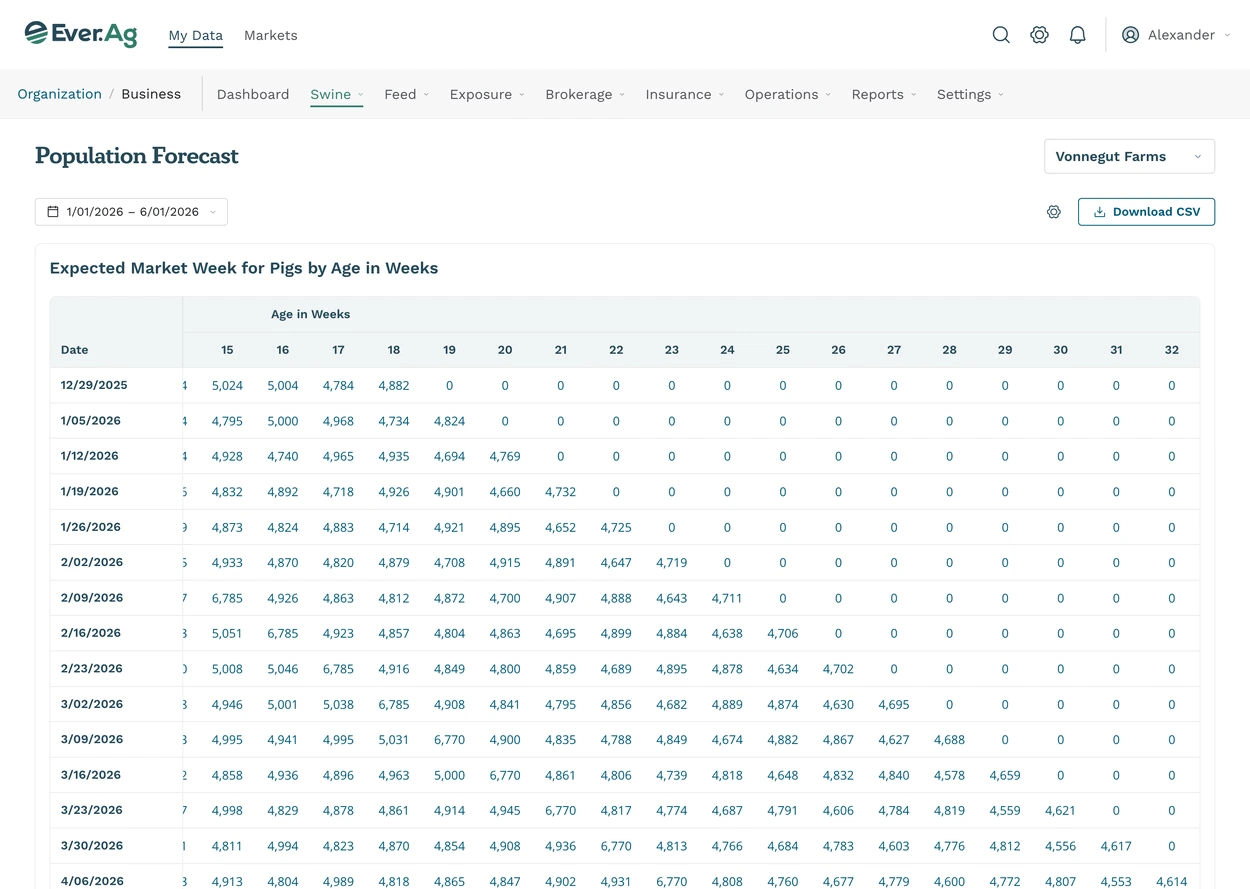
The forecast shows pig counts by week and age for sales planning. You can scroll across the grid through thirty-two weeks.
You need a name before saving an ingredient. Removing one asks for confirmation because other feed views use the same table.
Swine contracts expand in the list to show their terms and comments, while the status tabs keep a count of each group.
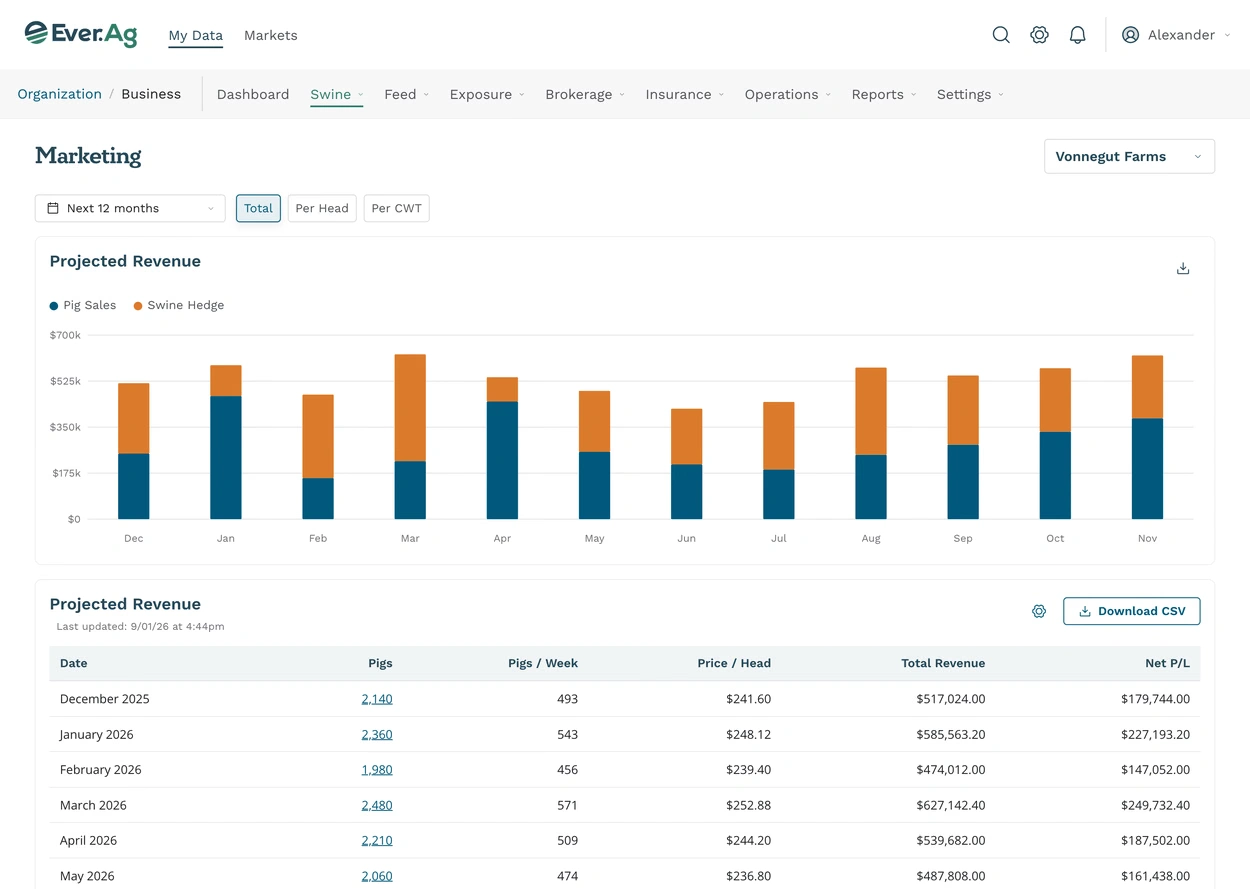
The monthly chart separates revenue from pig sales and hedging. Each month’s pig count links to the animals behind it.
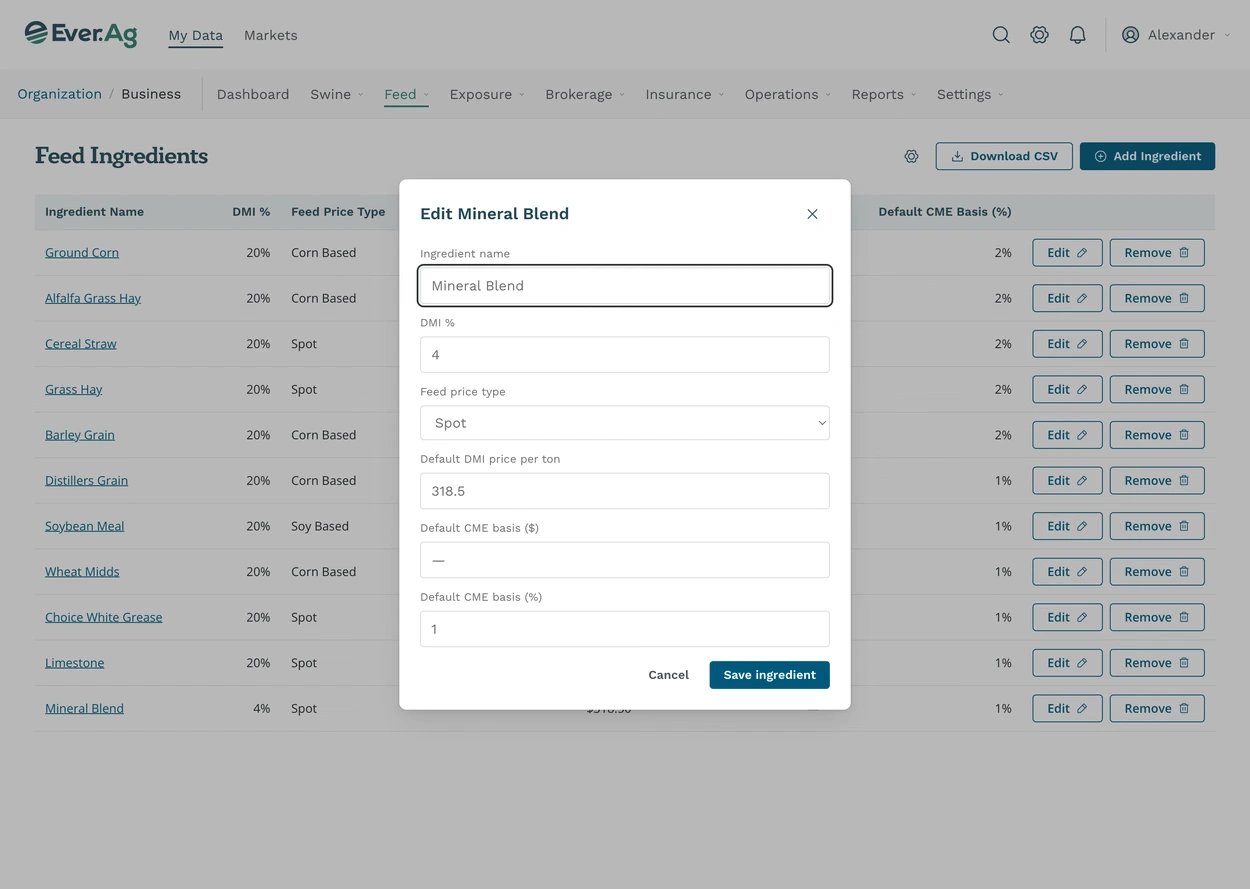
The ingredient editor uses the table’s fields so buyers can finish entering prices with the full list still visible behind it.
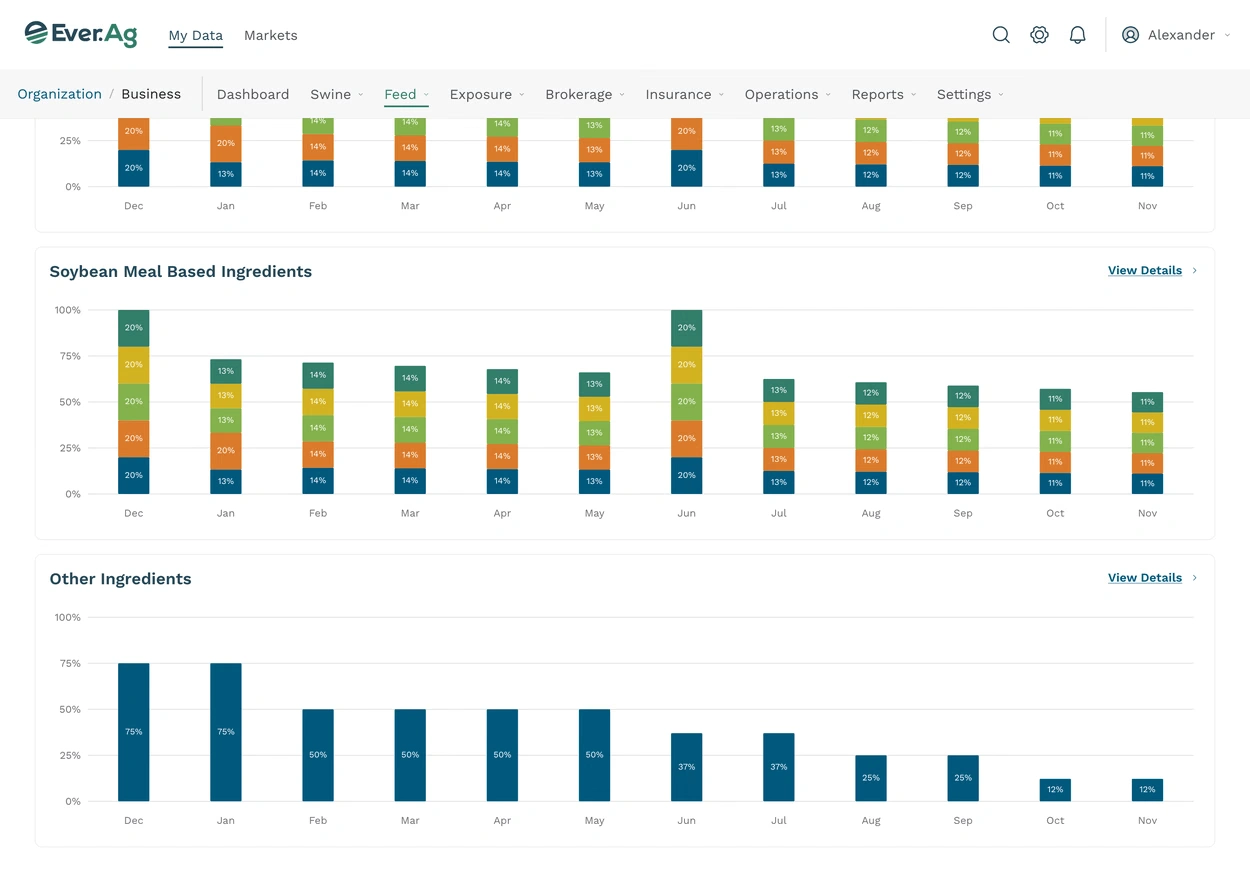
Each ingredient group gets its own monthly feed coverage chart, with a link to the details.
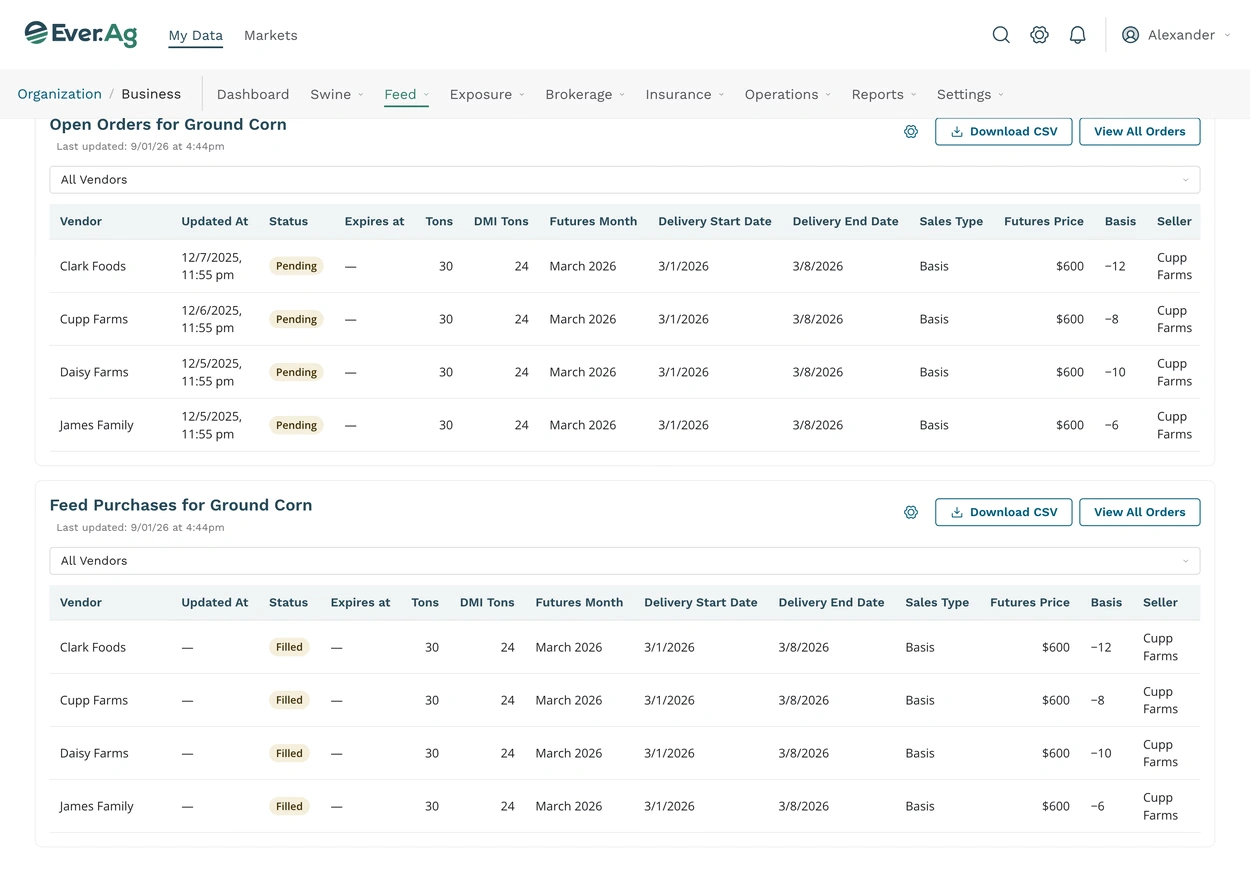
Pending ground corn orders and completed purchases have separate tables. Buyers can filter either by vendor or export it to CSV.
0 likes · 0 views · Nov 7, 2026
A desktop workspace for swine producers to compare projected herd margins with feed costs, sales, and contract terms.
Timeline
Dec 31, 2021 - Dec 30, 2024
