Lok Sabha Election Analysis (India)
Rishi Chakraborty
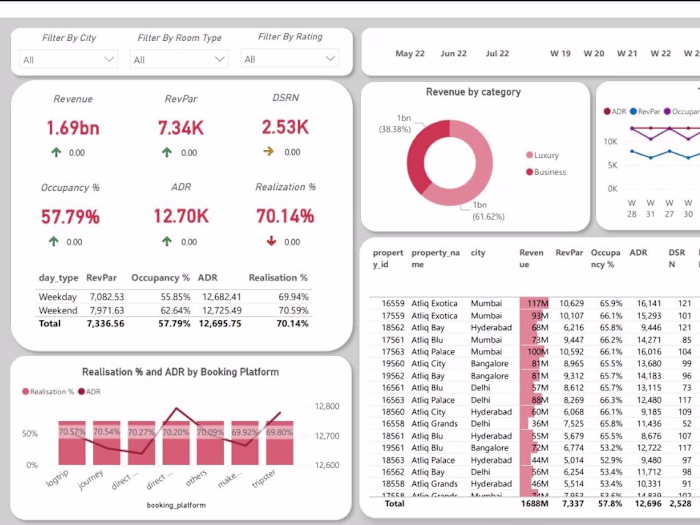
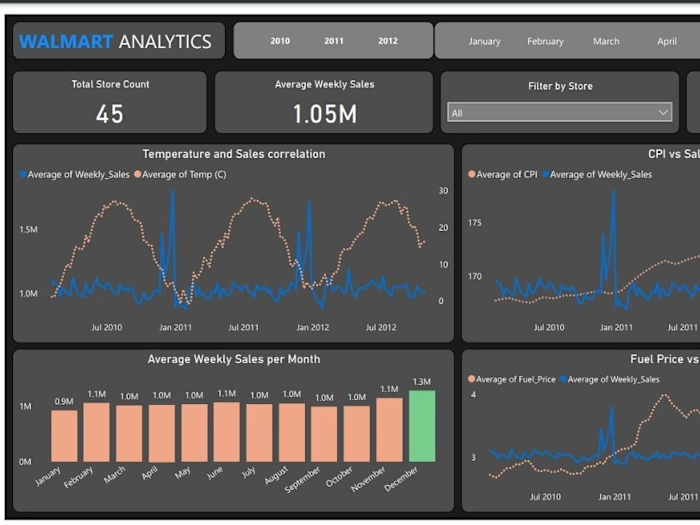
In this project, I designed and developed an interactive dashboard that provides a comprehensive analysis of the Lok Sabha elections in India. The dashboard showcases key electoral trends, voter demographics, and party performances across multiple election cycles.
Design & Visualization:
Figma: Crafted a clean and intuitive user interface, ensuring ease of navigation and a visually appealing layout.
PowerBI: Utilized PowerBI's powerful data visualization tools to present complex election data in an accessible and engaging format.
Key Features:
Election Comparison: Side-by-side comparison of different election years, highlighting changes in voter behavior and party dominance.
Demographic Insights: Analysis of voter demographics, including age, gender, and regional variations.
Like this project
Posted Jul 25, 2024
Interactive dashboard analyzing Lok Sabha elections using Figma for design and PowerBI for visualization, highlighting trends.
Likes
0
Views
0