Leading Causes of Deaths in US Analysis
ABDELLAH GRAM
Leading-causes-of-deaths-in-US
The "Leading Causes of Deaths in US project focuses on exploring and visualizing a dataset containing information on the leading causes of deaths in the United States. This project employs a combination of data analysis techniques using Jupyter Notebook, SQL queries for data cleaning, and Microsoft Power BI for data visualization.
Key Steps:
Data Import and Cleaning: The project starts by importing the dataset into Jupyter Notebook, utilizing Python and relevant libraries such as Pandas. The dataset may contain various attributes such as cause of death, year, state, and other relevant variables. SQL queries are then used to clean the data, ensuring consistency, removing duplicates, and handling missing values.
Exploratory Data Analysis: With the cleaned dataset, exploratory data analysis techniques are applied to gain insights into the causes of deaths in the USA. Python's data analysis libraries allow for the examination of statistical measures, distribution analysis, and identifying any notable trends or outliers within the data.
SQL Queries for Data Manipulation: SQL queries are leveraged to further manipulate and transform the data as needed. This may involve aggregating data by specific criteria, calculating summary statistics, or creating new variables based on certain conditions. SQL's powerful querying capabilities provide flexibility in shaping the dataset to suit the analysis requirements.
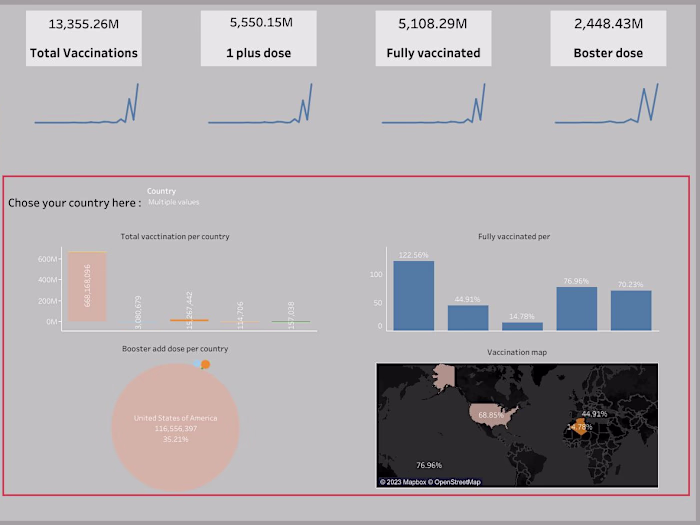
Visualization with Microsoft Power BI: Once the data is prepared and analyzed, the project transitions to Microsoft Power BI for data visualization. Power BI offers a user-friendly and intuitive interface to create interactive and visually appealing dashboards and reports. The cleaned and transformed dataset can be connected to Power BI, allowing for the creation of insightful visualizations such as line charts, bar graphs, and geographical representations.
Insights and Presentation: The project culminates in deriving meaningful insights from the data analysis and visualizations. These insights can provide valuable information on the distribution of causes of deaths, trends over time, regional variations, and potential correlations between variables. The findings can be summarized and presented through compelling visualizations and narratives using Microsoft Power BI, enabling effective communication to stakeholders, researchers, or the general public.
Download datawet from the link : here
Like this project
Posted Jul 21, 2025
Analyzed and visualized US death causes using Jupyter, SQL, and Power BI.
Likes
0
Views
3
Timeline
Feb 1, 2024 - Feb 29, 2024