Business Intelligence Dashboard for Expense Analysis
Ram Sharma
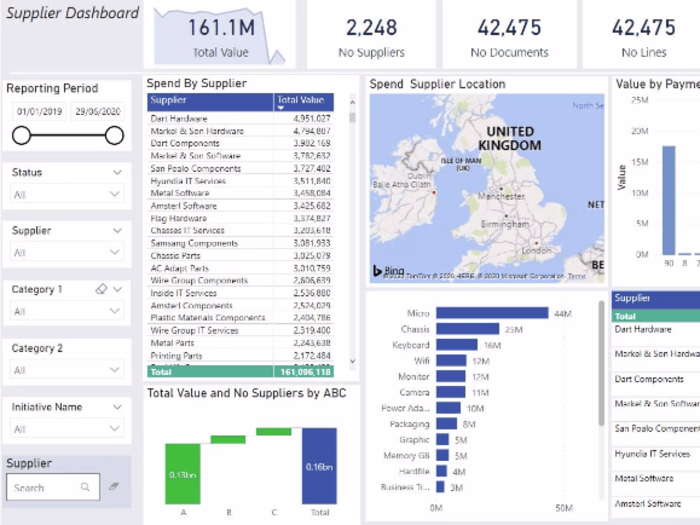
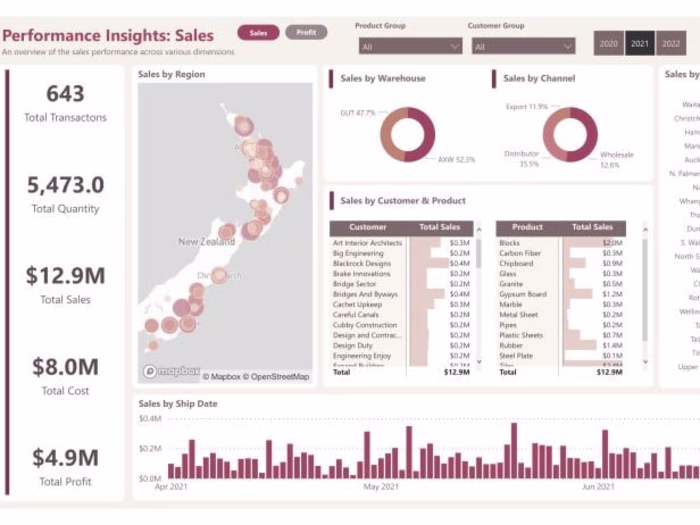
In spearheading the data visualization project focused on travel expense analytics, I revolutionized our approach to spend management through the development of a comprehensive BI Dashboard. By seamlessly connecting PowerBI to Microsoft SQL Server, I automated the entire report creation process, leveraging Power Query for data extraction and transformation. The Power Query manipulations included converting data types and eliminating outliers, ensuring data accuracy and relevance. Utilizing DAX in the Data view, I engineered logic-driven fields, established crucial relationships among tables, and employed diverse graph types for optimal data representation. The culmination of this effort resulted in a dynamic dashboard that not only automated the refresh process but also streamlined delivery to stakeholders via PowerBI Service and Microsoft Power Automate. This strategic initiative translated into tangible results, with a remarkable 25 working hours saved annually, empowering senior leadership with real-time insights for effective travel expense management and informed decision-making in expense pre-approval processes.
Like this project
Posted Dec 27, 2023
Revolutionized travel expense analytics with a dynamic BI Dashboard, automating data extraction, transformation, and delivery. Resulted in 25-hour annual time
Likes
0
Views
12