Resilient Monitoring Stack for Hybrid Infrastructure
Neil Hanlon
Resilient Monitoring Stack for Hybrid Infrastructure
Building systems is easy. Knowing when they’re on fire? That’s the hard part.
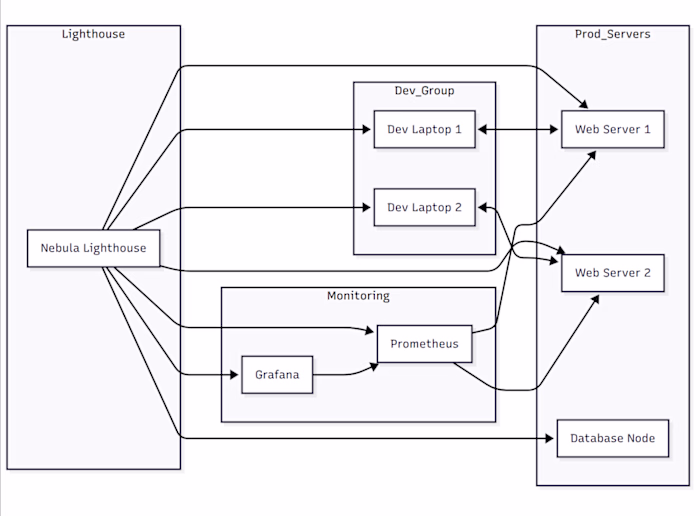
This project involved designing and deploying a full observability stack for a hybrid infrastructure spread across cloud and bare metal nodes. The client had fragmented metrics, no centralized logging, and alert fatigue that made on-call rotations a nightmare.
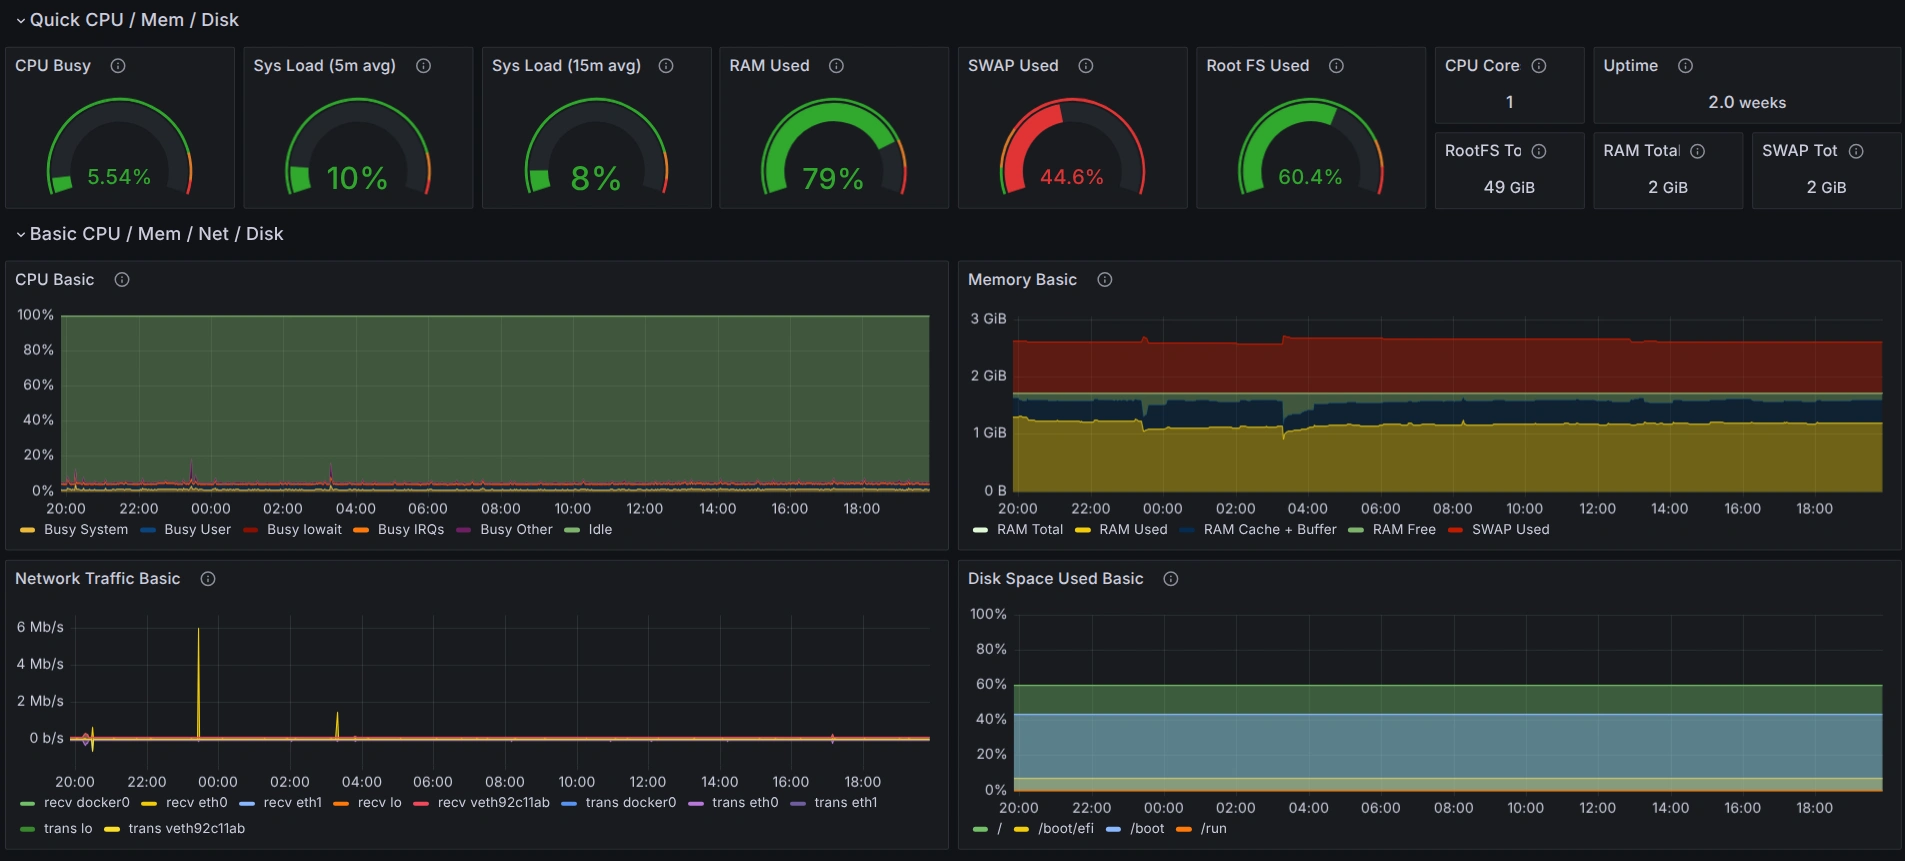
I implemented a clean, modular stack using Prometheus, Grafana, Loki, and Alertmanager. All components were provisioned via Ansible and containerized for portability. We defined meaningful alerting thresholds, routed pages based on severity and ownership, and built dashboards that weren’t just “graphs for graphs’ sake.”
The result: faster incident response, cleaner postmortems, and a team that could actually trust what the dashboards were telling them.
I still consider this the gold standard for small-to-medium teams needing real SRE tooling without going full “big cloud” vendor lock-in.
Like this project
Posted Jul 26, 2025
Designed and deployed an observability stack for hybrid infrastructure.