listenlab - Streamlit Spotify Data Dashboard

Sydney Grignon


listenlab - Personal Spotify Listening History Dashboard
A Streamlit dashboard that turns messy Spotify data exports into clean, interactive insights. Built with Python and pandas.
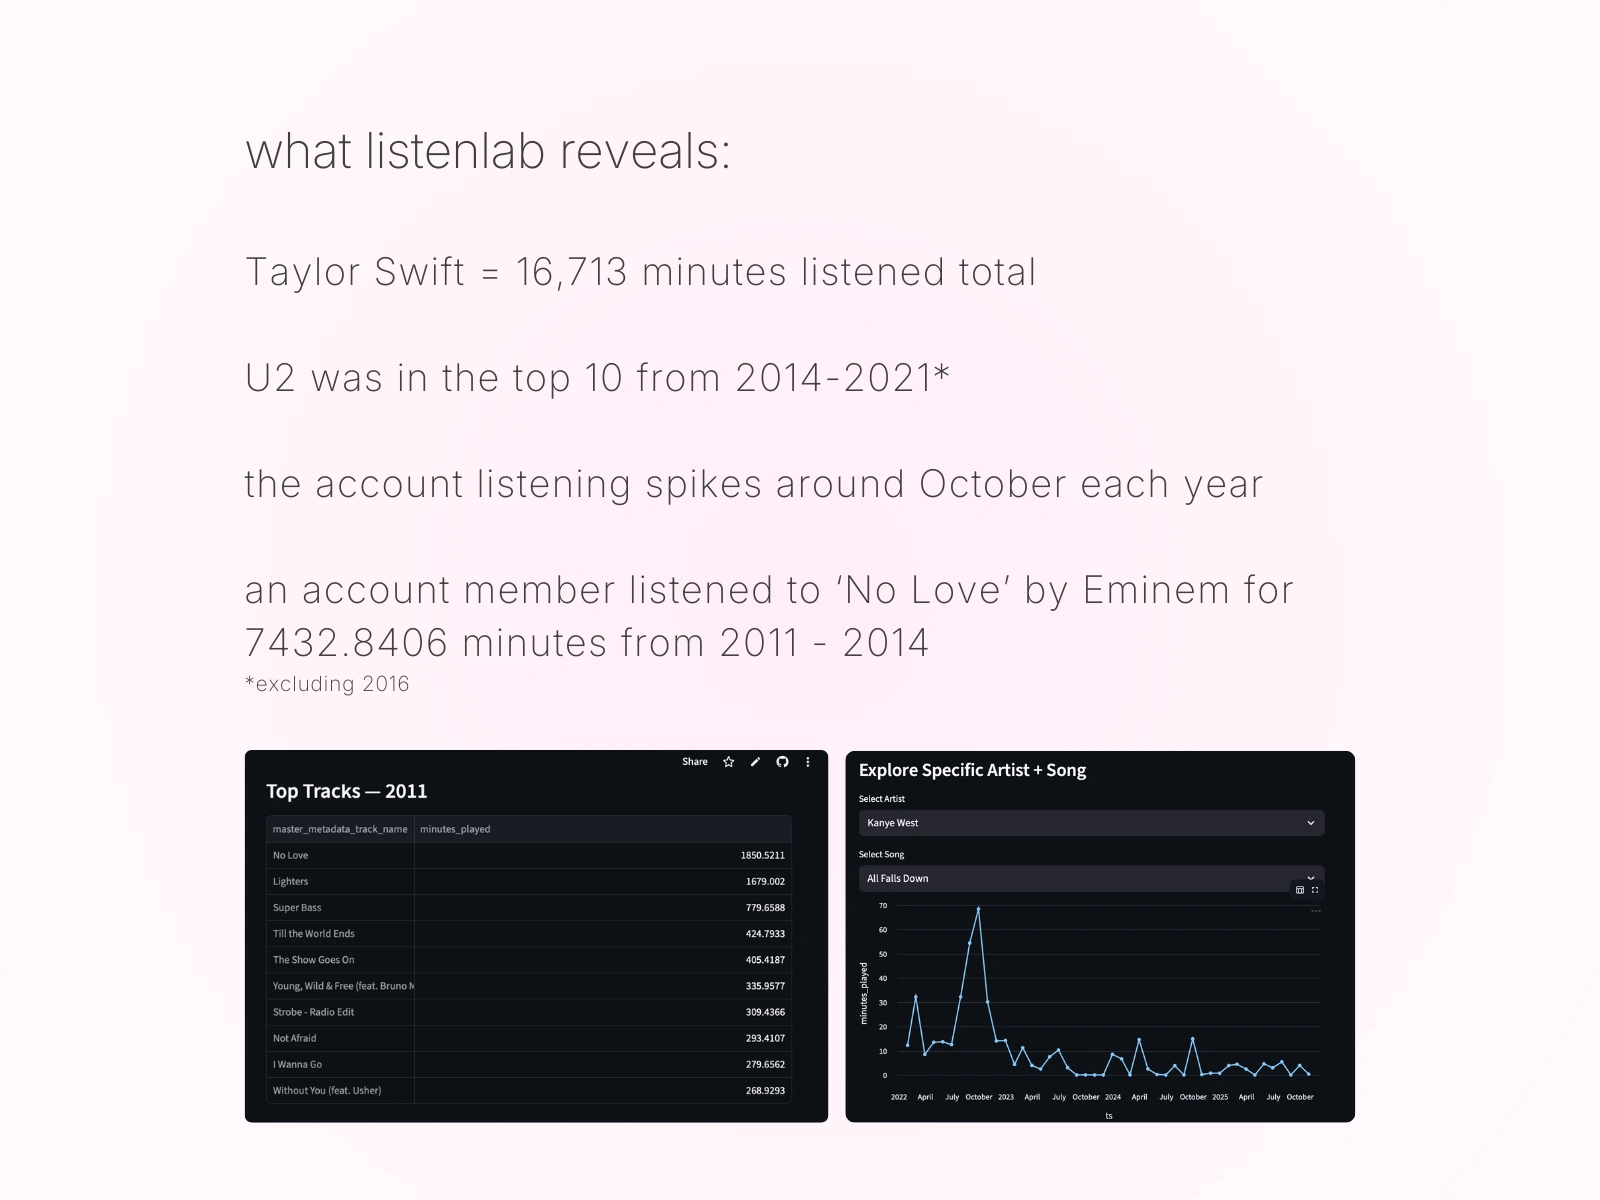
Real insights extracted from raw Spotify data: top artists, track minutes, and long-term listening patterns that highlight yearly cycles, spikes, and habits.
Overview
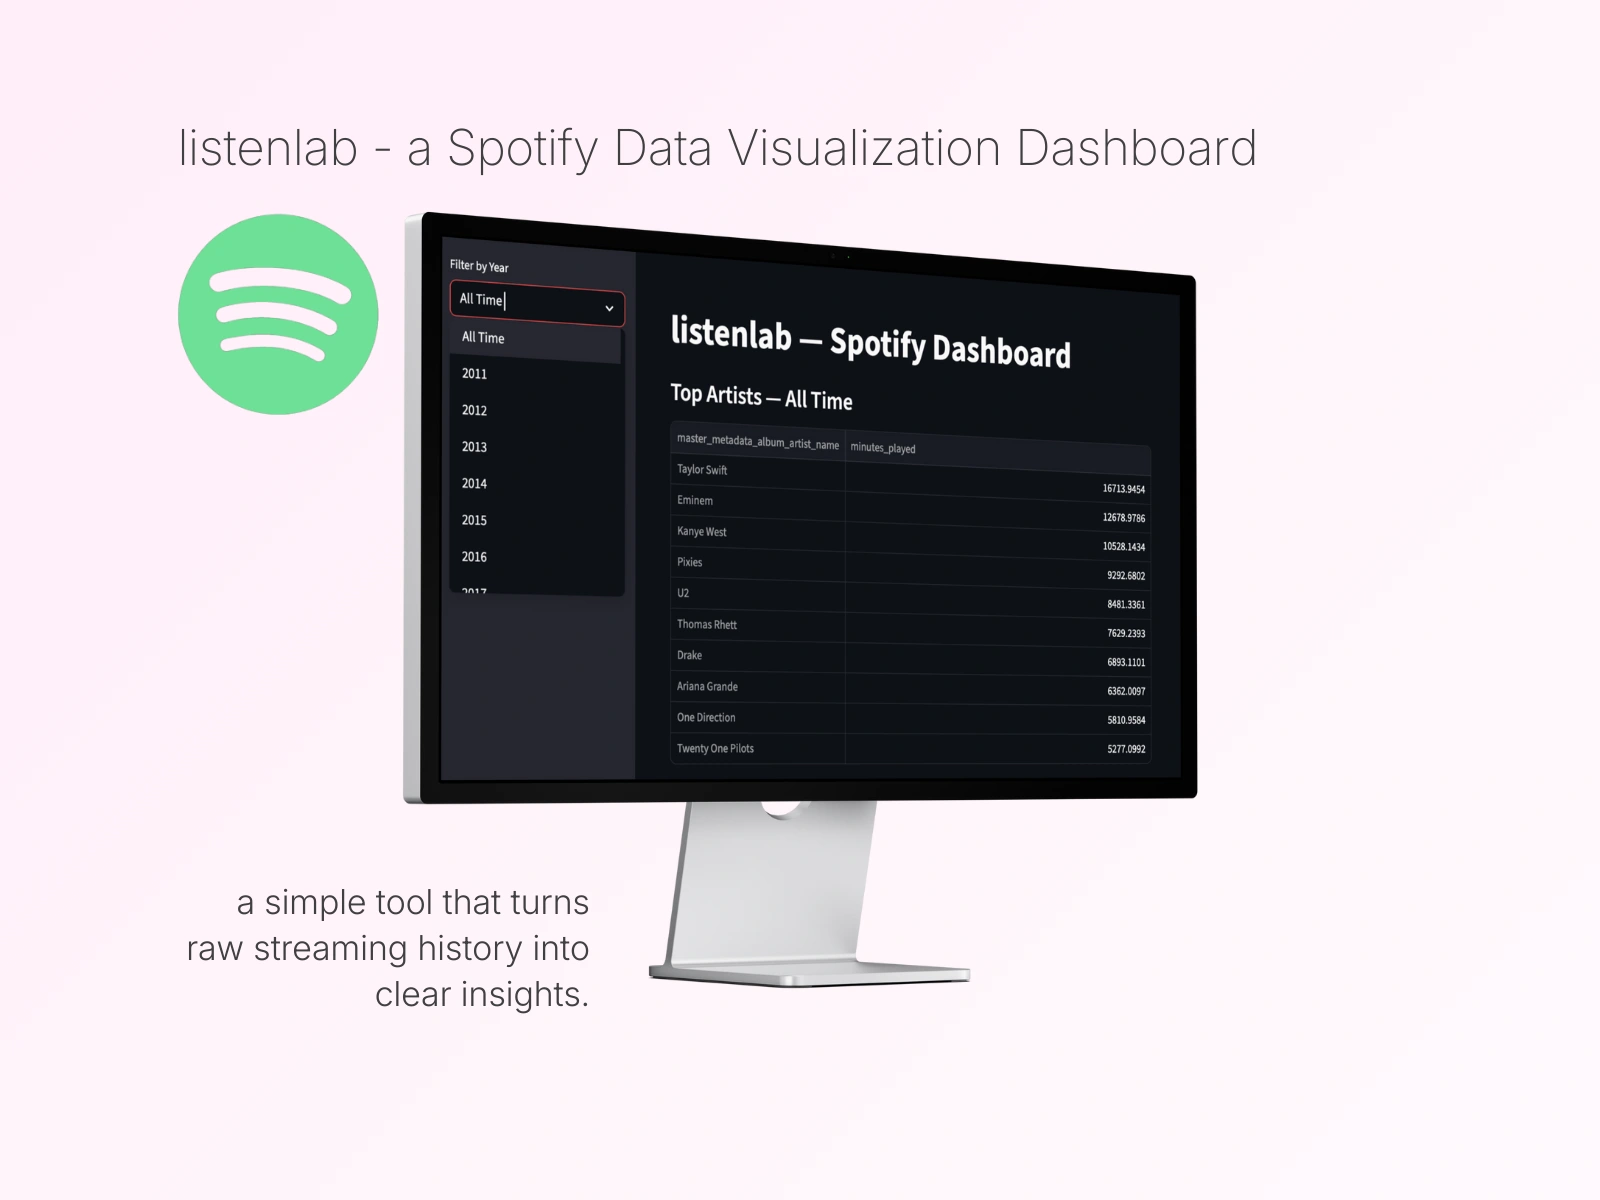
listenlab lets users upload their Spotify data export and instantly see their top artists, top tracks, and long-term listening patterns. The app parses multiple JSON files from Spotify’s privacy export and merges them into a unified dataset, then displays it through interactive charts and filters.
I built it in a day because I wanted a better way to explore my own music history, and realized it was a great example of fast end-to-end development. It shows my ability to work with real data, build tools quickly, and ship polished features even on small projects.
Tech Stack
ListenLab is built with Python using Streamlit for the UI layer.
The app reads and merges JSON files from Spotify’s data export, cleans and aggregates the data with Pandas, and renders interactive charts through Streamlit’s built-in plotting tools.
For deployment, the app runs on Streamlit Cloud, with environment setup handled through requirements.txt.
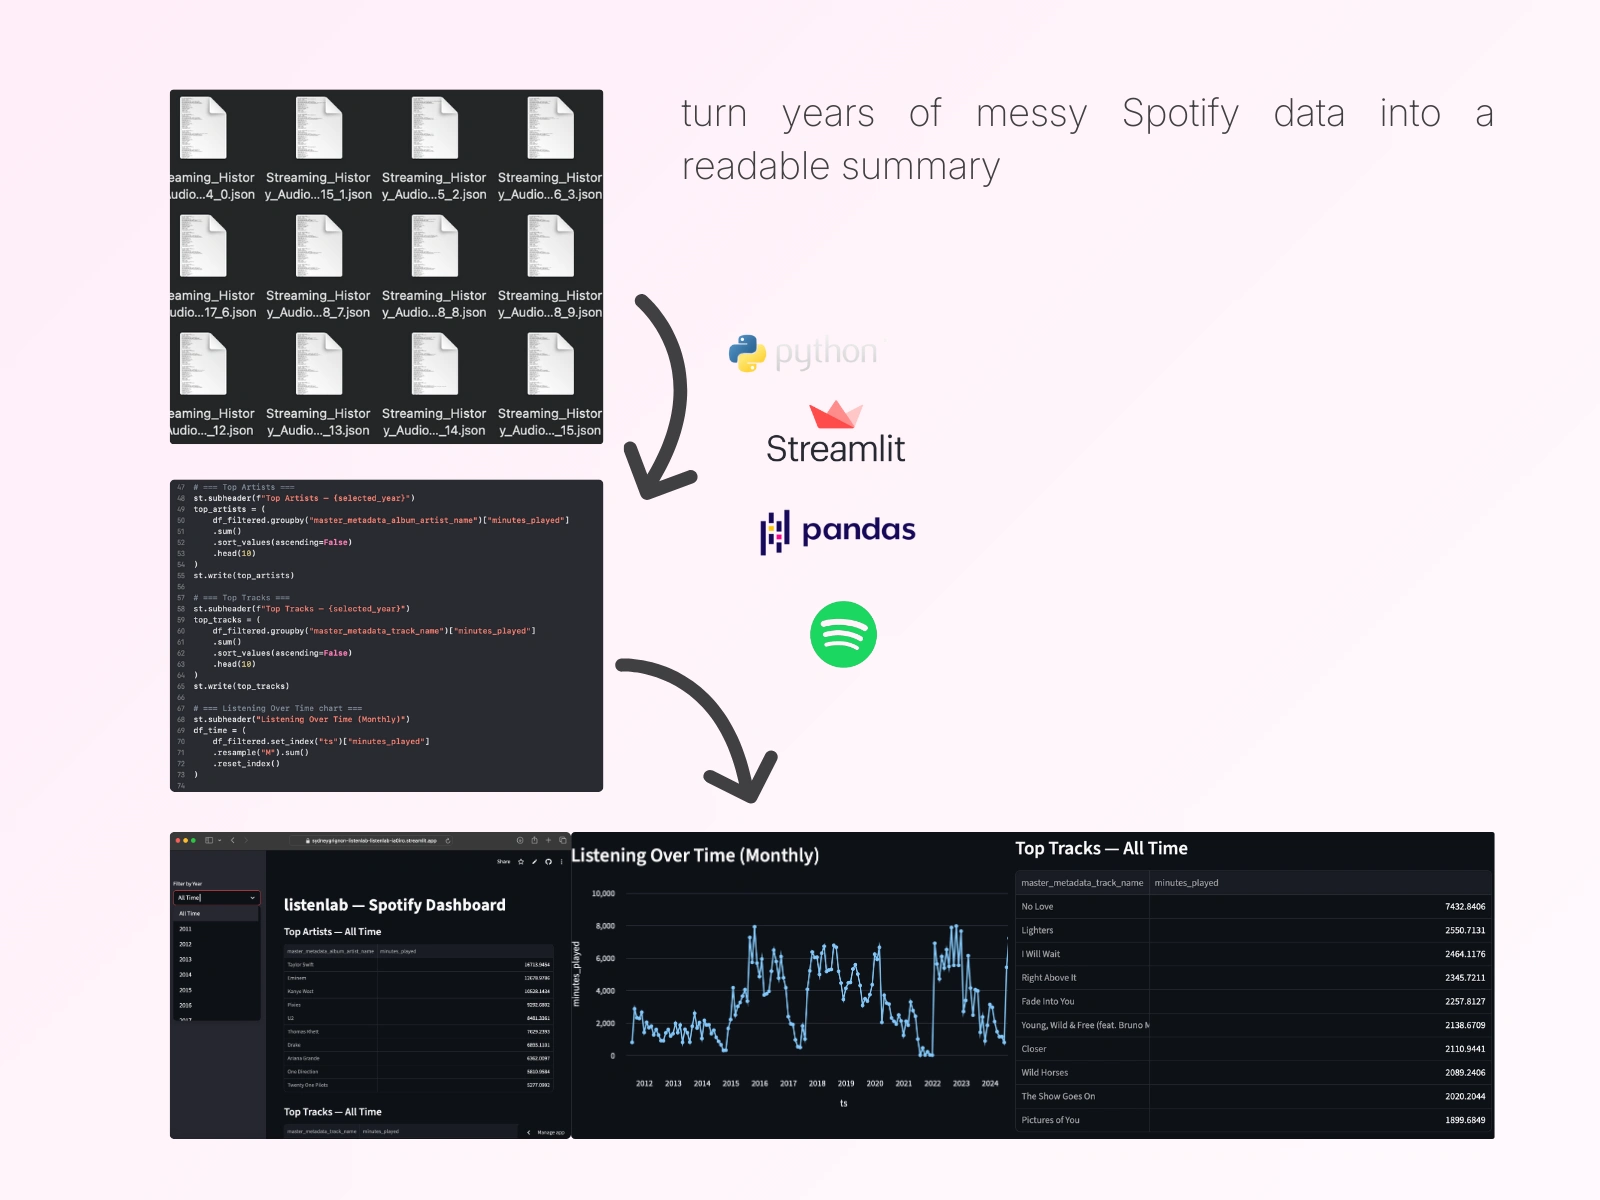
The data pipeline: multiple JSON files are cleaned and merged using pandas, processed into meaningful insights, and visualized through Streamlit.
Features
• Top artists of all time
• Top tracks of all time
• Listening history timeline (month-by-month trends across 10+ years)
• Filter listening data by year
• Explore by artist and by individual track
• Automatic merging + cleaning of Spotify’s multiple JSON export files
• Clean Streamlit UI with interactive charts
• Built with Python, pandas, and Streamlit
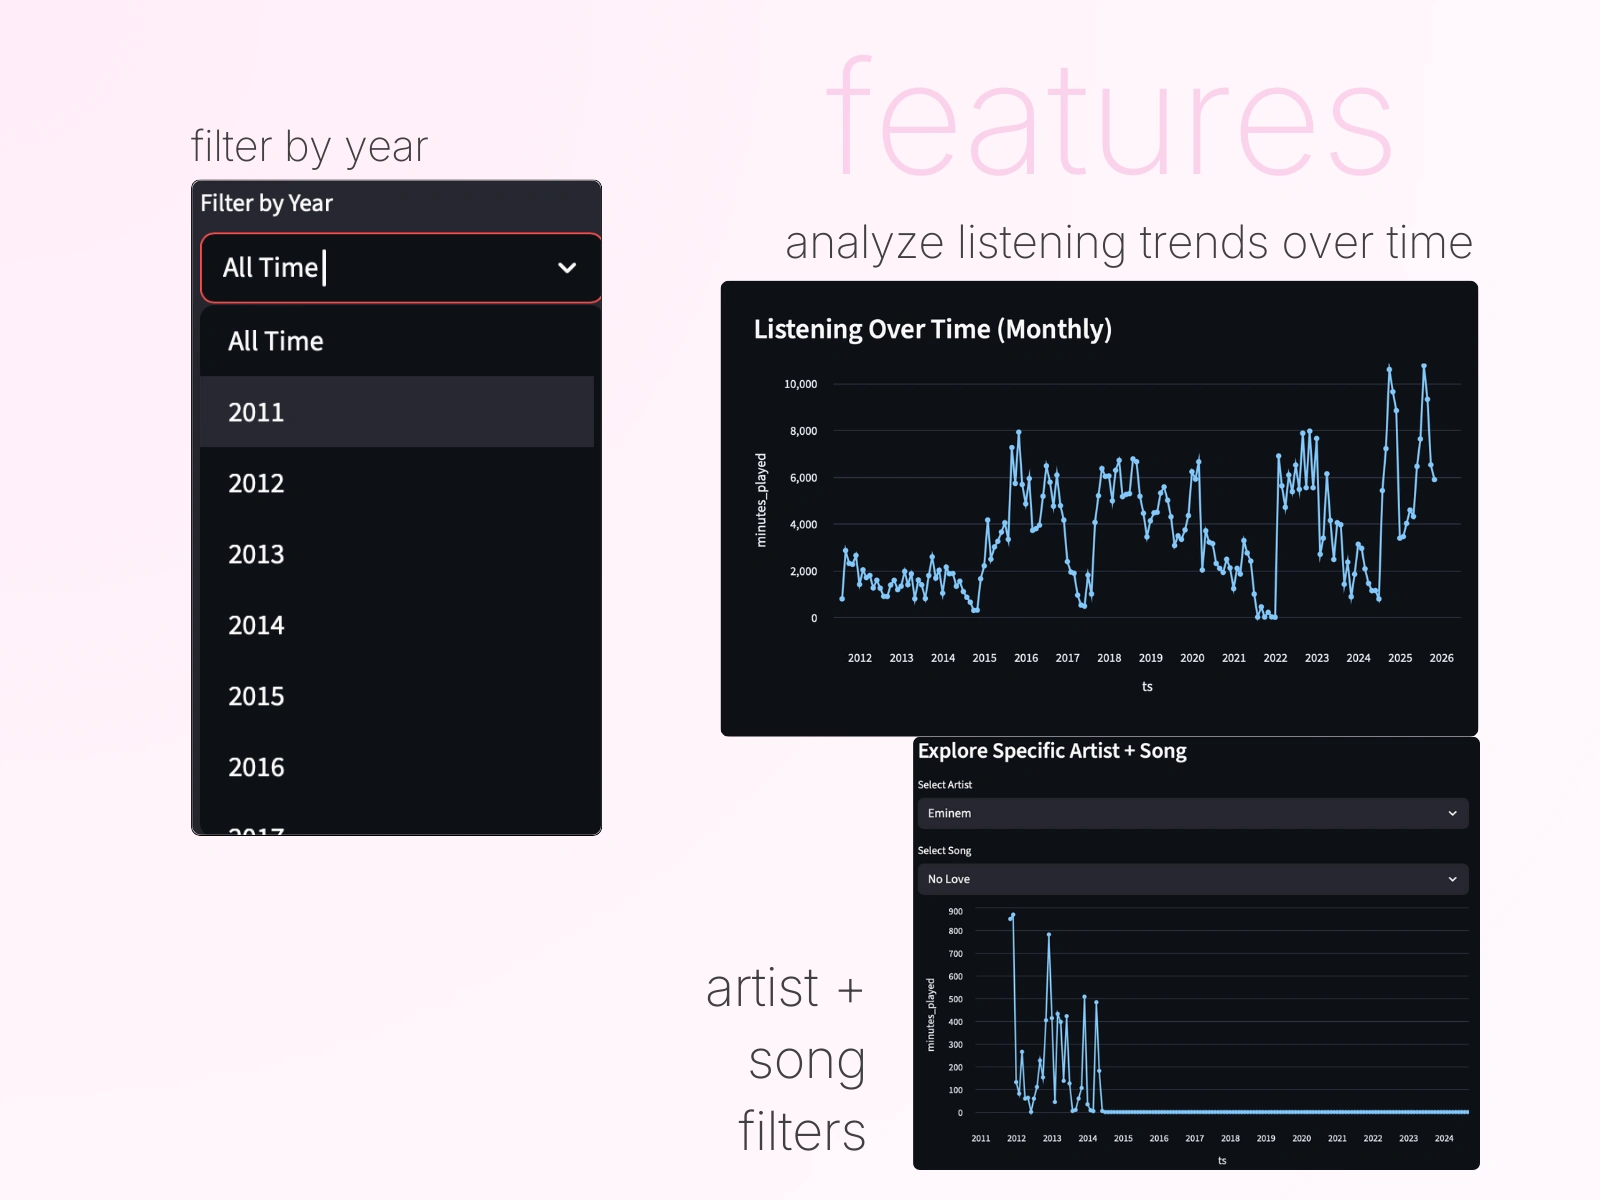
Interactive filtering and trend visualization: switch between years, compare artists, and break down listening behavior over time.
Why I Built It
Spotify’s native “Wrapped” is fun, but it doesn’t let you dig into your full history. I wanted something deeper, customizable, and actually useful. I also wanted a small project to showcase my Python + data + deployment skills. Something that shows I can build functional tools with real data in a single day.
ListenLab is simple, but it does its job well. It’s the kind of fast MVP I love building.
Like this project
Posted Dec 9, 2025
A Streamlit dashboard that visualizes a user’s full Spotify listening history. Built in Python with Streamlit and Pandas, deployed on Streamlit Cloud.