Microsoft Power BI Report Demo (Hospitality)


The semantic model's source was a 25,000-row sales/orders .csv file from a restaurant chain.
Colors were chosen based on the company's logo. The company's true name and the names and locations of its branches are masked. The clients' names are fictional and were added to the dataset programmatically.
Certain visuals (such as the KPI and Gauge visuals) were not part of the original report and were added here purely for aesthetic purposes.
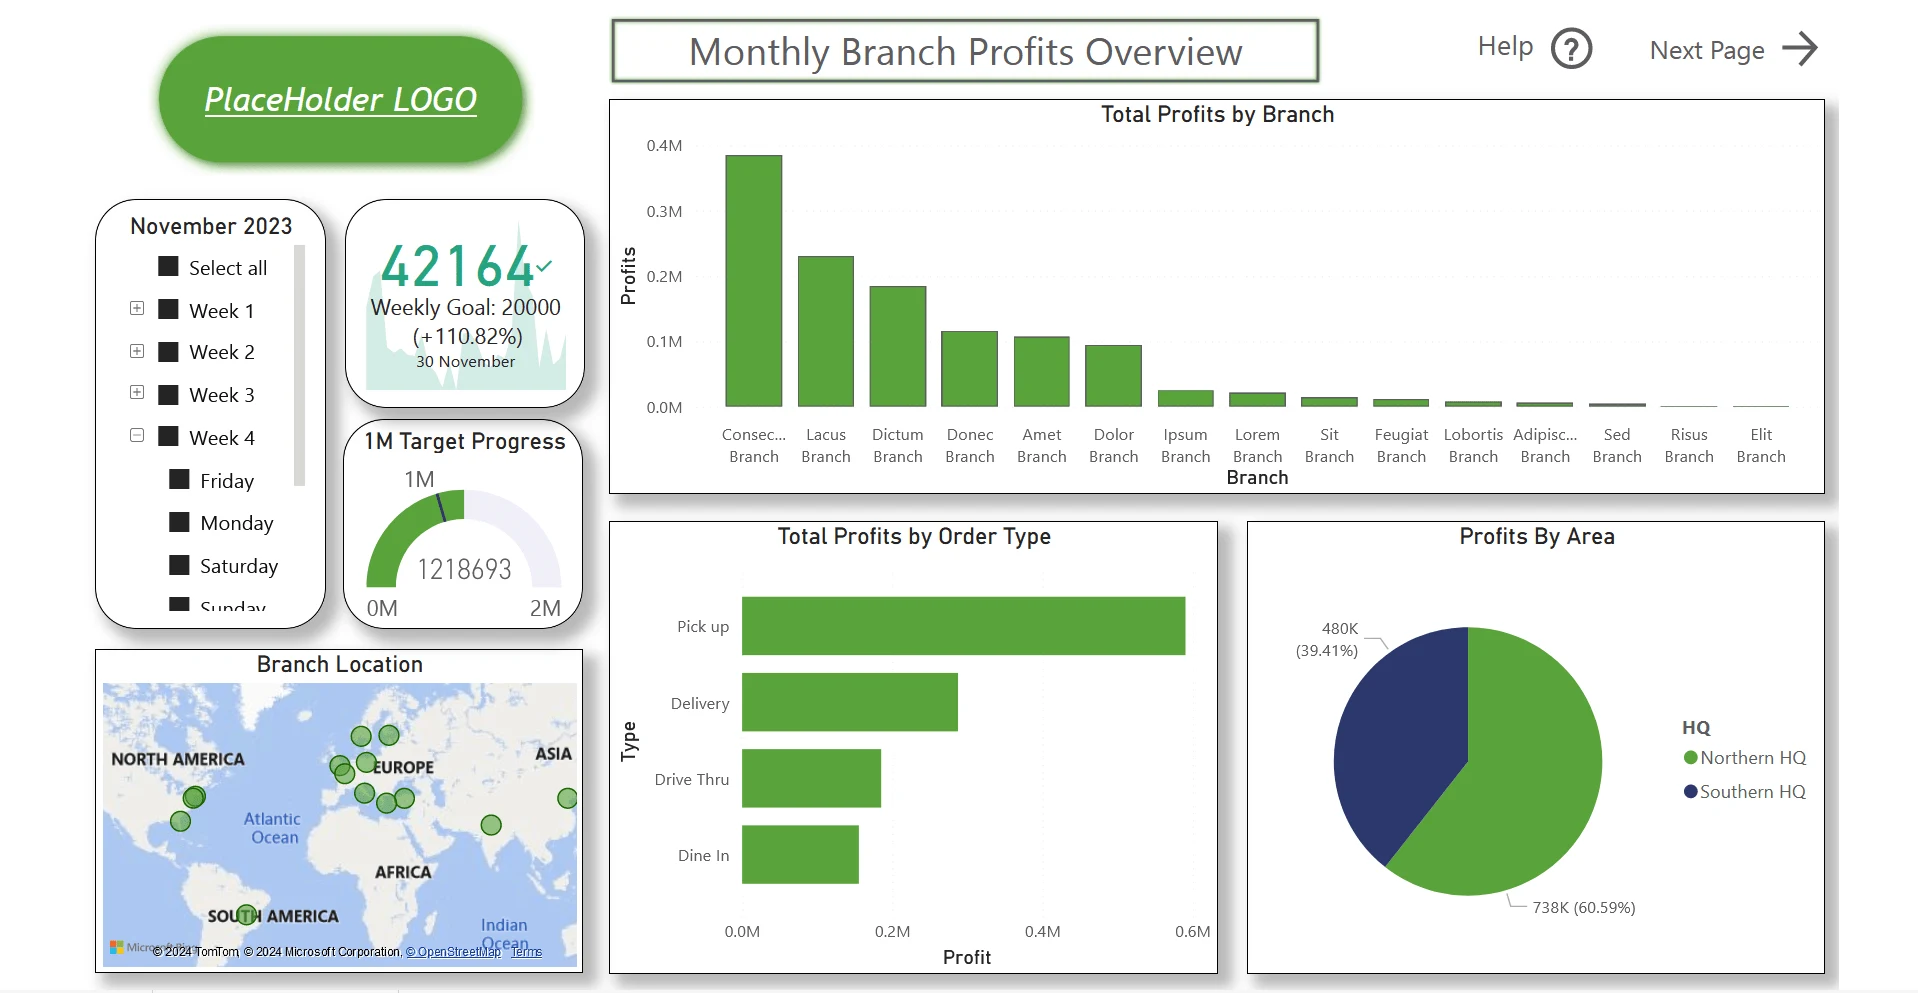
Overview Page
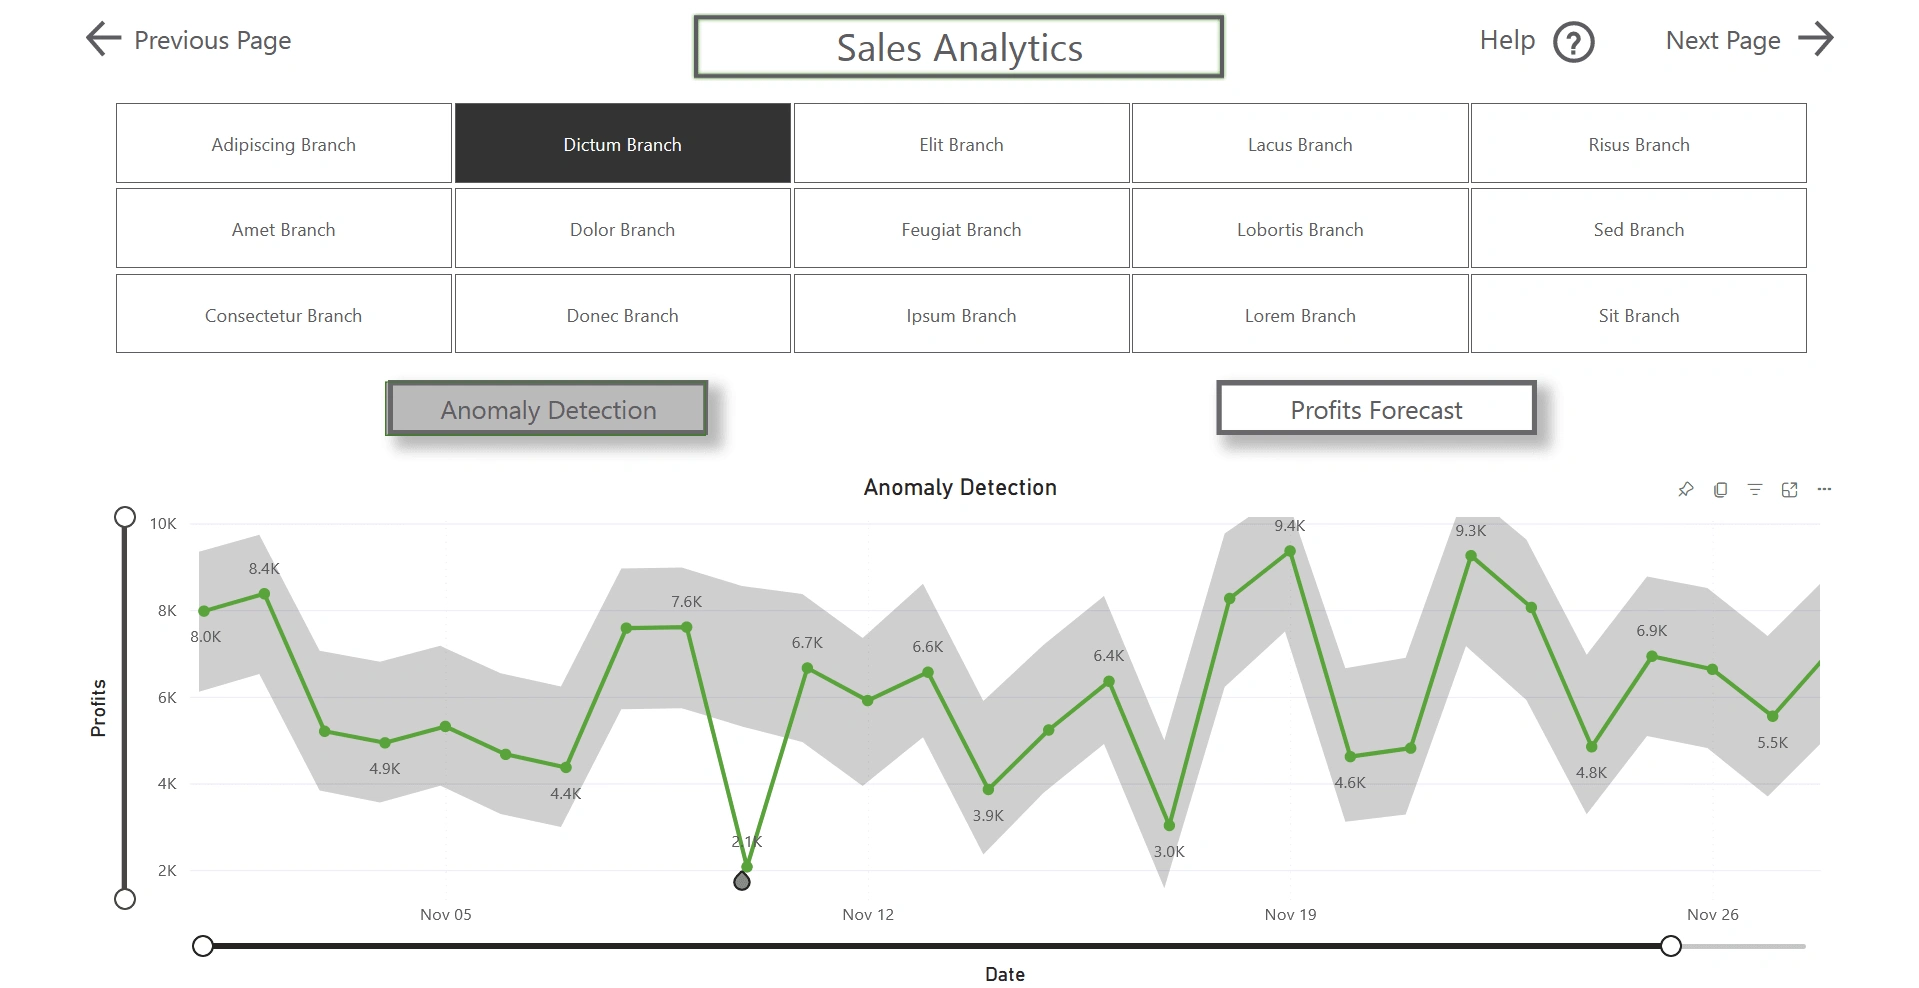
Anomaly Detection
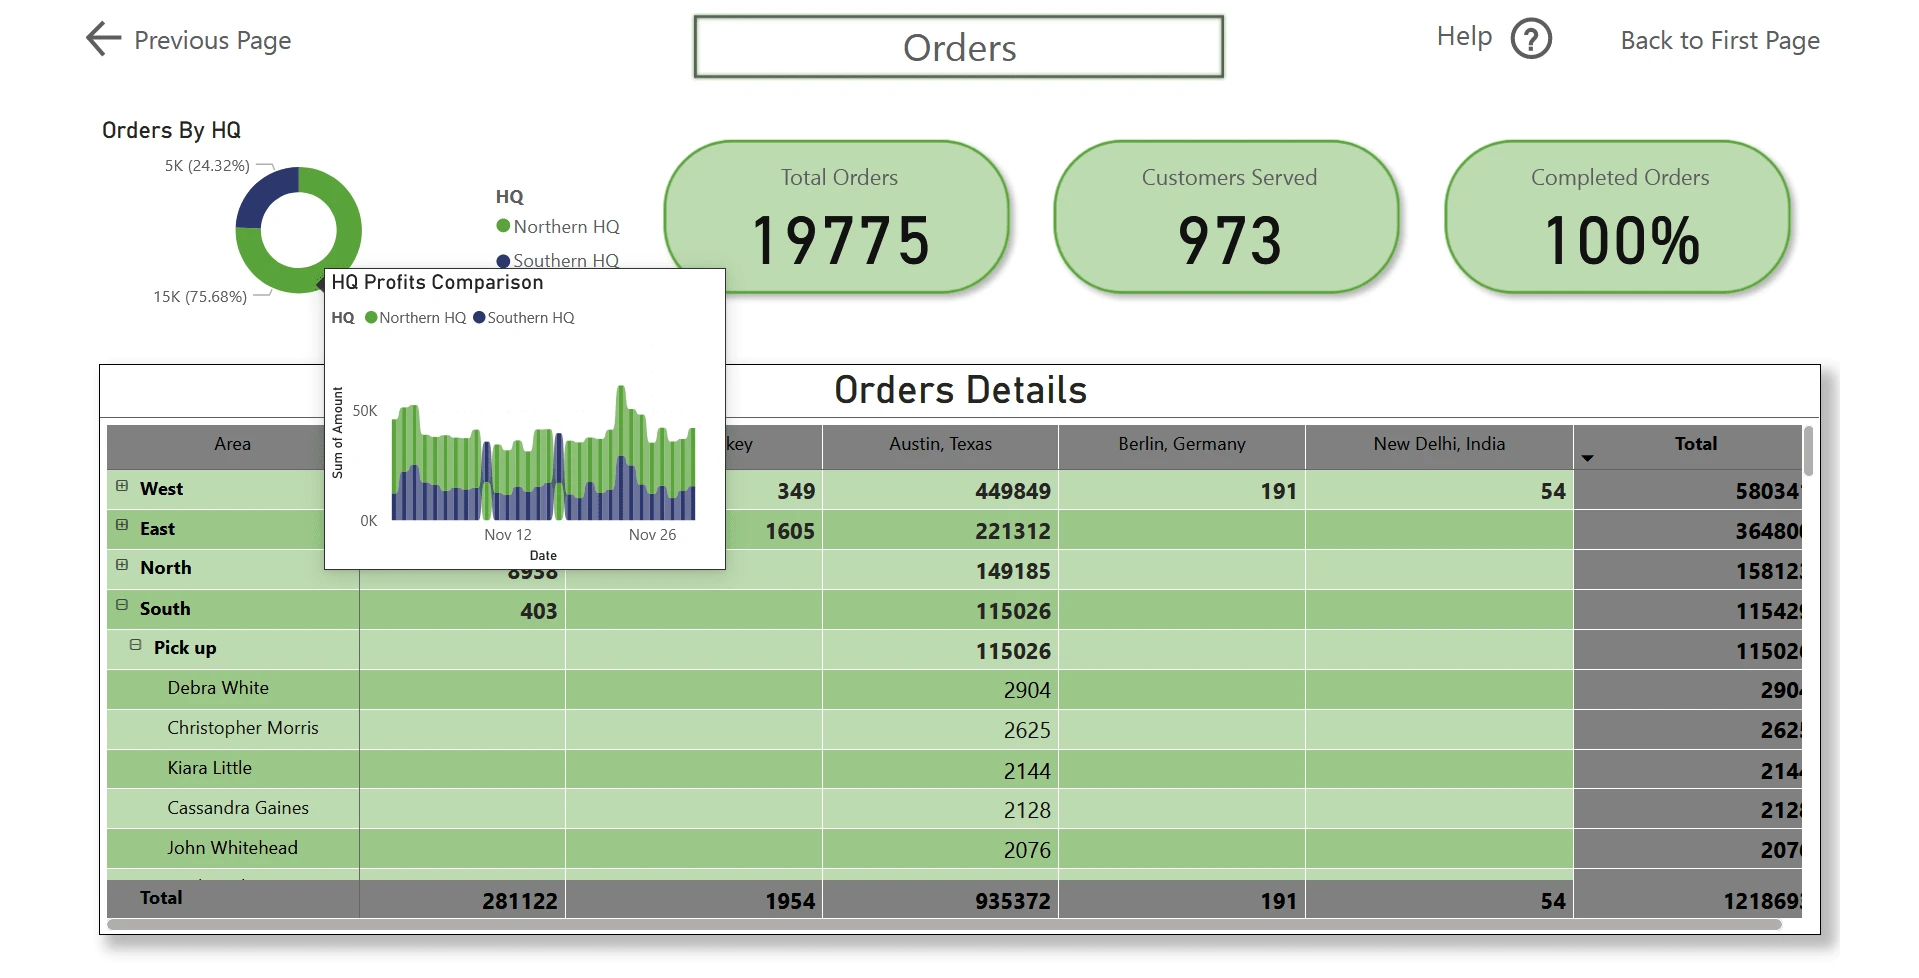
Orders Page (Differs from original)
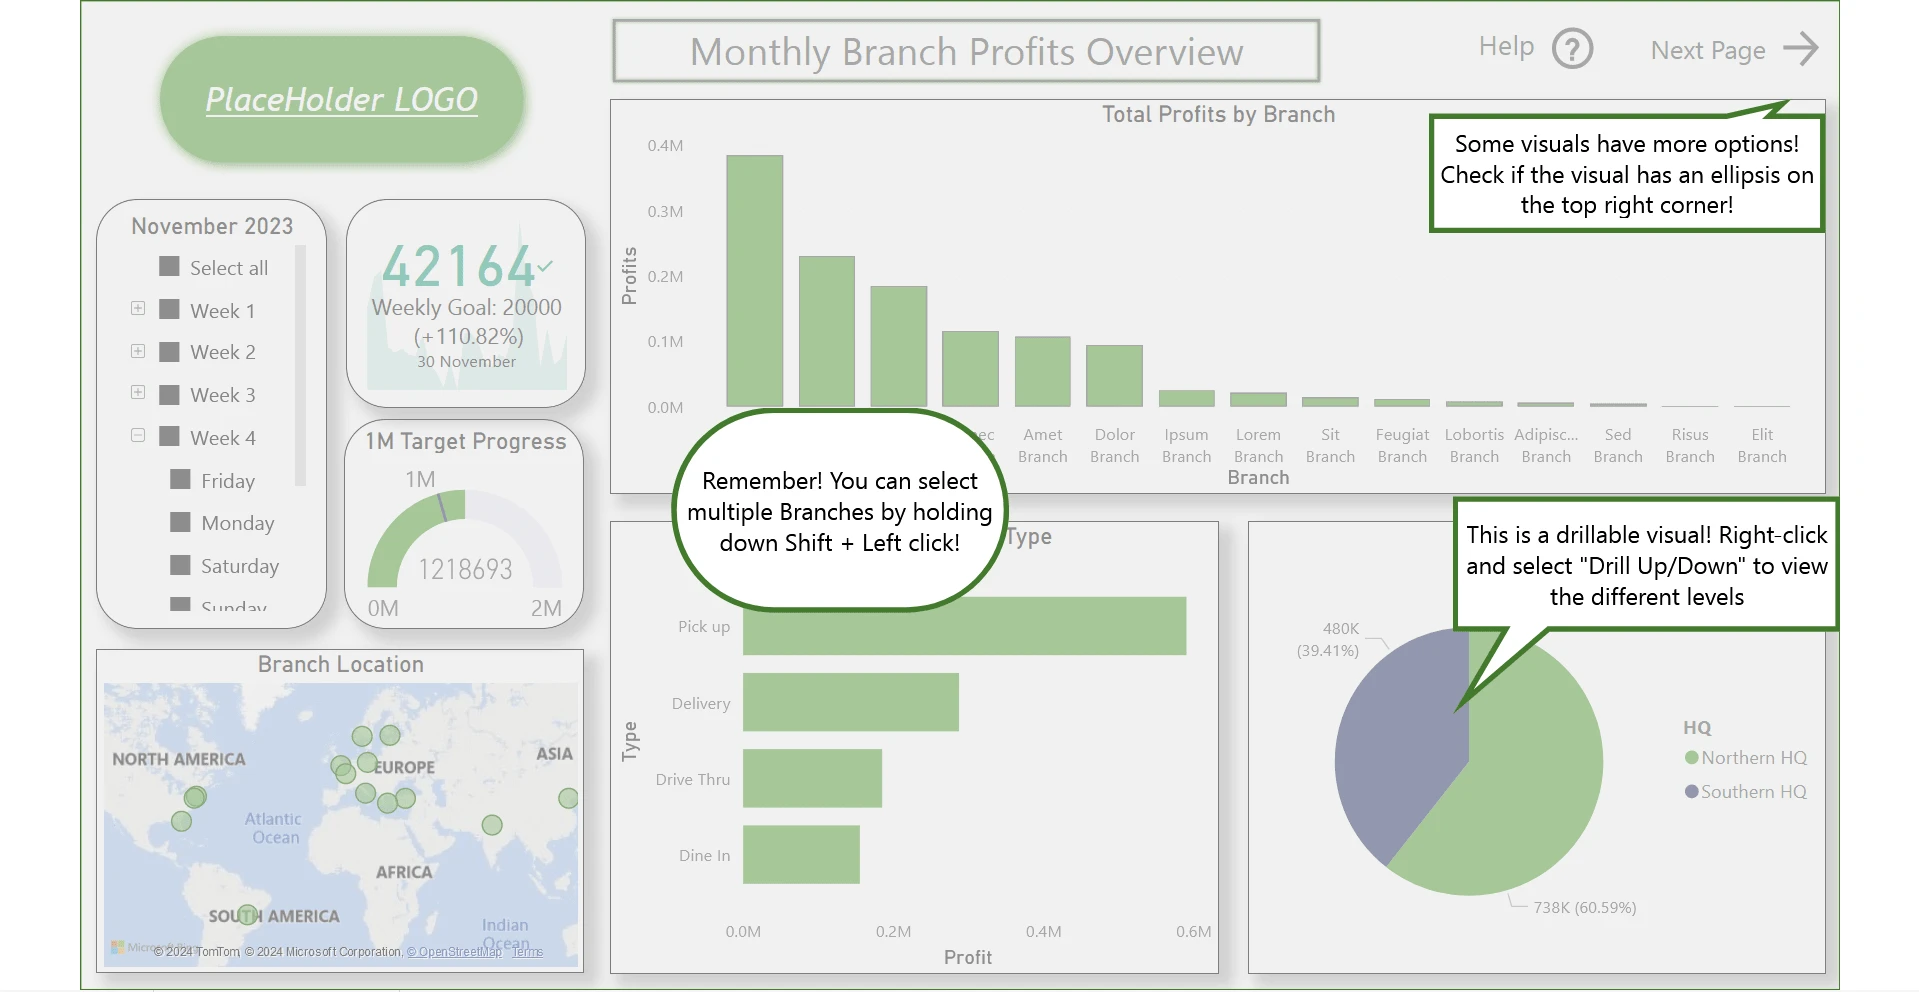
Help Button
Like this project
0
Posted Jan 13, 2025
Demo version of a multi-page Power BI interactive report (as viewed in Microsoft Fabric), developed for a client within the hospitality industry.
Likes
0
Views
2


Power BI Project Demo (Marketing)

Streamlit Visualization App Demo