DataSight: B2B SaaS Series A Pitch Deck Design

Miftah Fahmi



DataSight: B2B SaaS Series A Pitch Deck Design — original cover slide
Overview
I designed a 19-slide Series A pitch deck for DataSight, a fictional B2B SaaS platform for customer intelligence in e-commerce. The presentation connects fragmented customer signals with a product workflow, commercial model, and capital plan. Company data, people, and customer examples are illustrative.
The Challenge
The deck needed to explain a data-heavy product while keeping growth, retention, pricing, and unit economics easy for investors to follow. Each slide required a clear reading task.
Design Approach
I structured the product story around Unify, Predict, and Activate. Glass-cube illustrations make the flow from separate signals to a unified profile visible. The product UI focuses on one at-risk segment, its revenue impact, and a recommended action. Cobalt blue, deep navy, Manrope typography, and contrasting light and dark slides connect the presentation. My work covered art direction, presentation design, custom data visualization, product storytelling, and AI-assisted artwork integration.
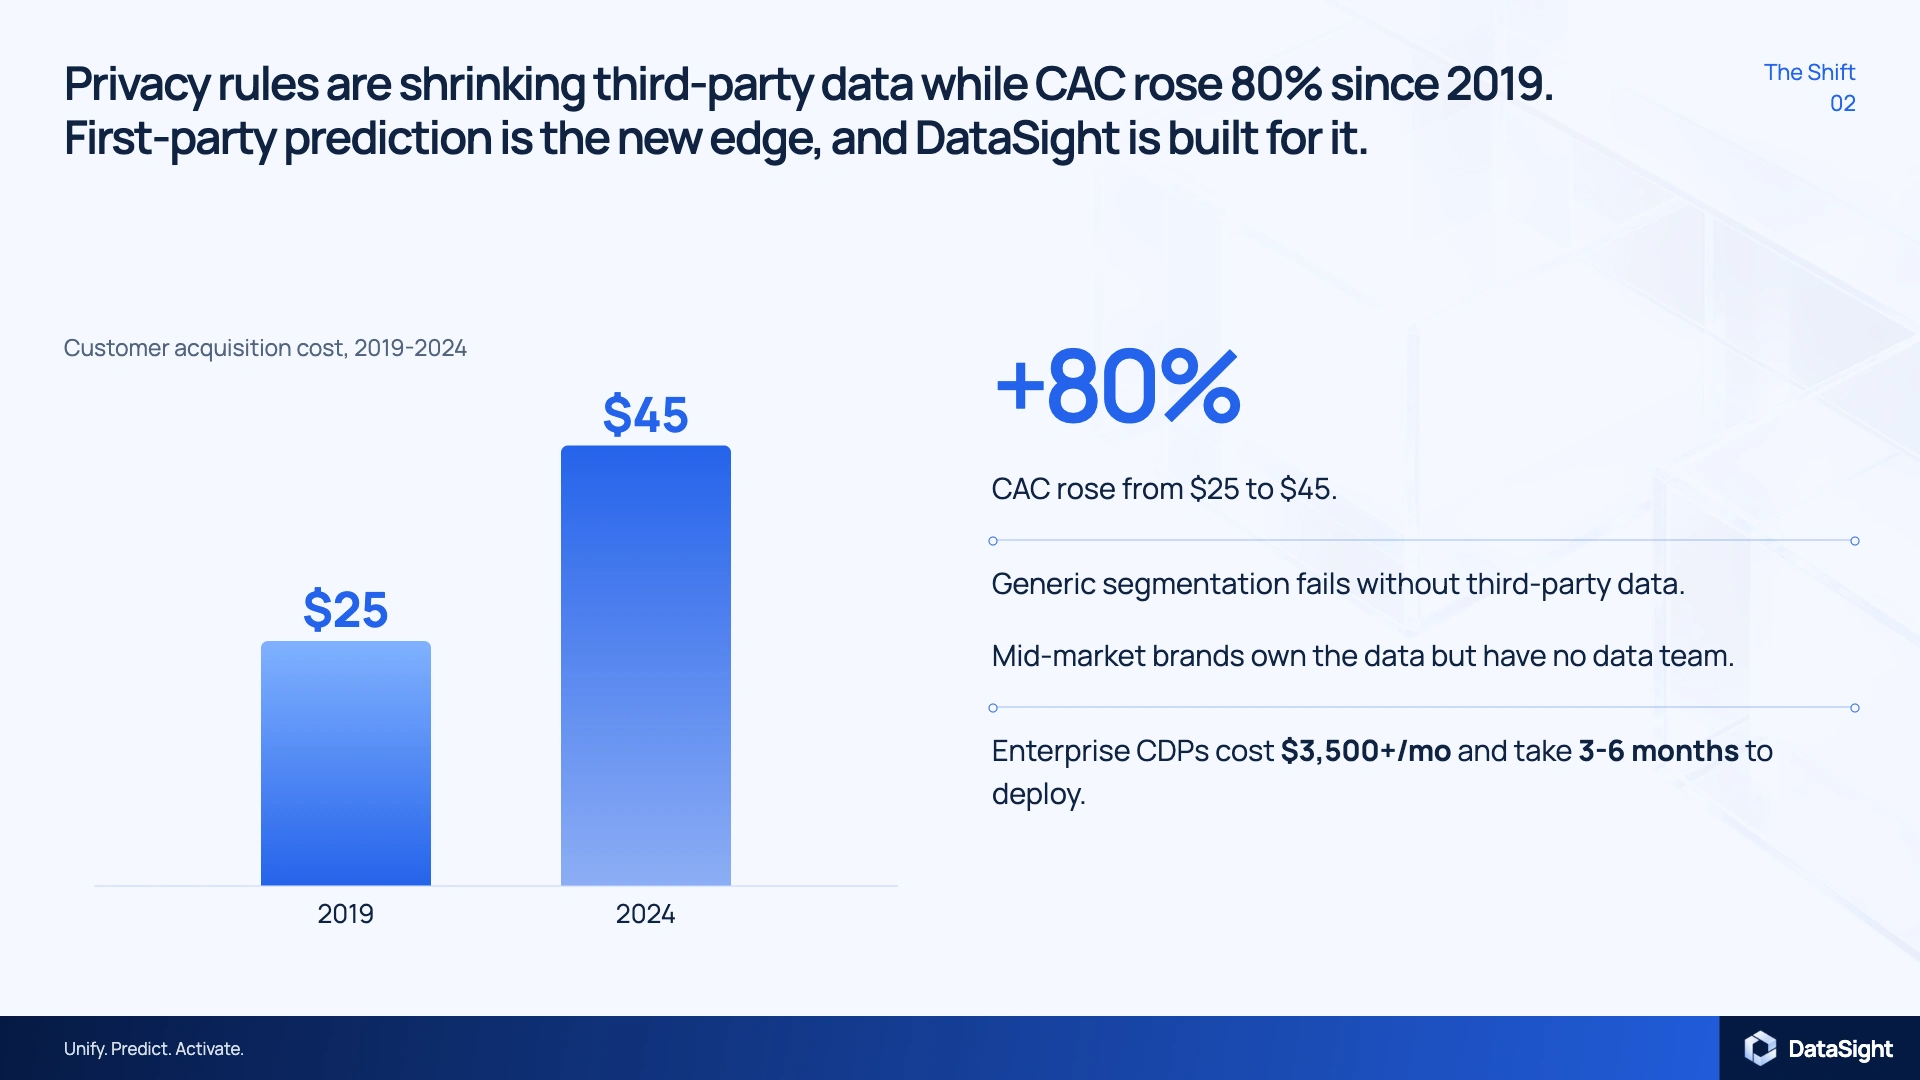
Market shift slide using an illustrative customer acquisition cost comparison
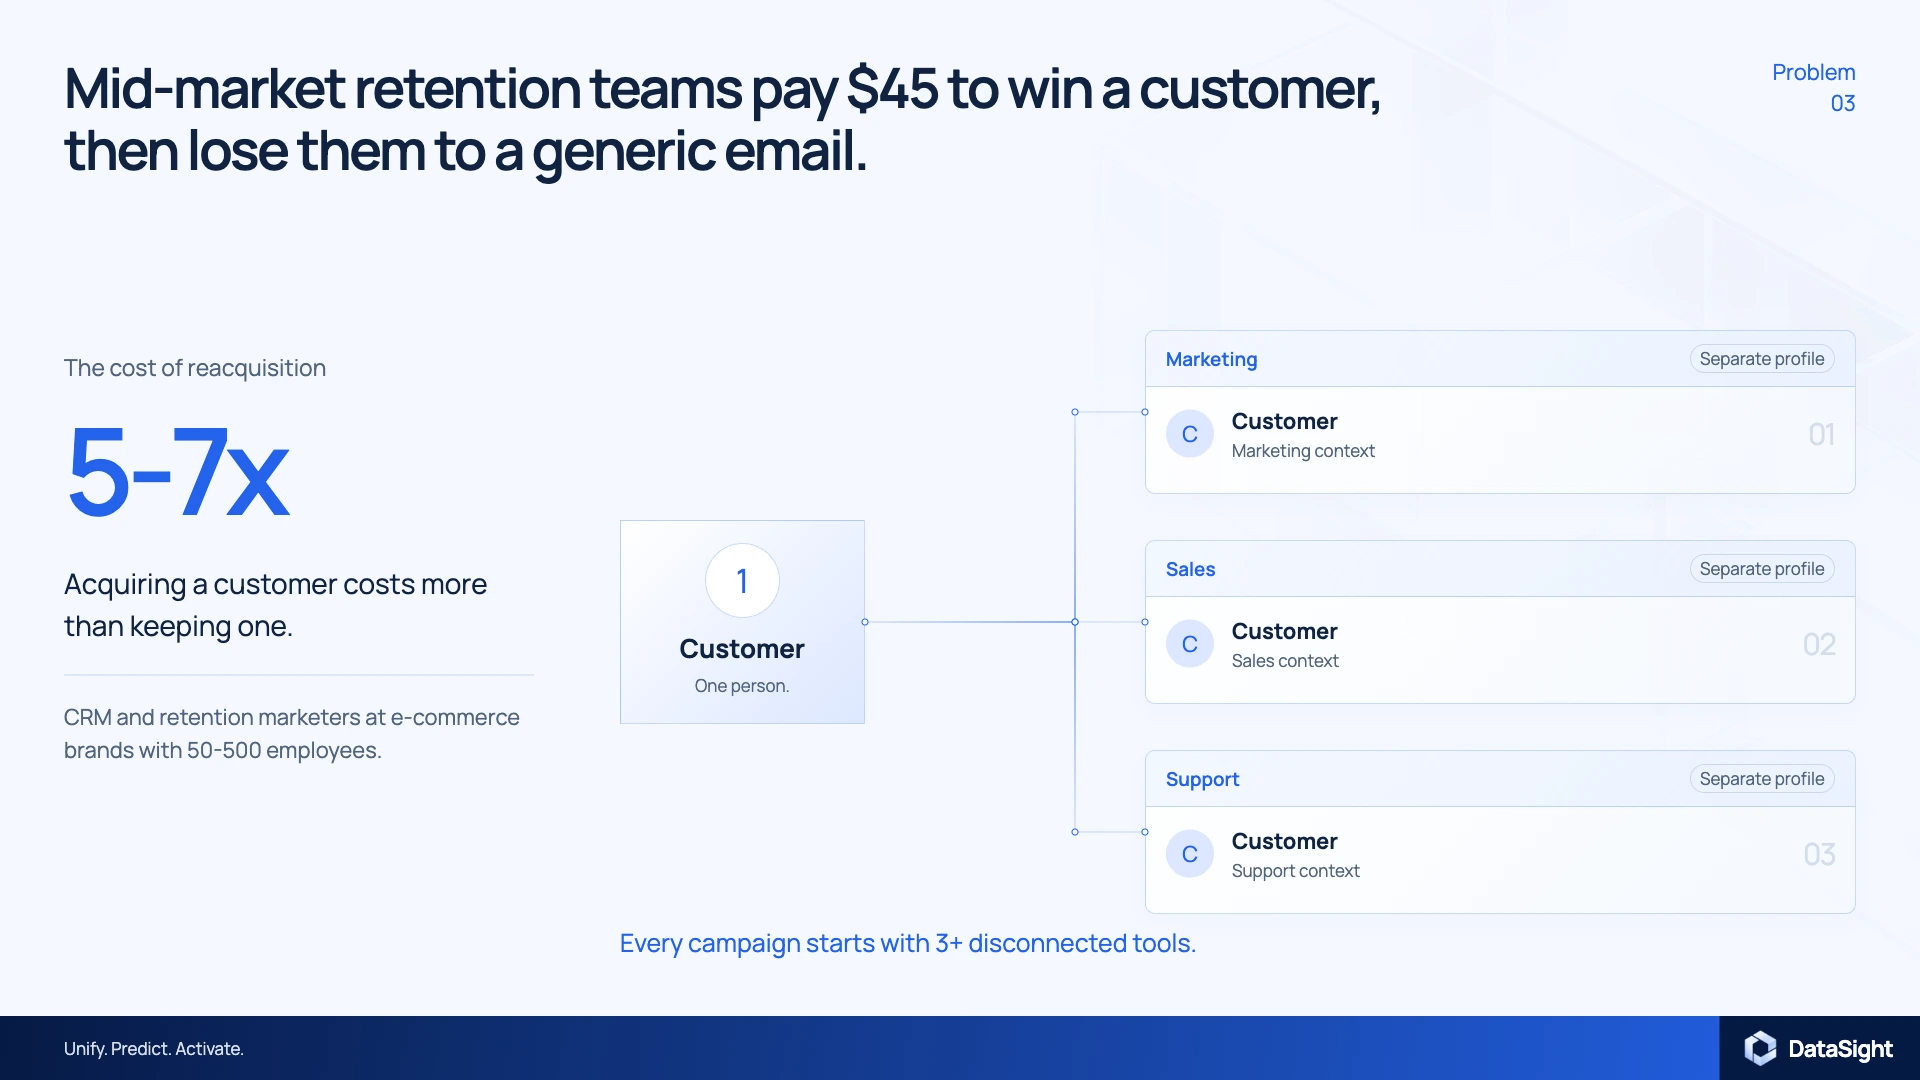
Problem slide showing disconnected marketing, sales, and support customer profiles
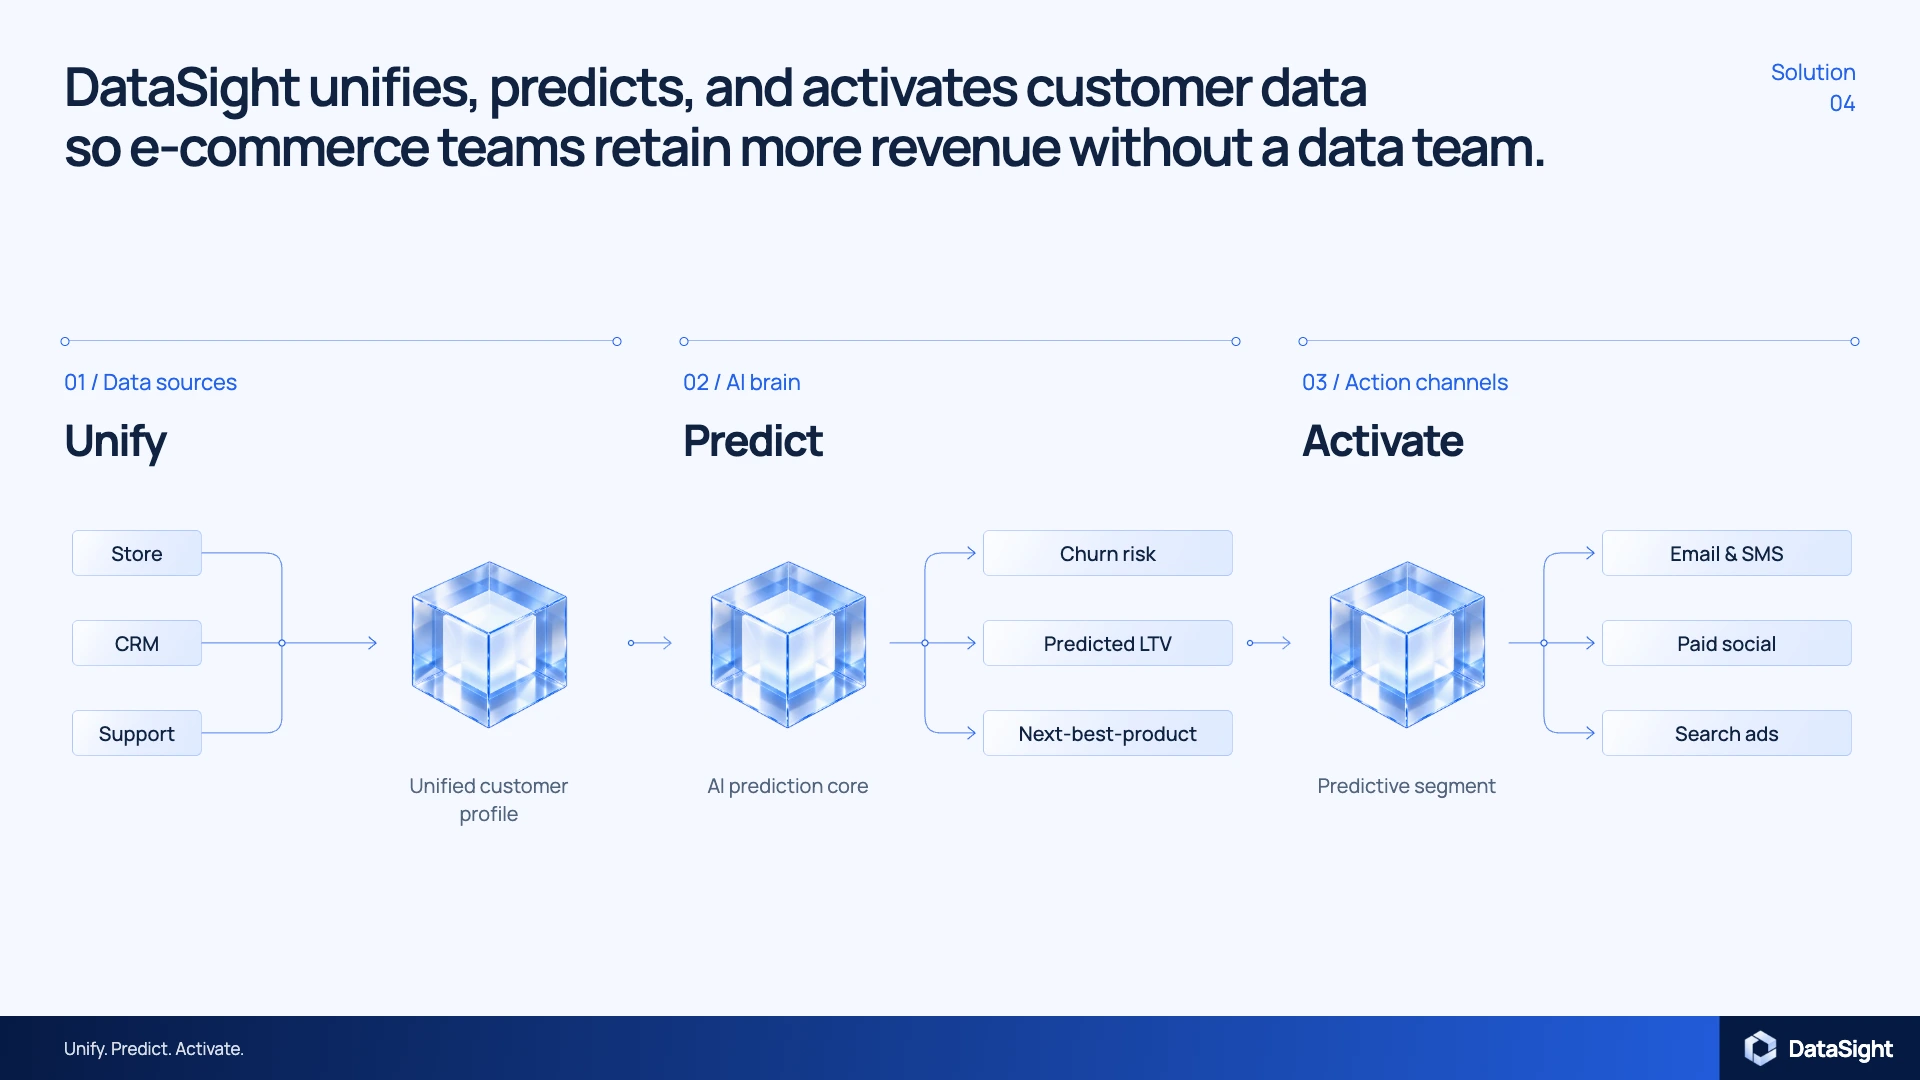
Solution slide mapping Unify, Predict, and Activate through connected glass-cube diagrams
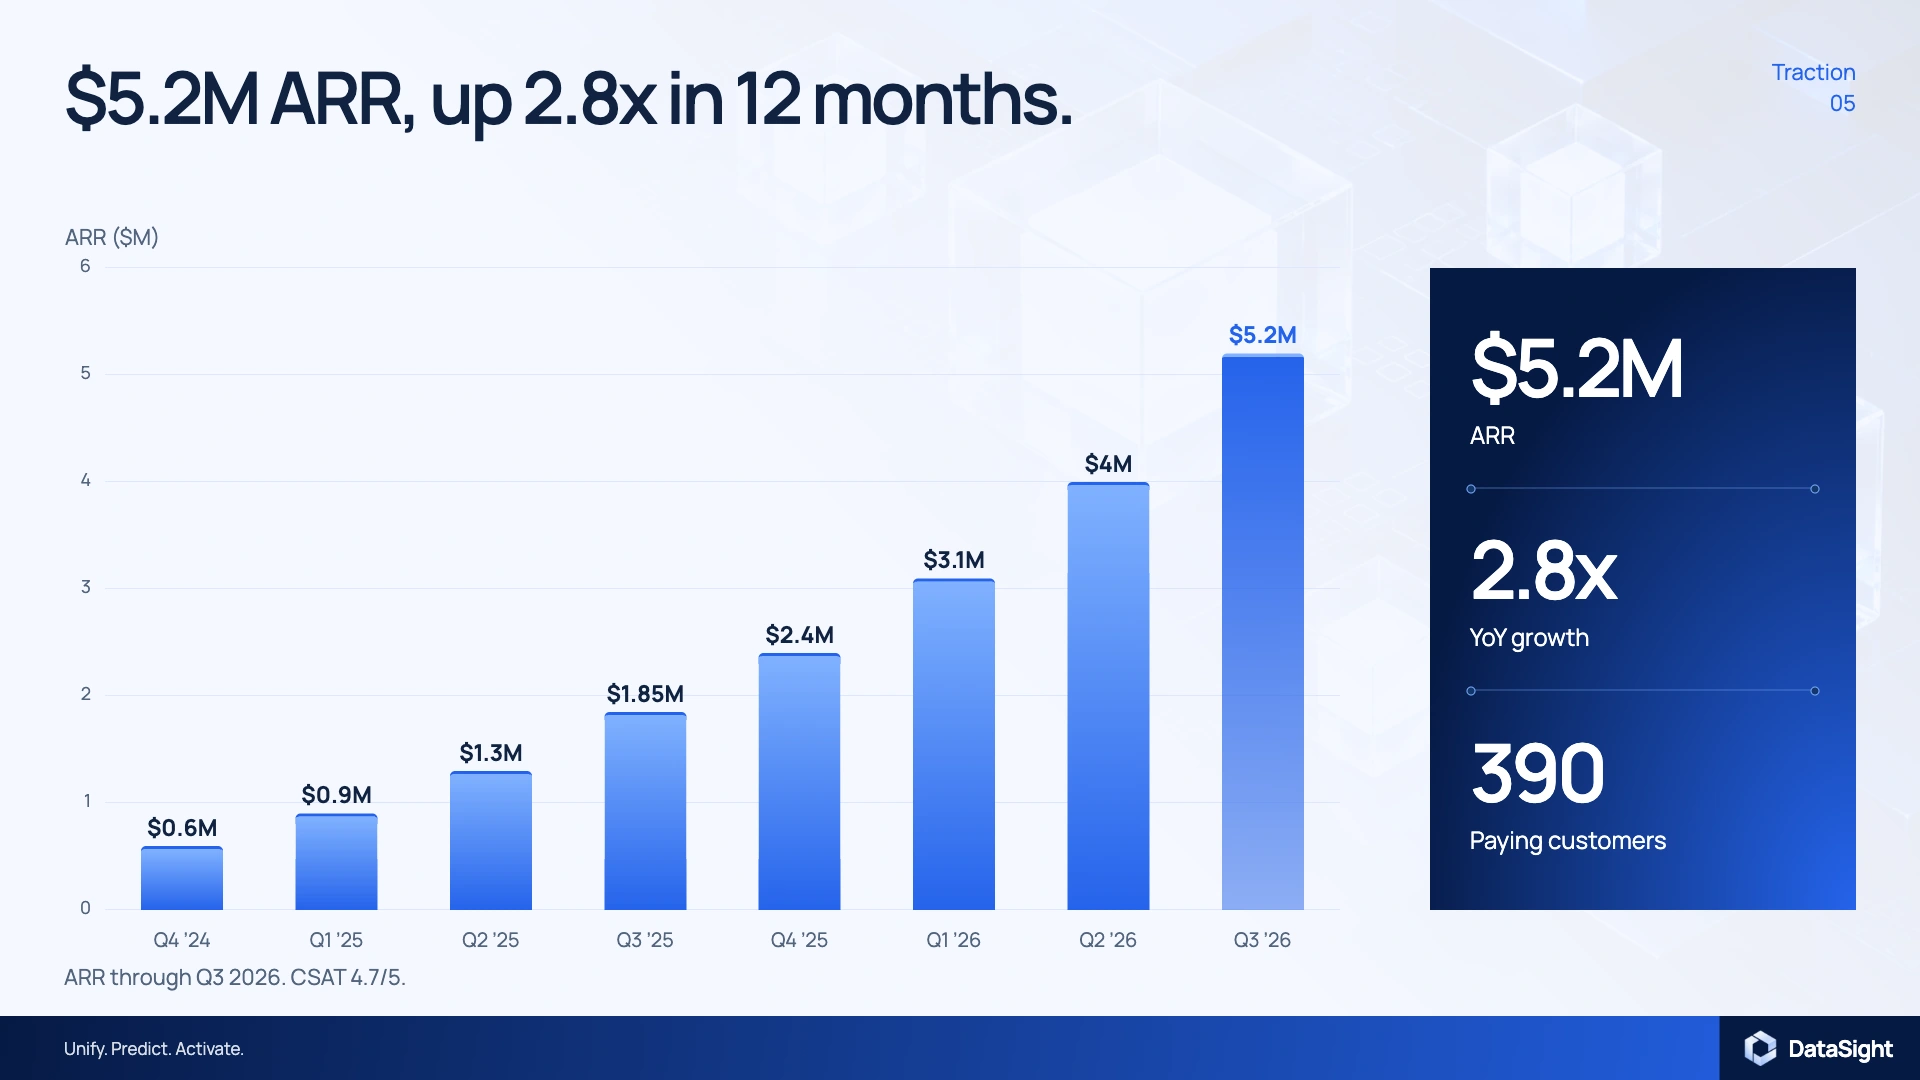
Concept traction slide with an illustrative quarterly ARR growth chart
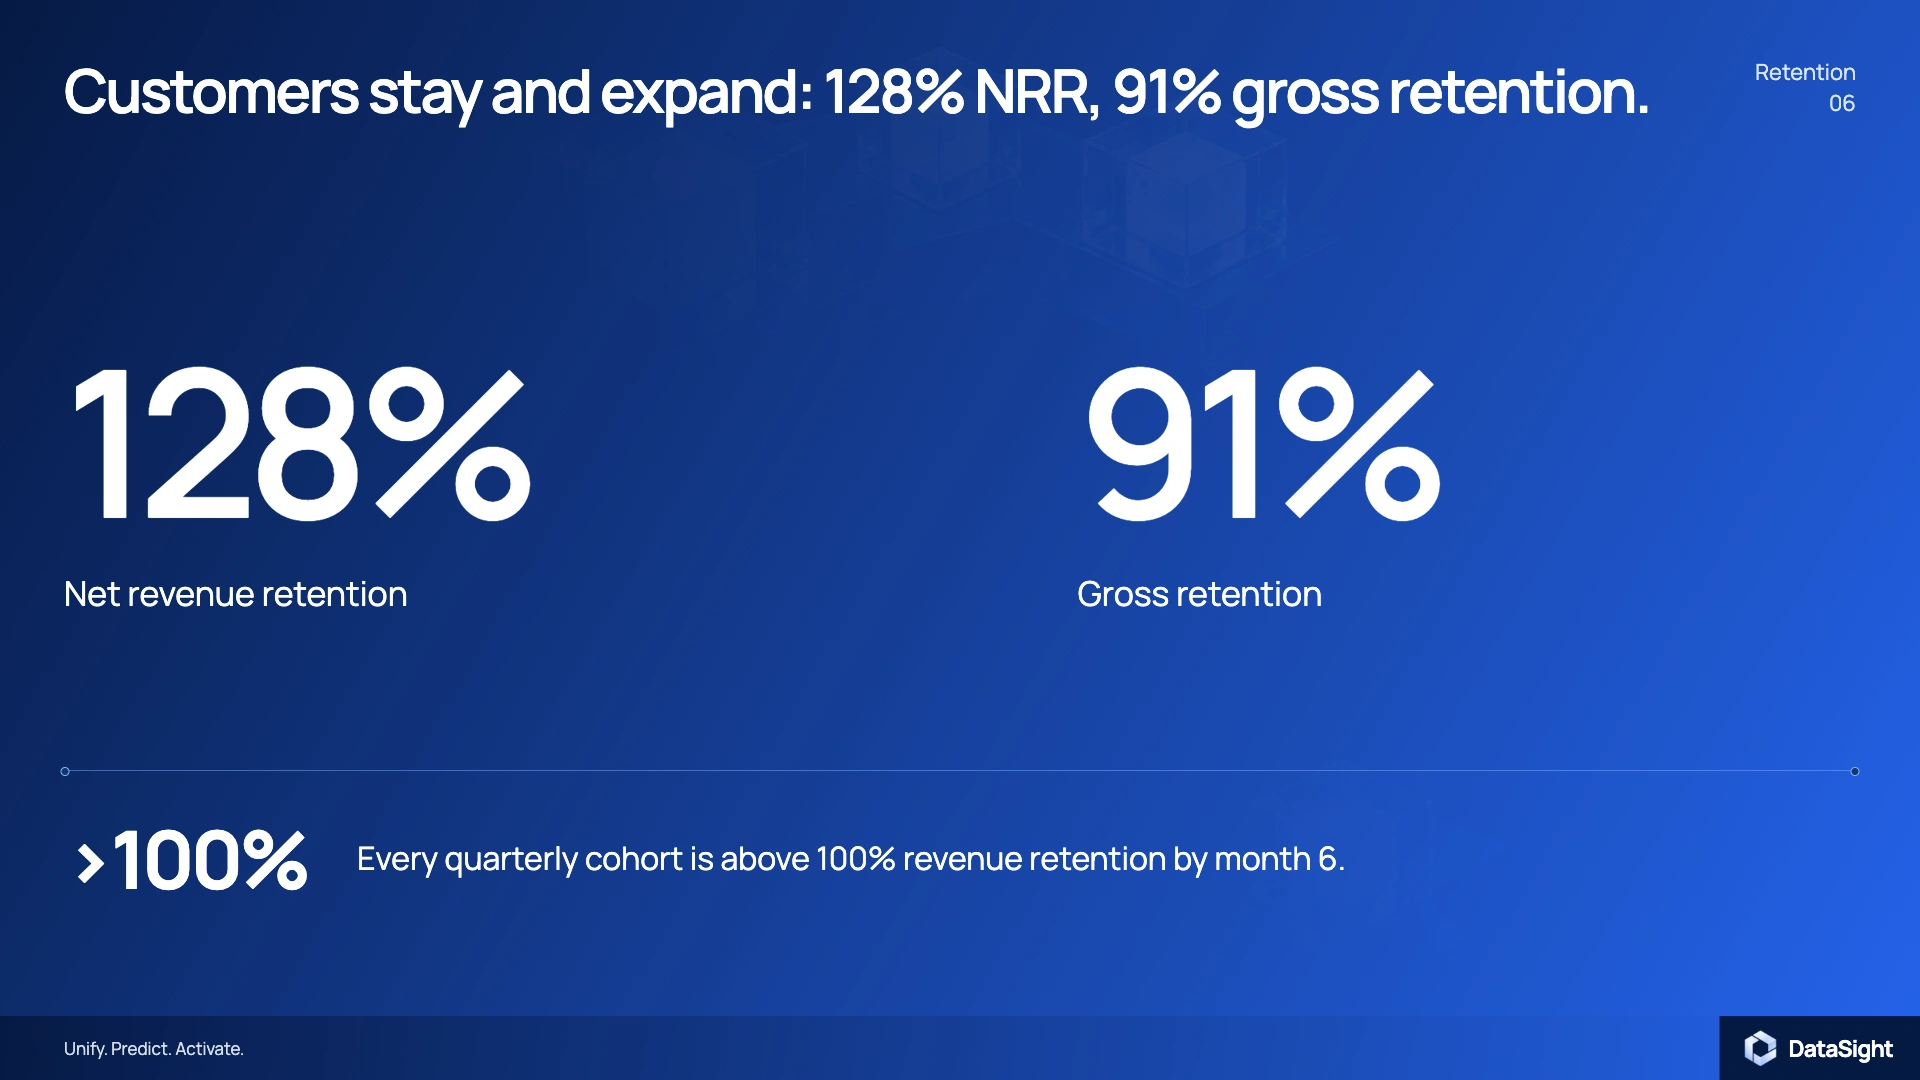
Retention slide highlighting illustrative net revenue retention and gross retention metrics
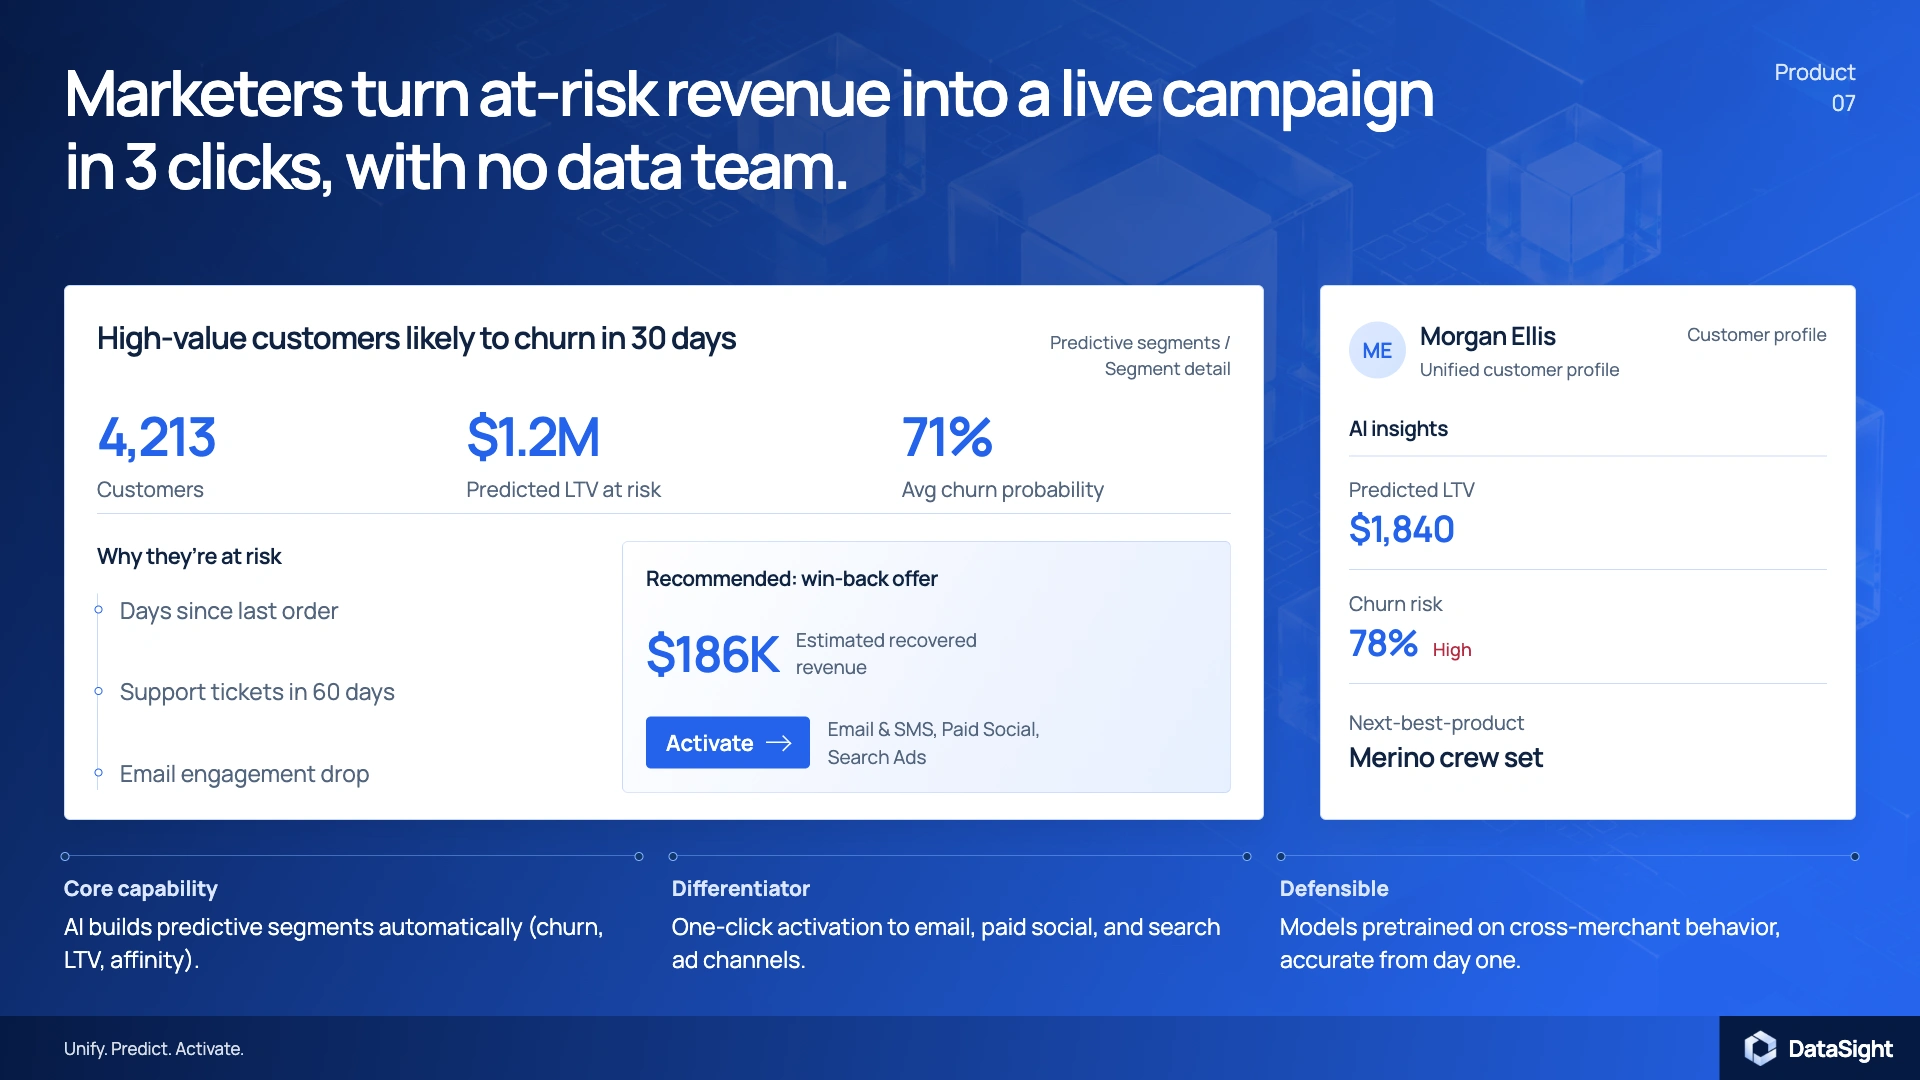
Customer intelligence product UI showing an at-risk segment, a recommended action, and a supporting customer profile
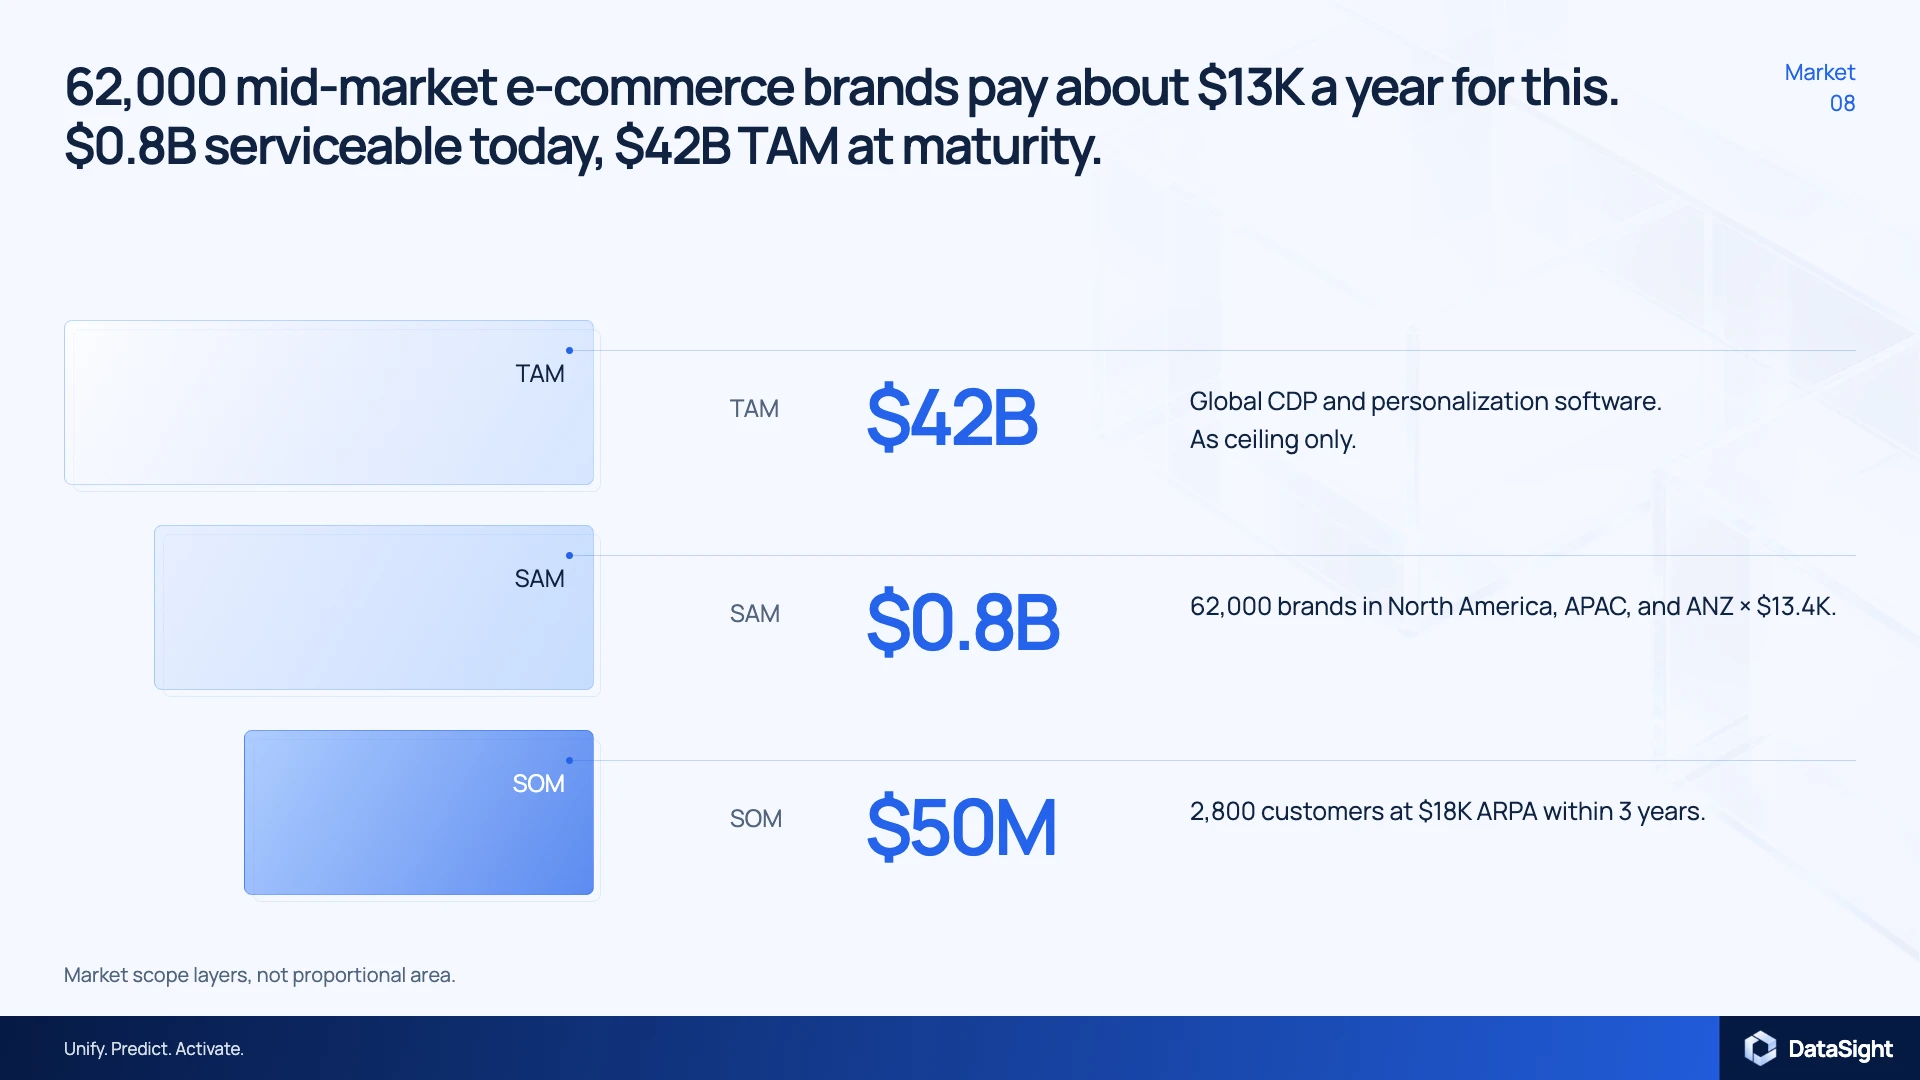
Market sizing slide using glass scope layers for illustrative TAM, SAM, and SOM
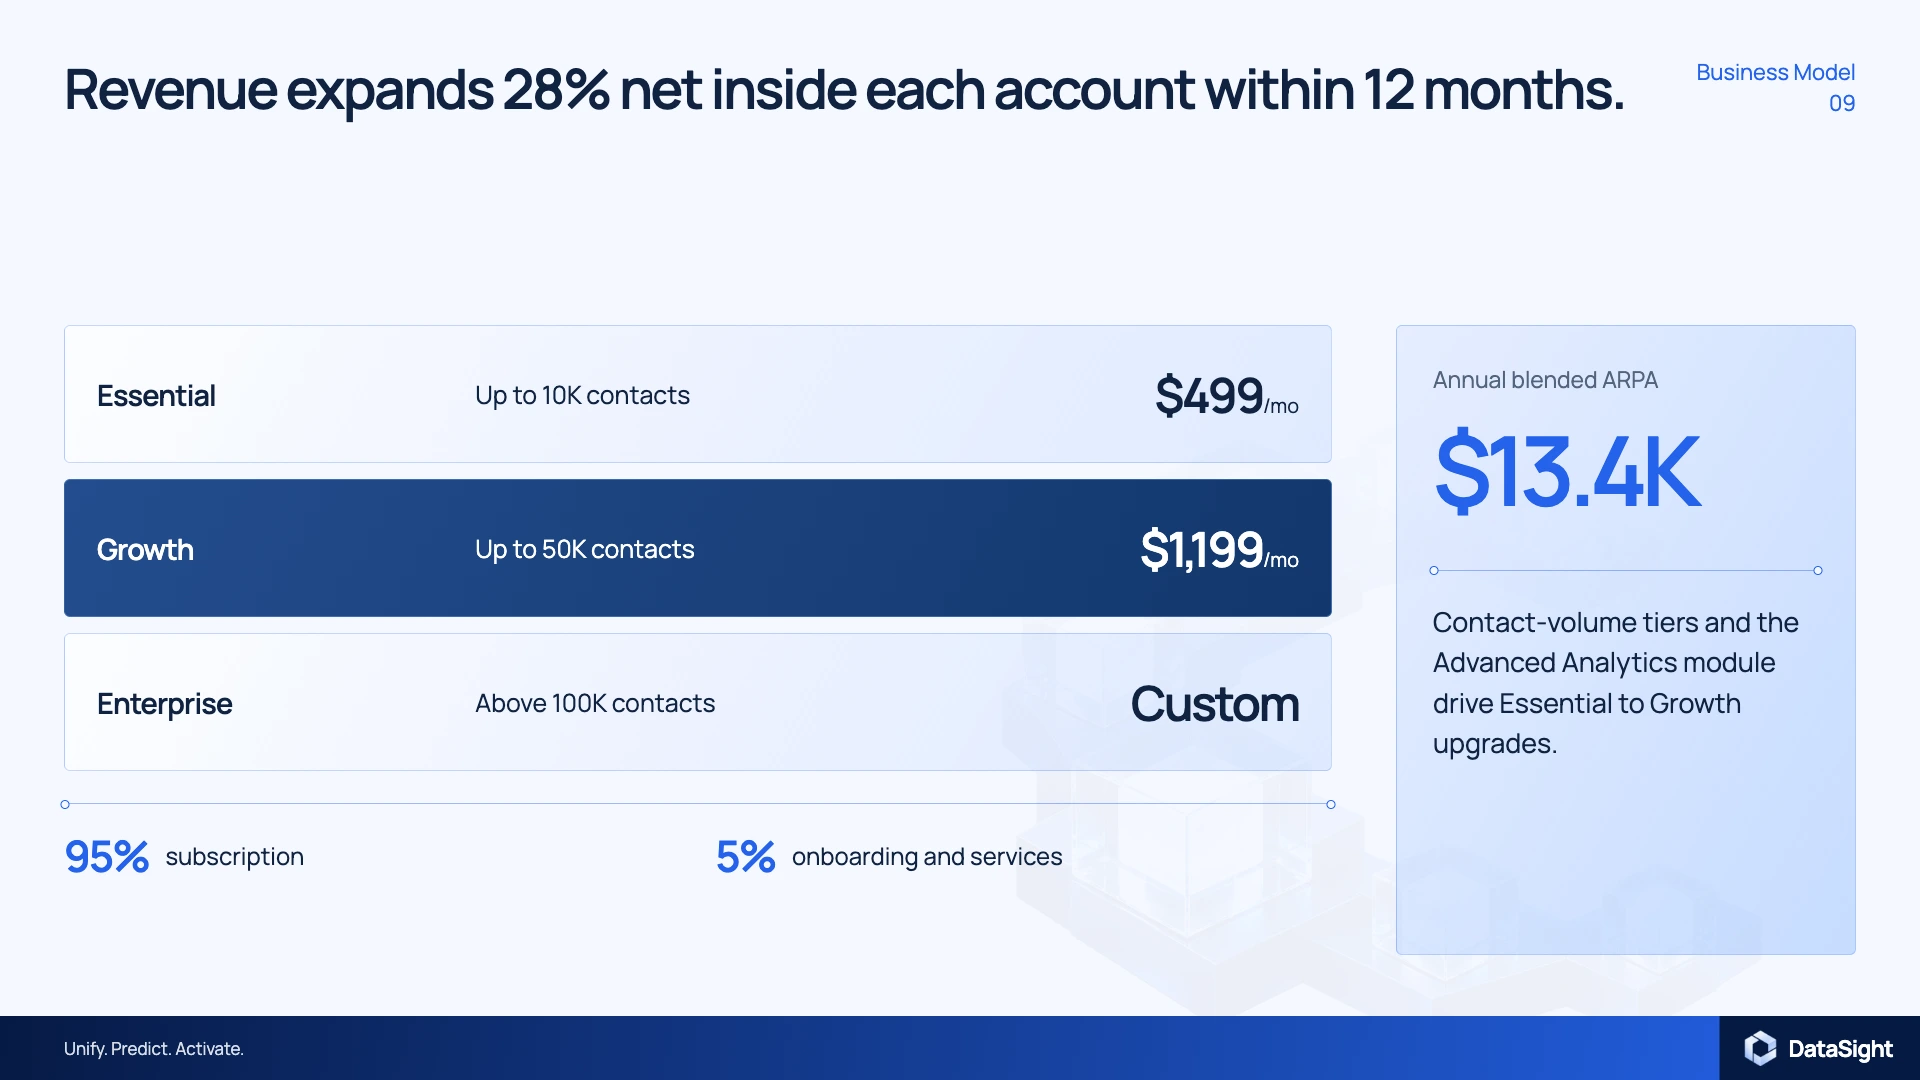
Business model slide pairing subscription tiers with illustrative annualized account revenue
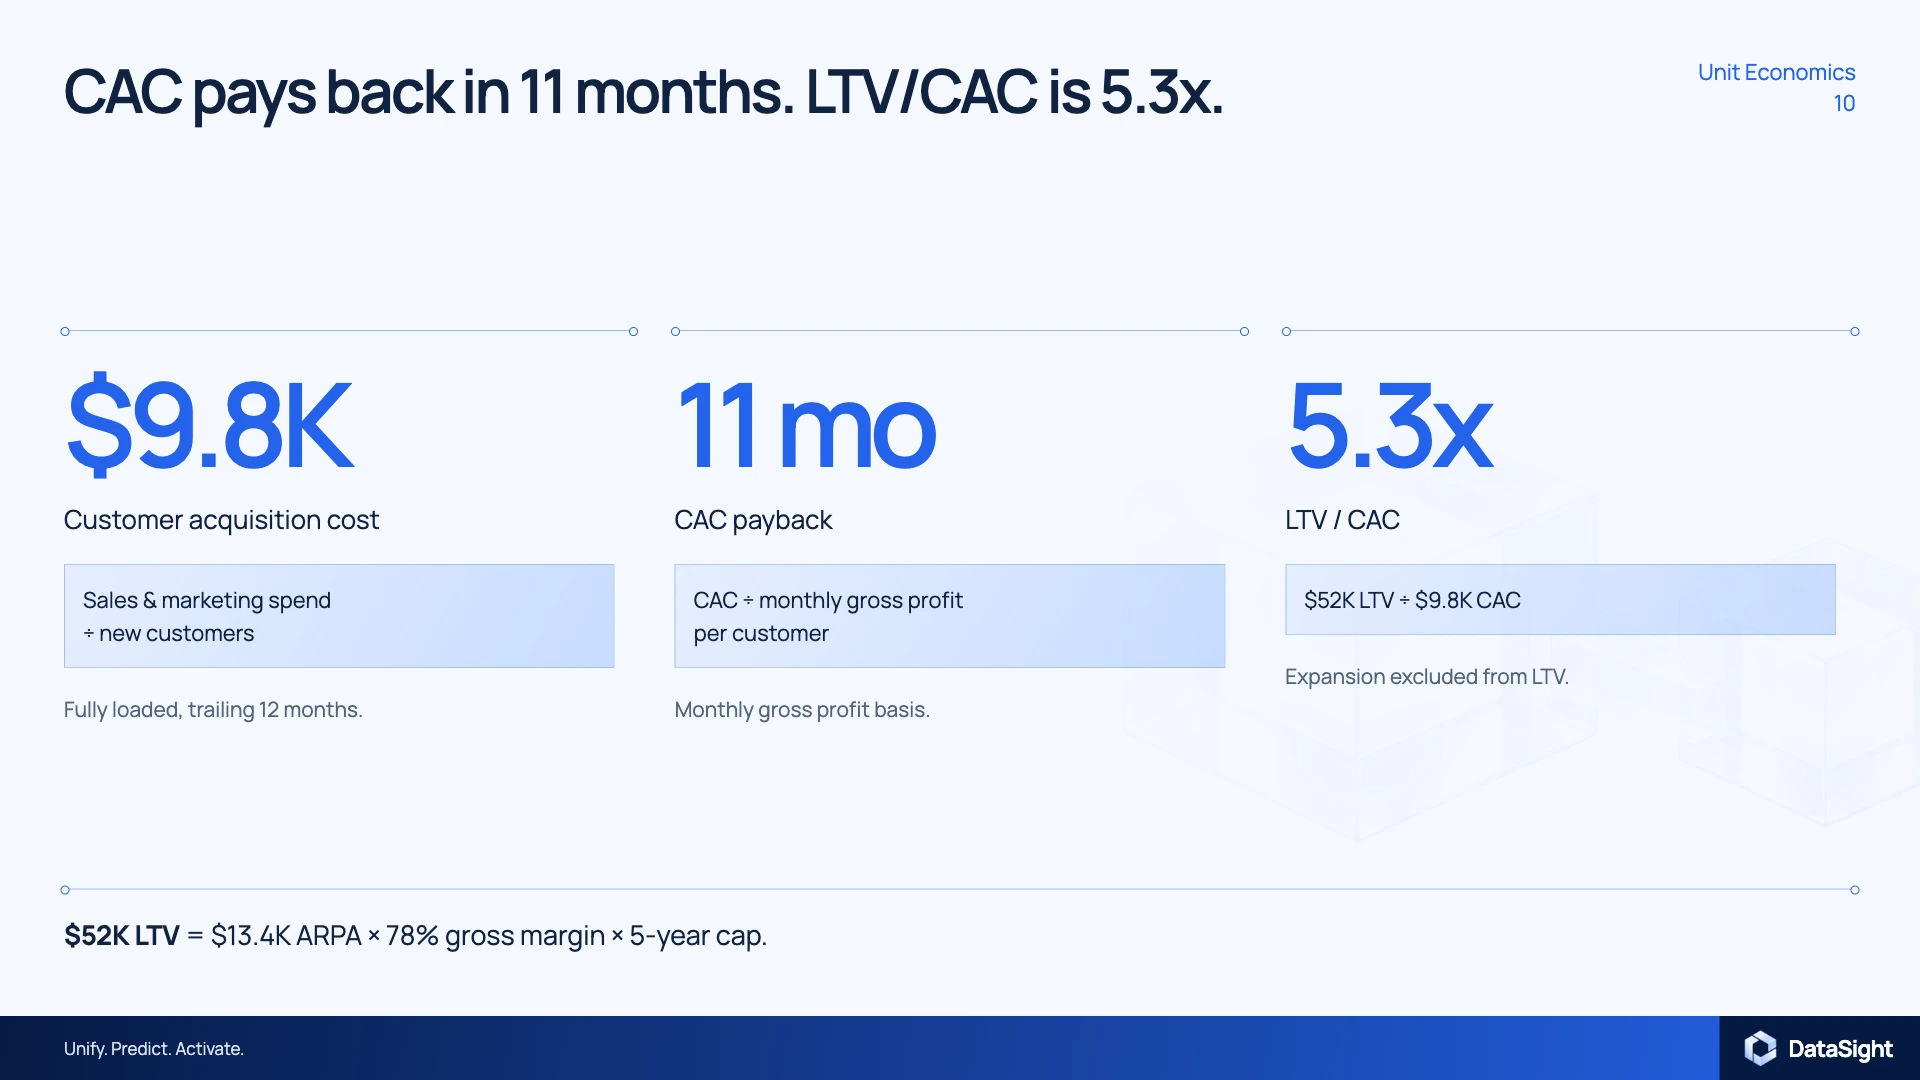
Unit economics slide with illustrative customer acquisition cost, payback, and LTV-to-CAC figures
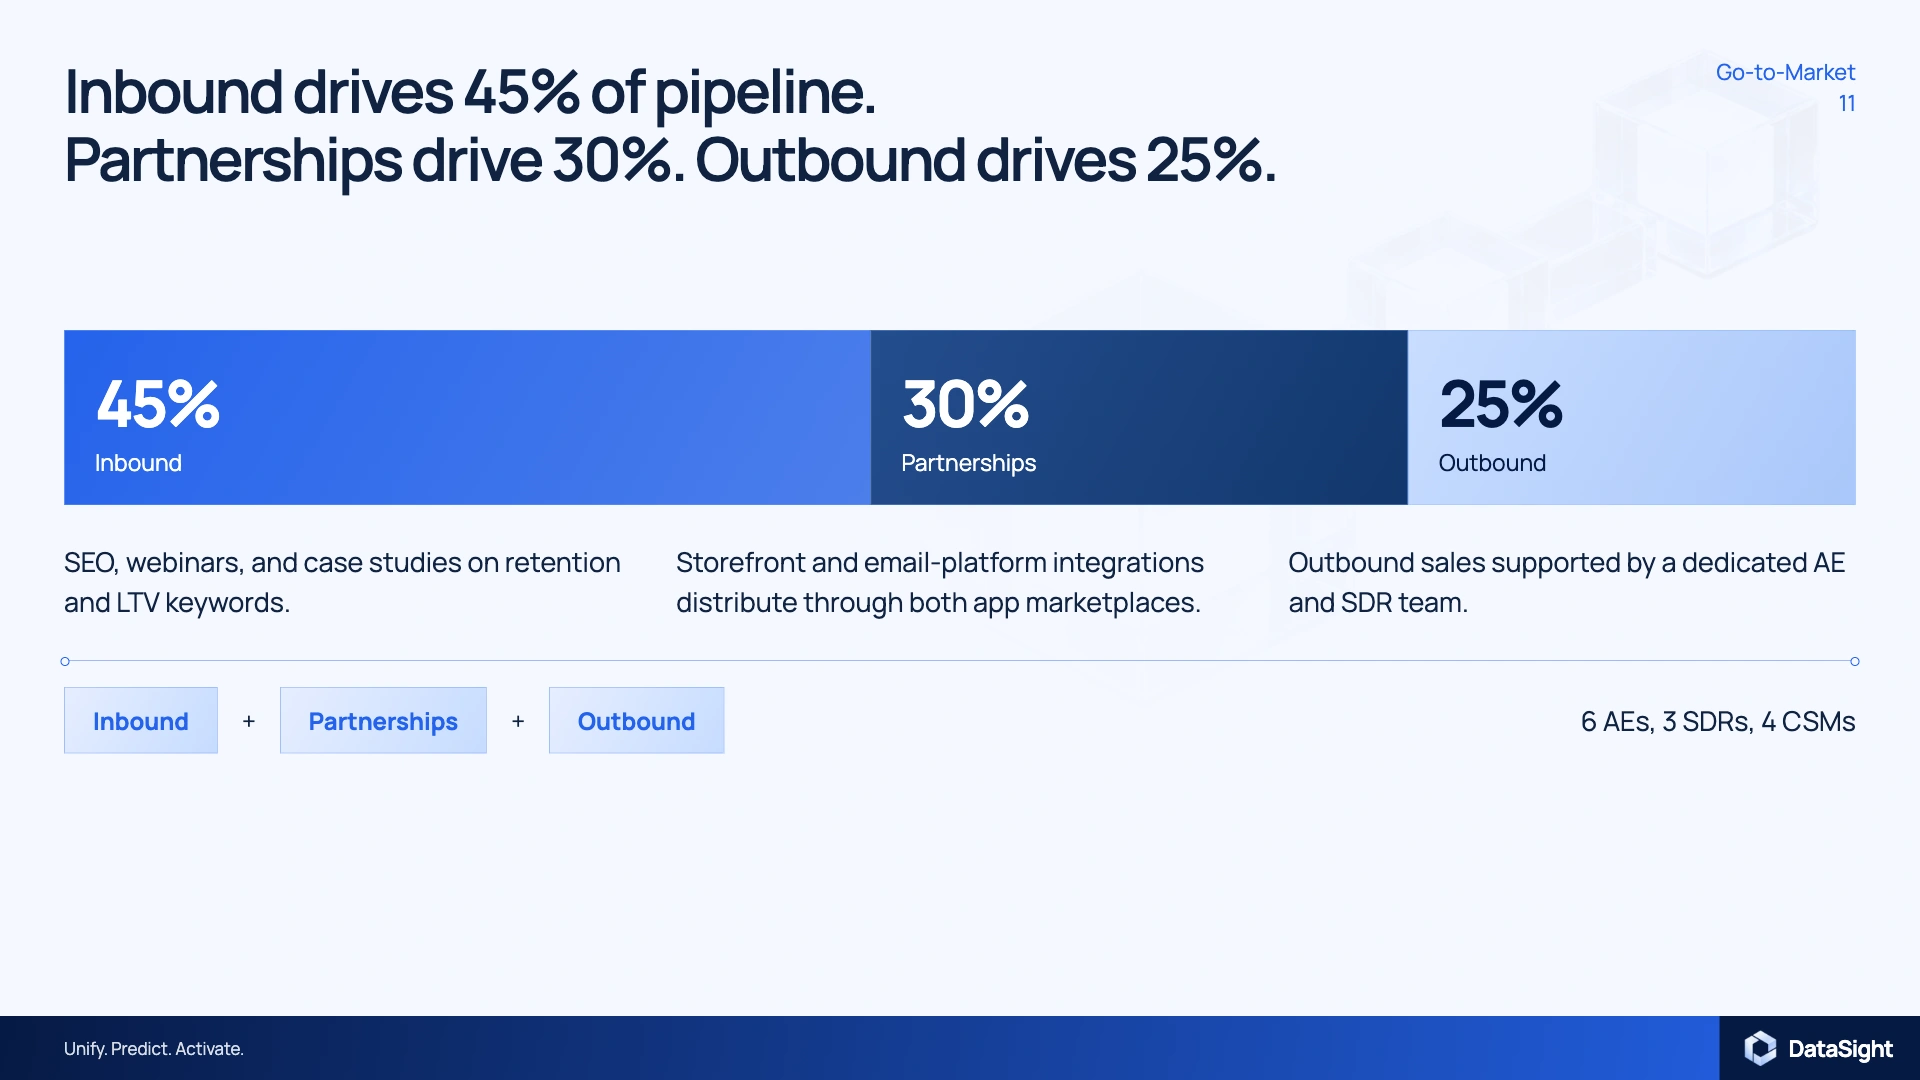
Go-to-market slide using a proportional pipeline mix across inbound, partnerships, and outbound
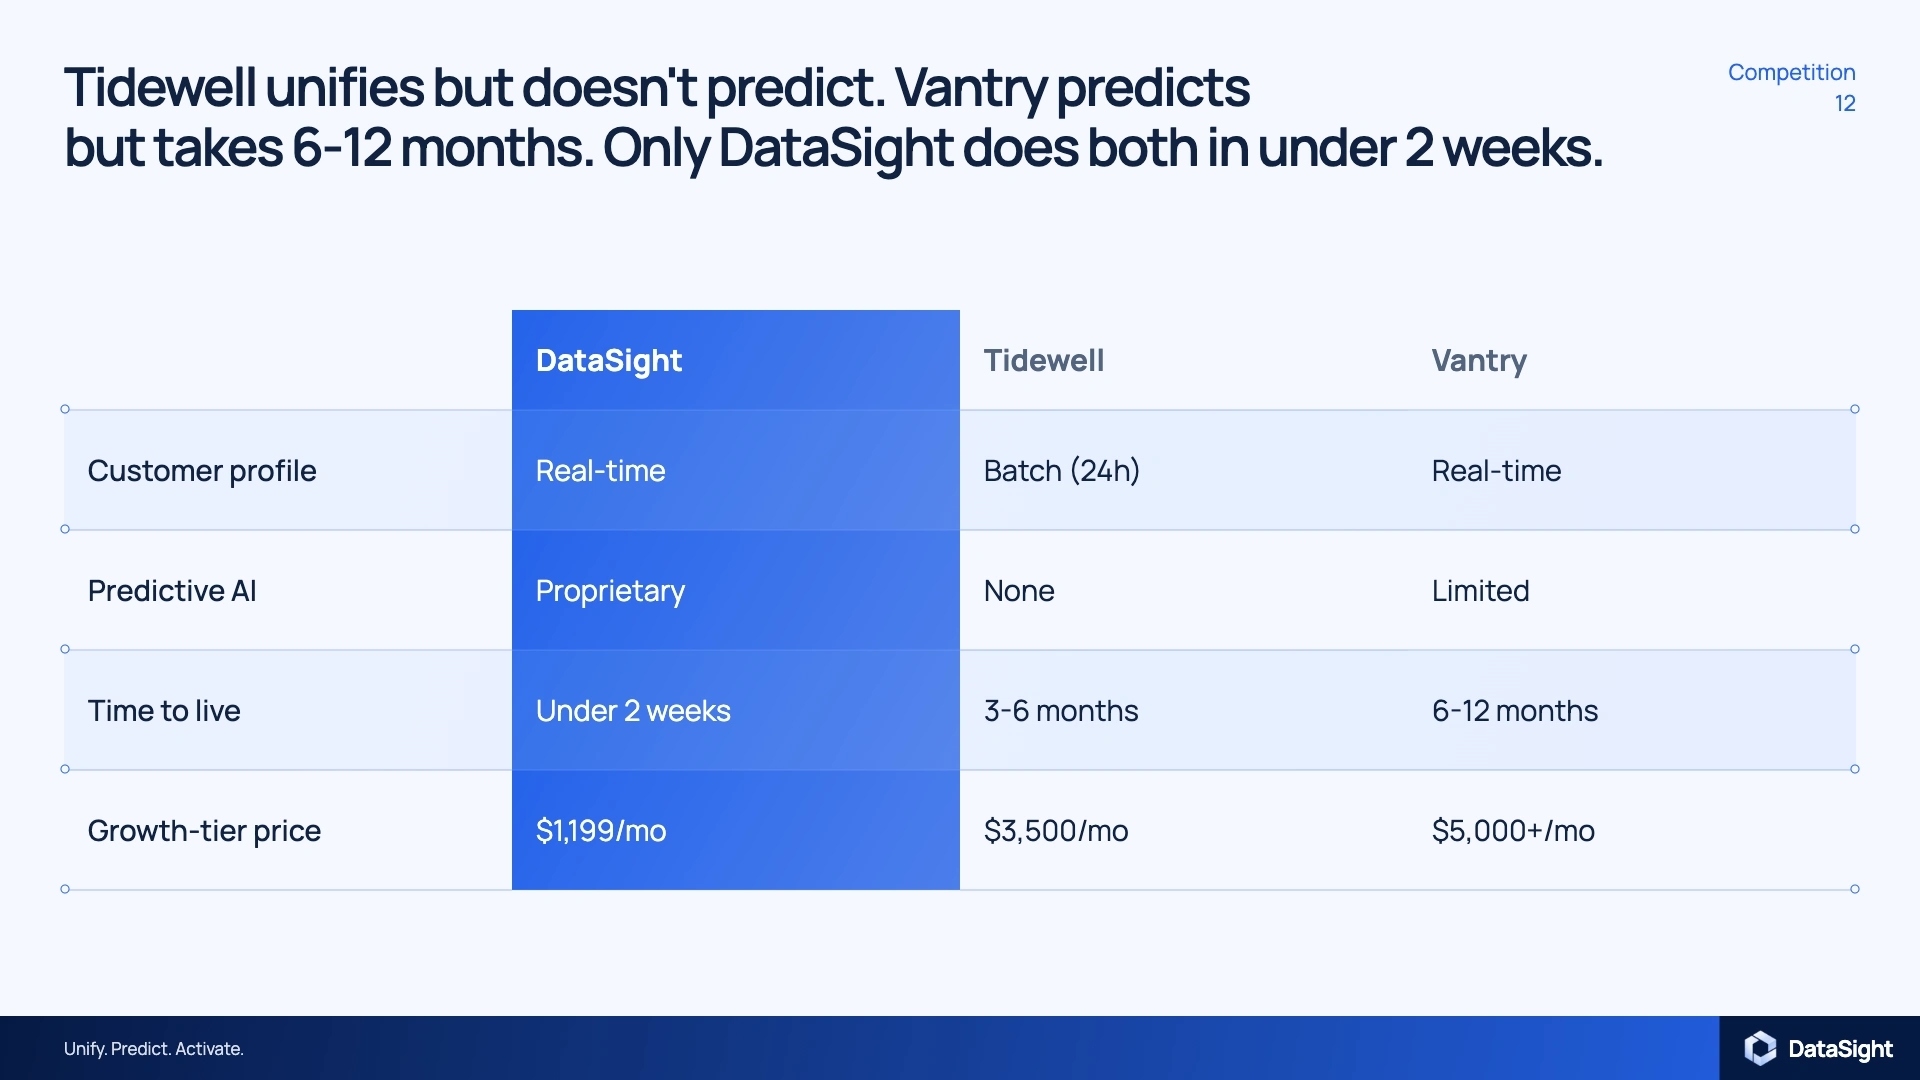
Competitive comparison slide with a highlighted DataSight column and structured feature rows
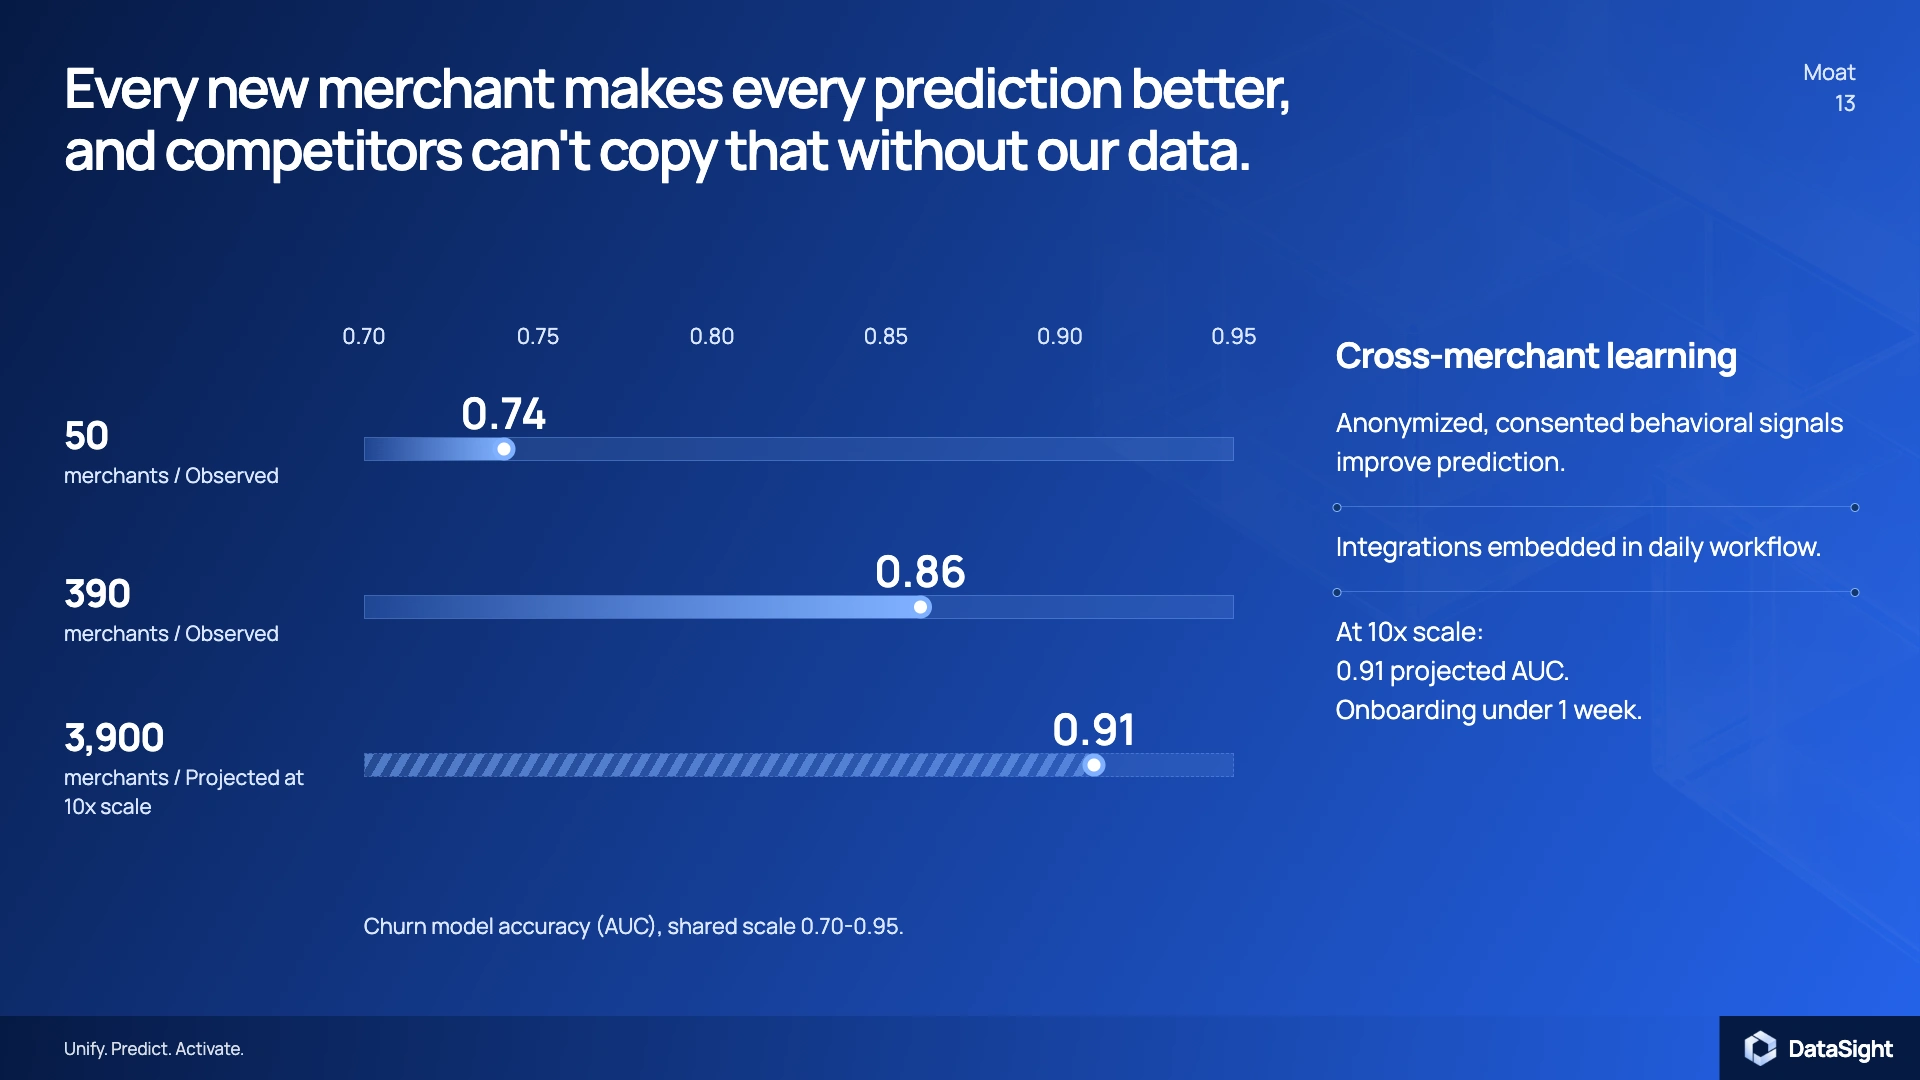
Concept moat slide connecting merchant data, model learning, and prediction accuracy
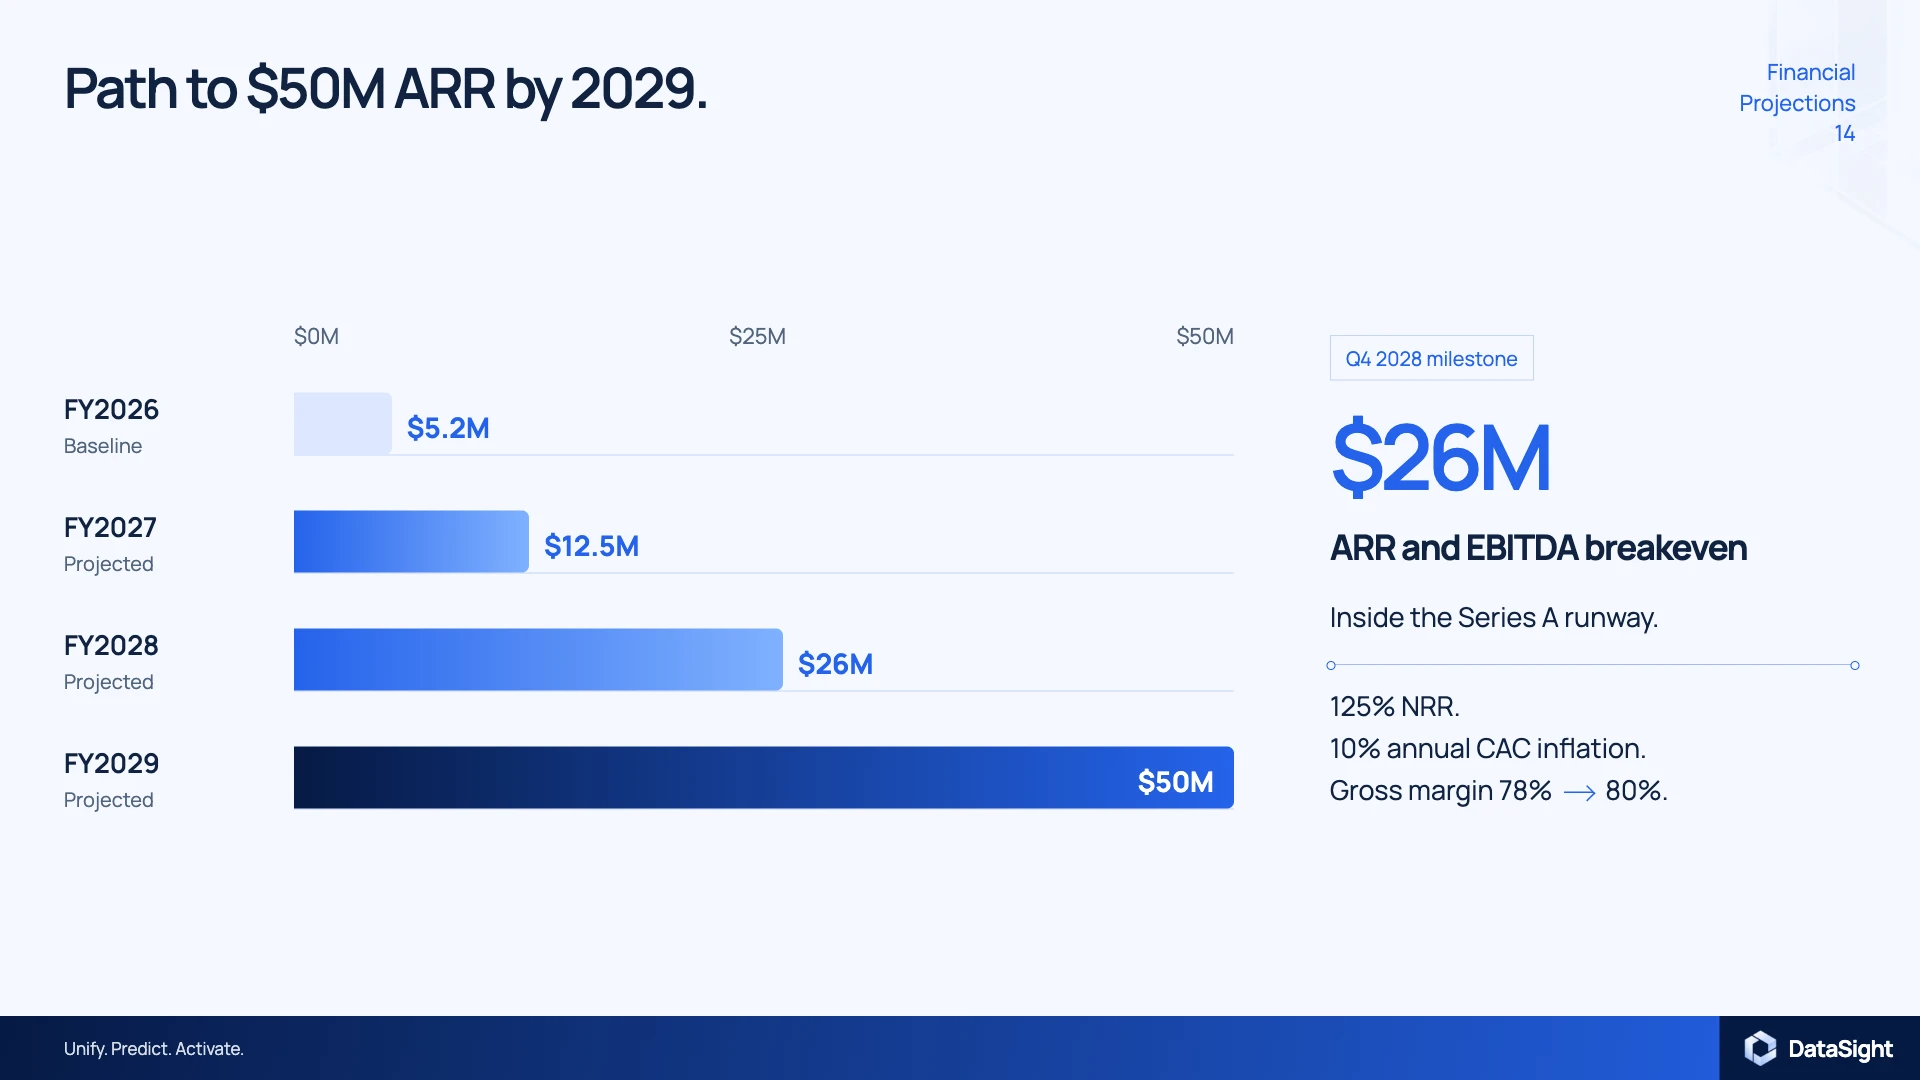
Financial projections slide using an illustrative revenue target ladder and a highlighted milestone
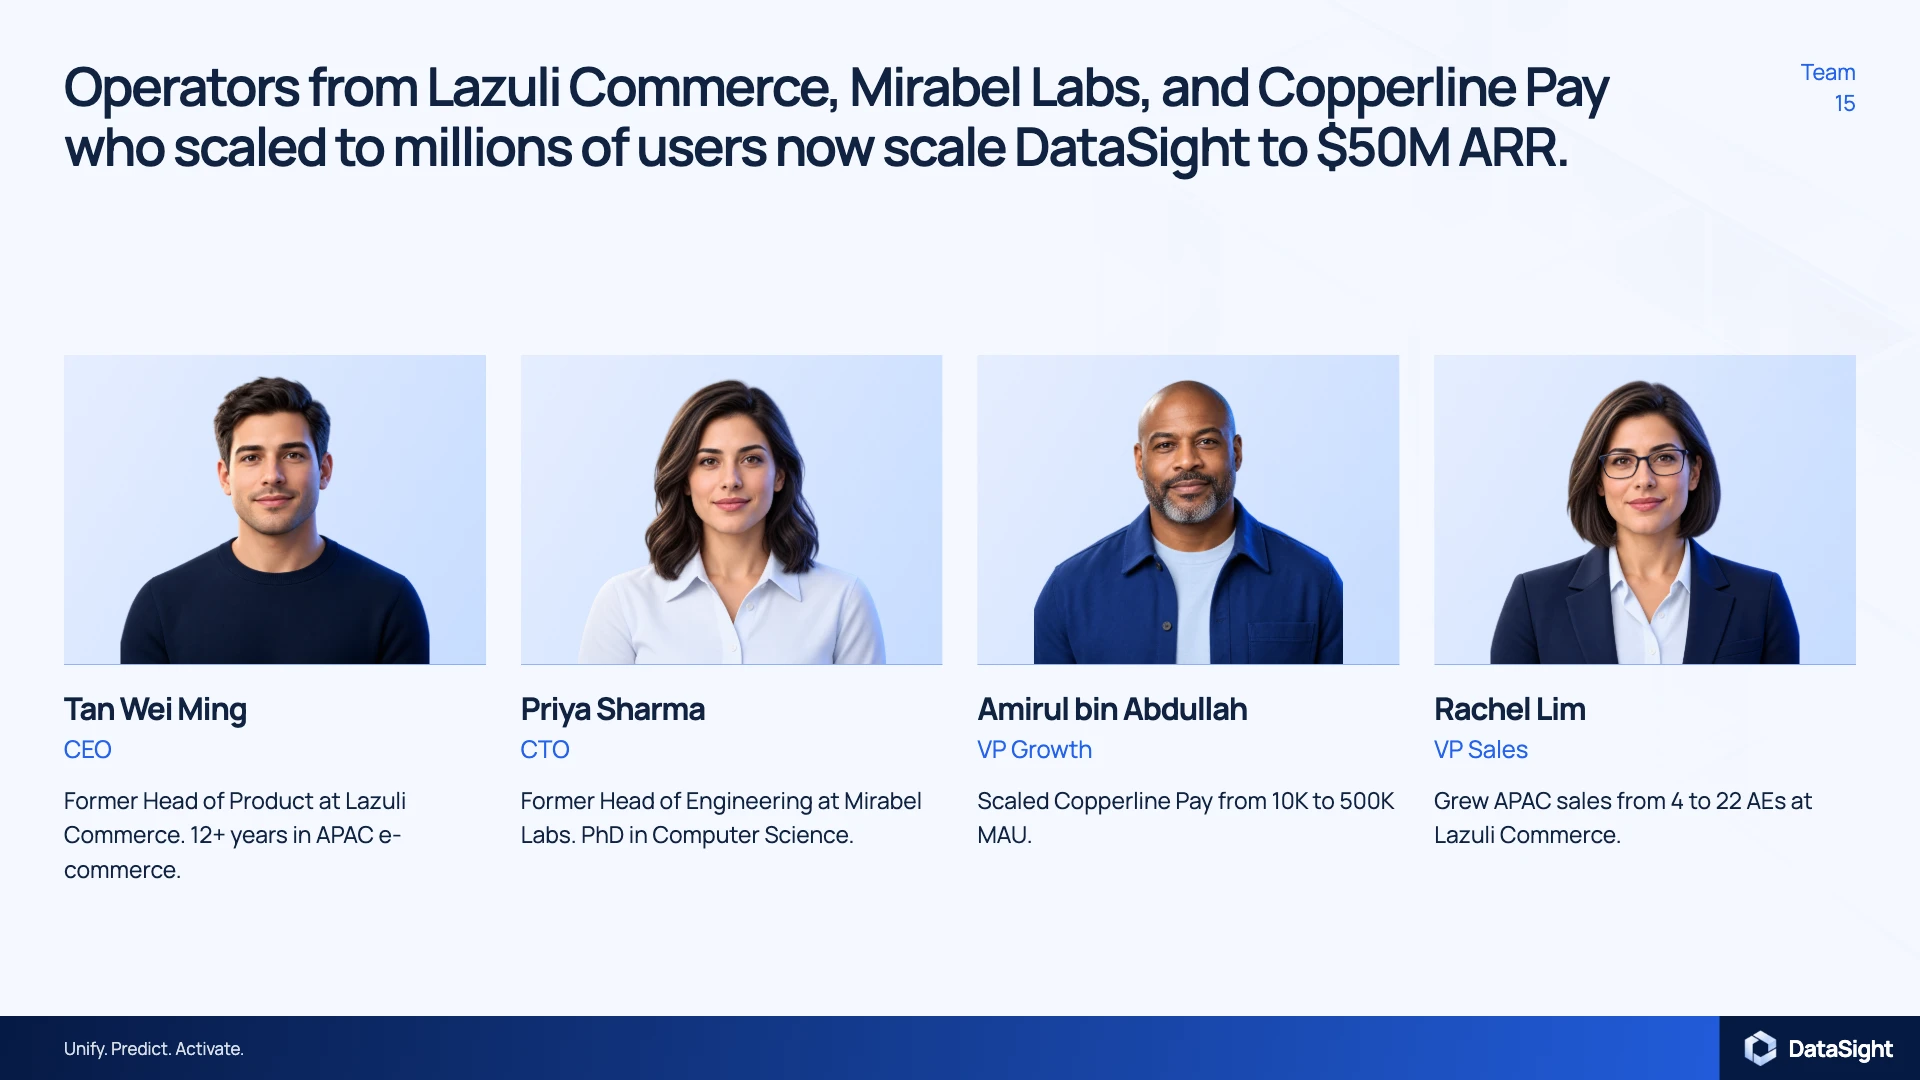
Concept team slide with four fictional operator profiles
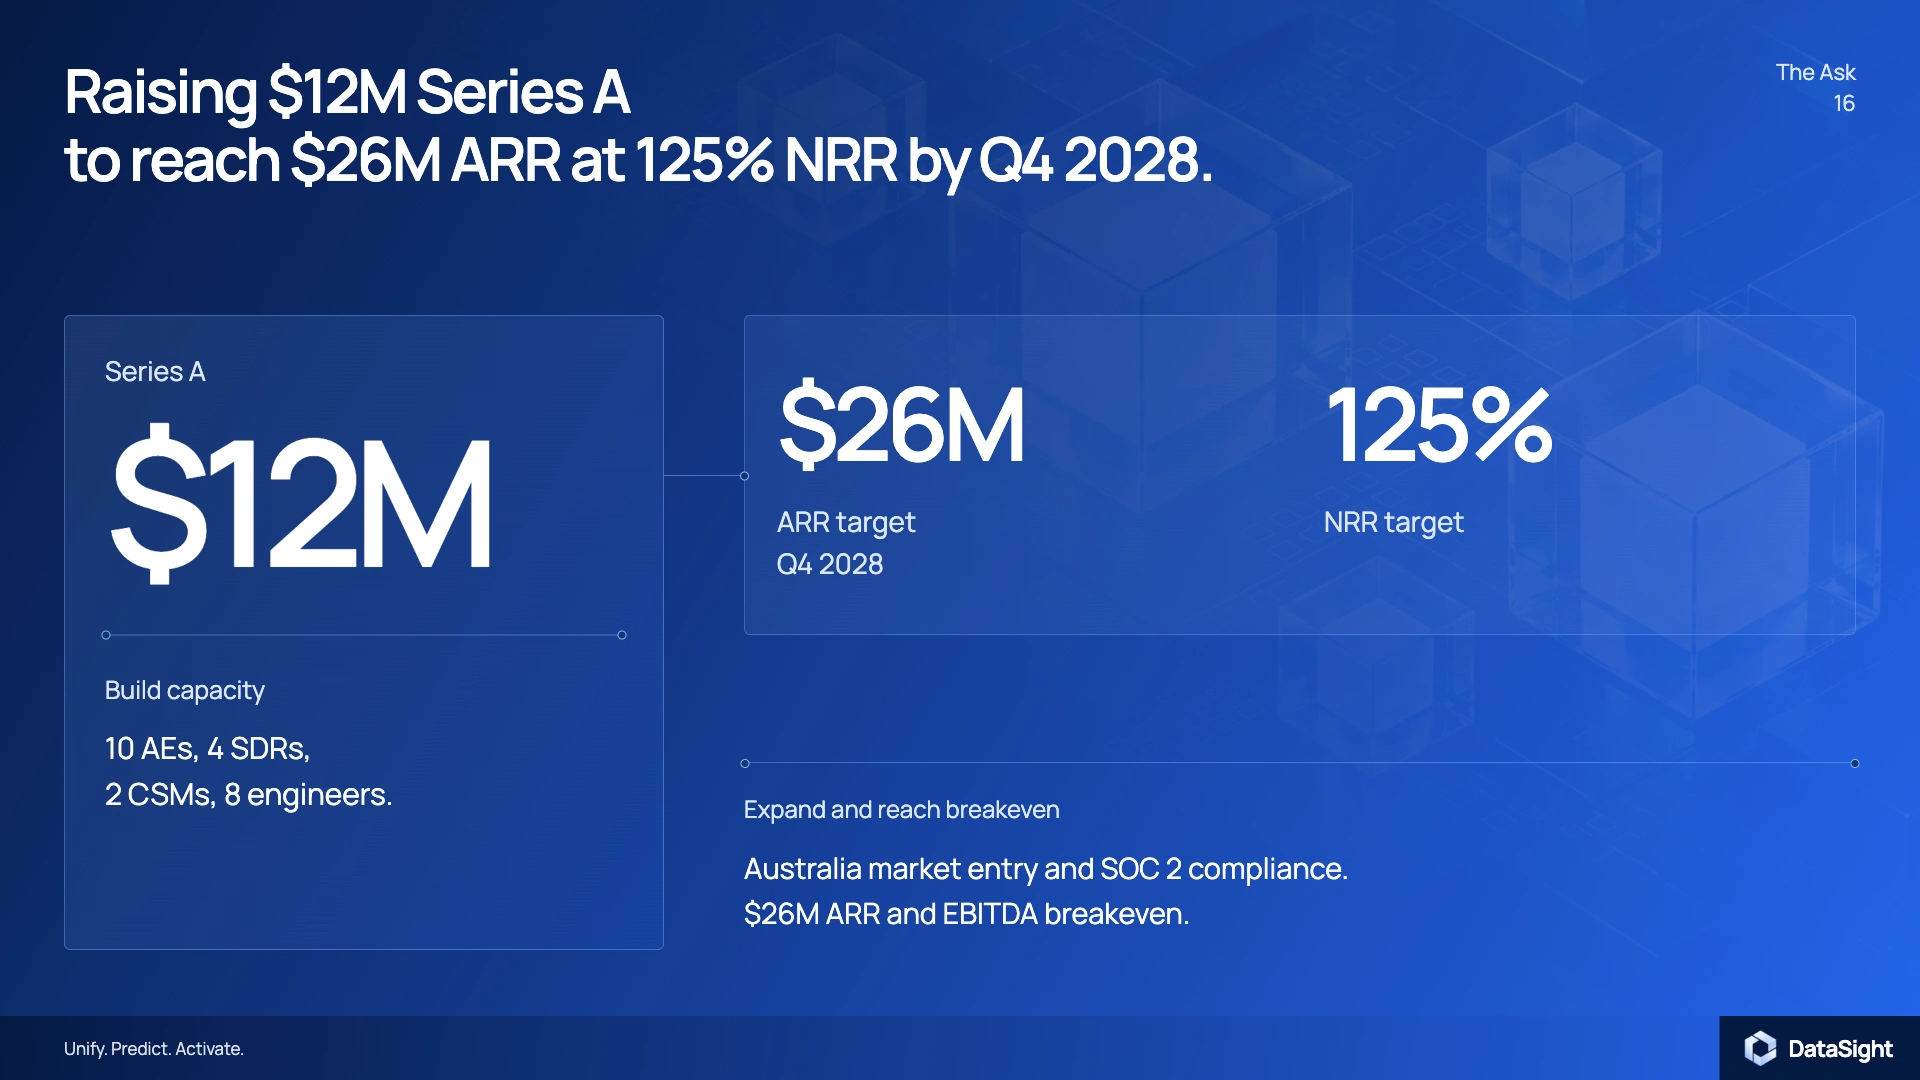
Series A funding ask slide connecting illustrative capital, ARR, and retention targets
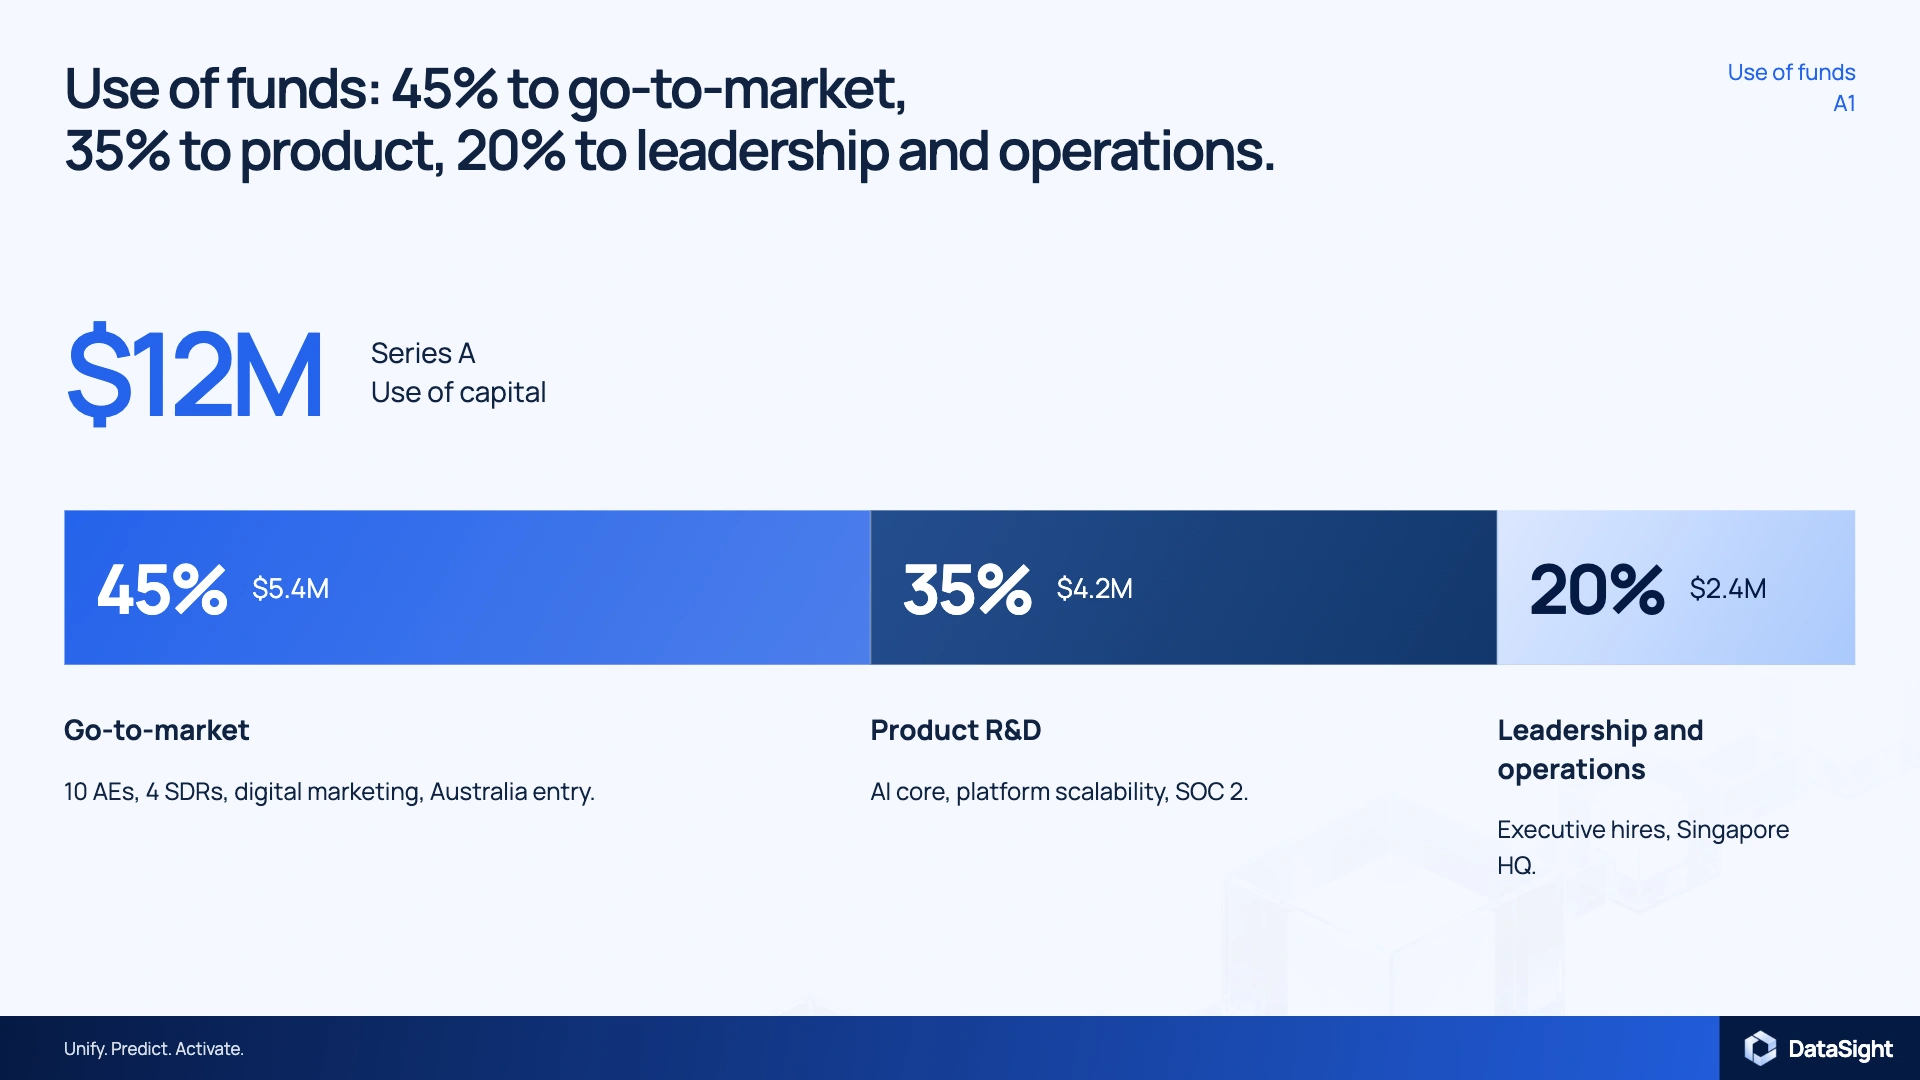
Appendix use-of-funds slide with an illustrative allocation across growth, product, and operations
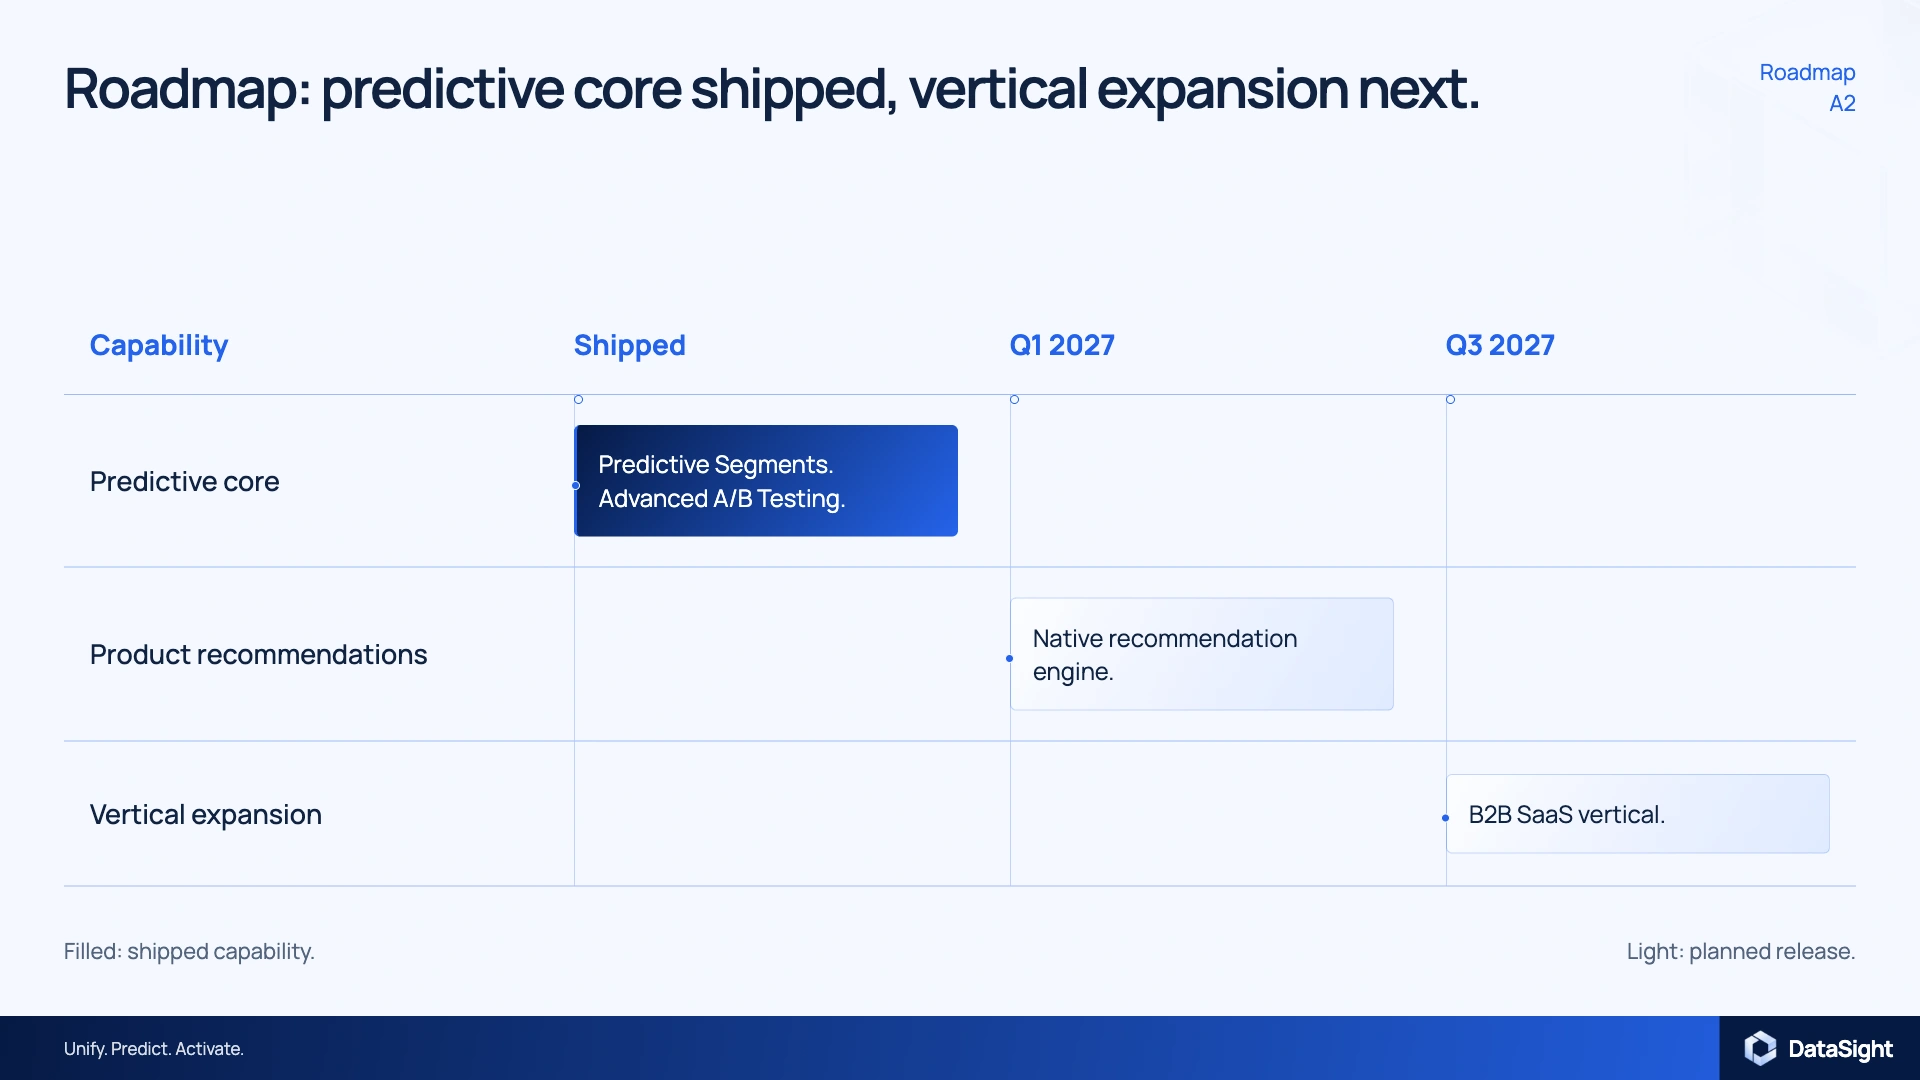
Appendix product roadmap with capability release lanes
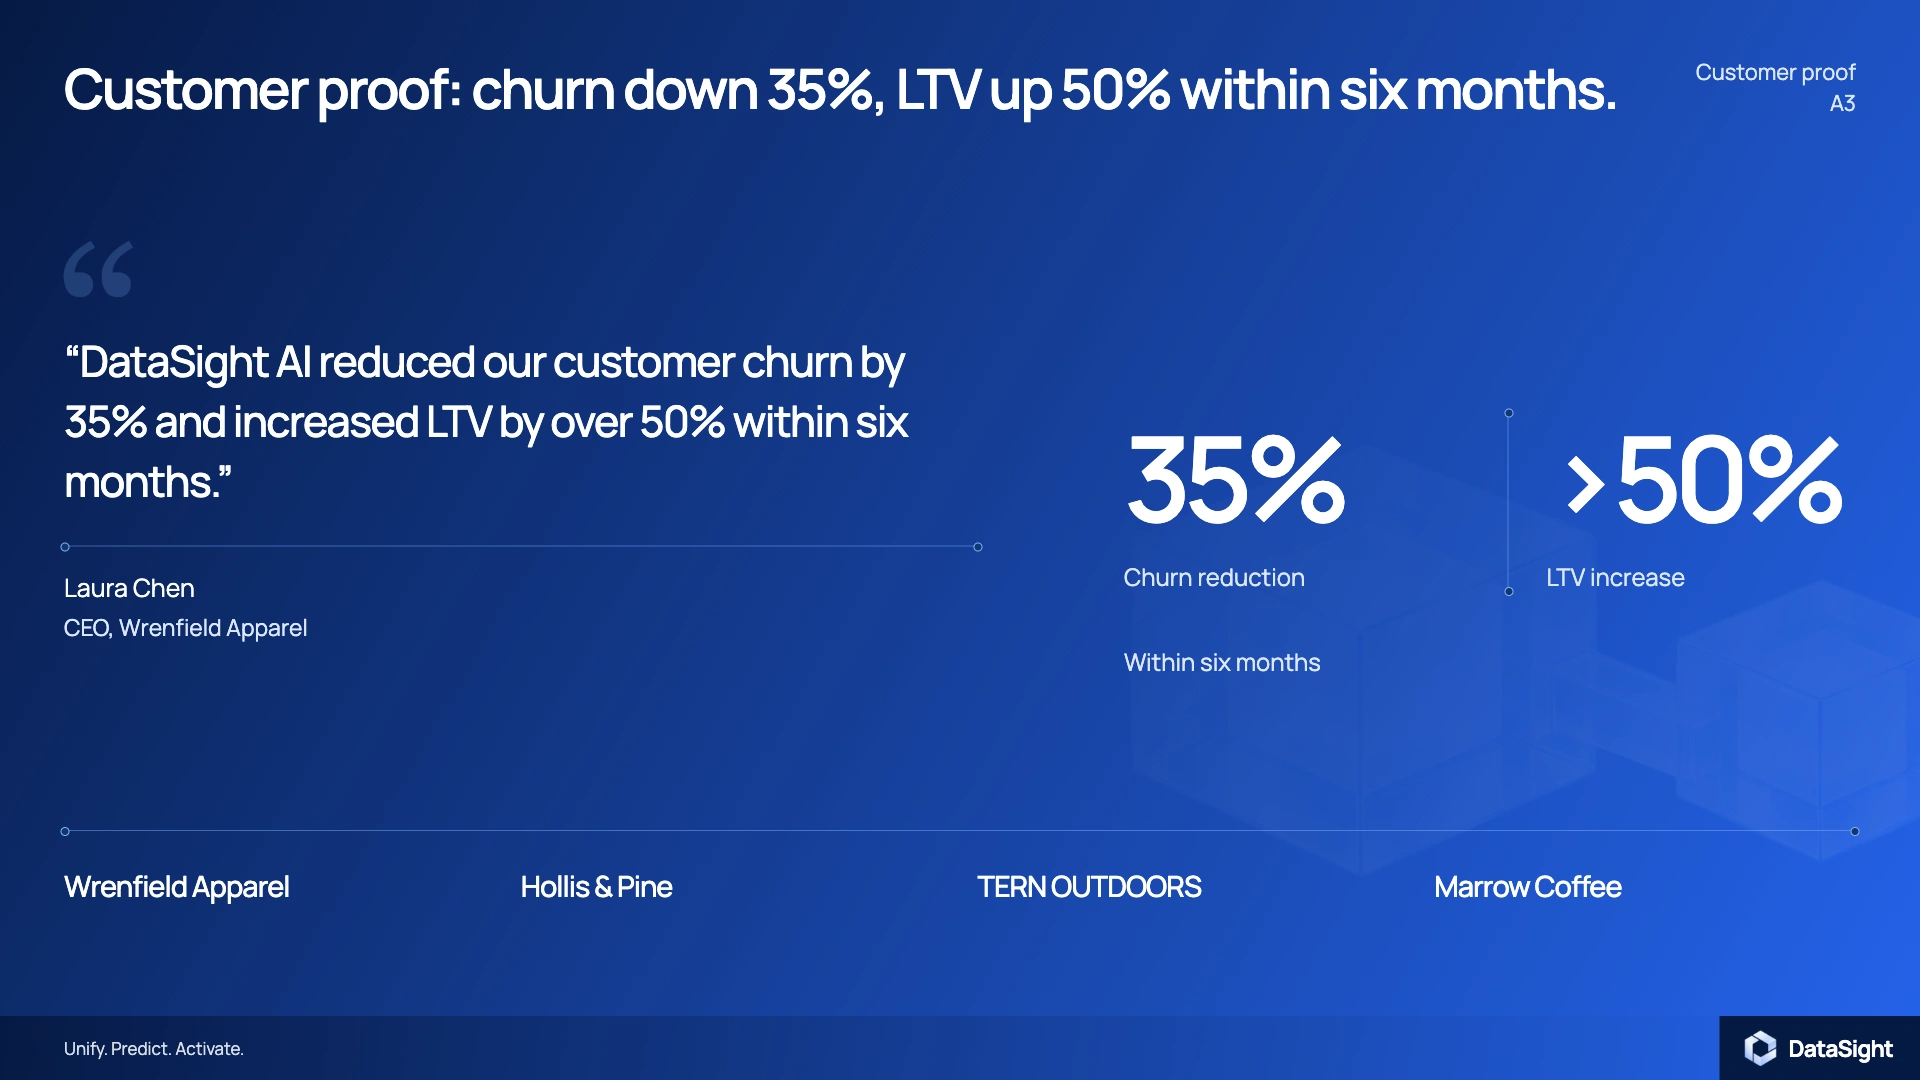
Fictional customer-proof example showing a sample testimonial and illustrative retention outcomes
Deliverables
A 19-slide investor presentation with 16 main slides and three appendix slides covering use of funds, the roadmap, and a fictional customer example. The finished system carries the product explanation through to the funding plan.
Like this project
Posted Oct 28, 2026
B2B SaaS pitch deck design for a fictional customer intelligence platform, combining Series A storytelling, data visualization, and focused product UI.