Designing a Solar Decision Platform for Property Portfolios

Daria Si


Solo designer, end to end · 2-week design sprint · Designed 2022, visual language rebuilt 2026 · Commercial real estate, under NDA
Overview
An AI-powered platform that helps commercial property owners decide where solar makes financial sense, install it themselves or connect to a provider through a VPPA to offset CO2 across their portfolio.
Problem
Commercial real estate groups managing large property portfolios had no scalable way to evaluate solar potential across locations. Every site was assessed individually, through spreadsheets and vendor calls. Existing tools on the market were built for single-project workflows, none could analyze a portfolio of 40+ buildings in one session.
Process
I started with a brief, brand guidelines, and a few rough prototypes the client had sketched out, none of it precise enough to design from. I had to discover how this domain works. This was my first solar project and I was excited.
My first instinct was to make it interactive: a map with radius filtering, coverage zones, distance-based matching. The client pushed back: VPPA doesn't work by proximity, the building doesn't get wired to a nearby provider. It's a financial contract: the provider sells its power into the wholesale grid wherever it's generated, and the two sides settle the price difference plus renewable energy credits. Distance is irrelevant. So the list became the primary view, and the map became a secondary lens for context, not a matching tool.
Upload once, see the whole portfolio
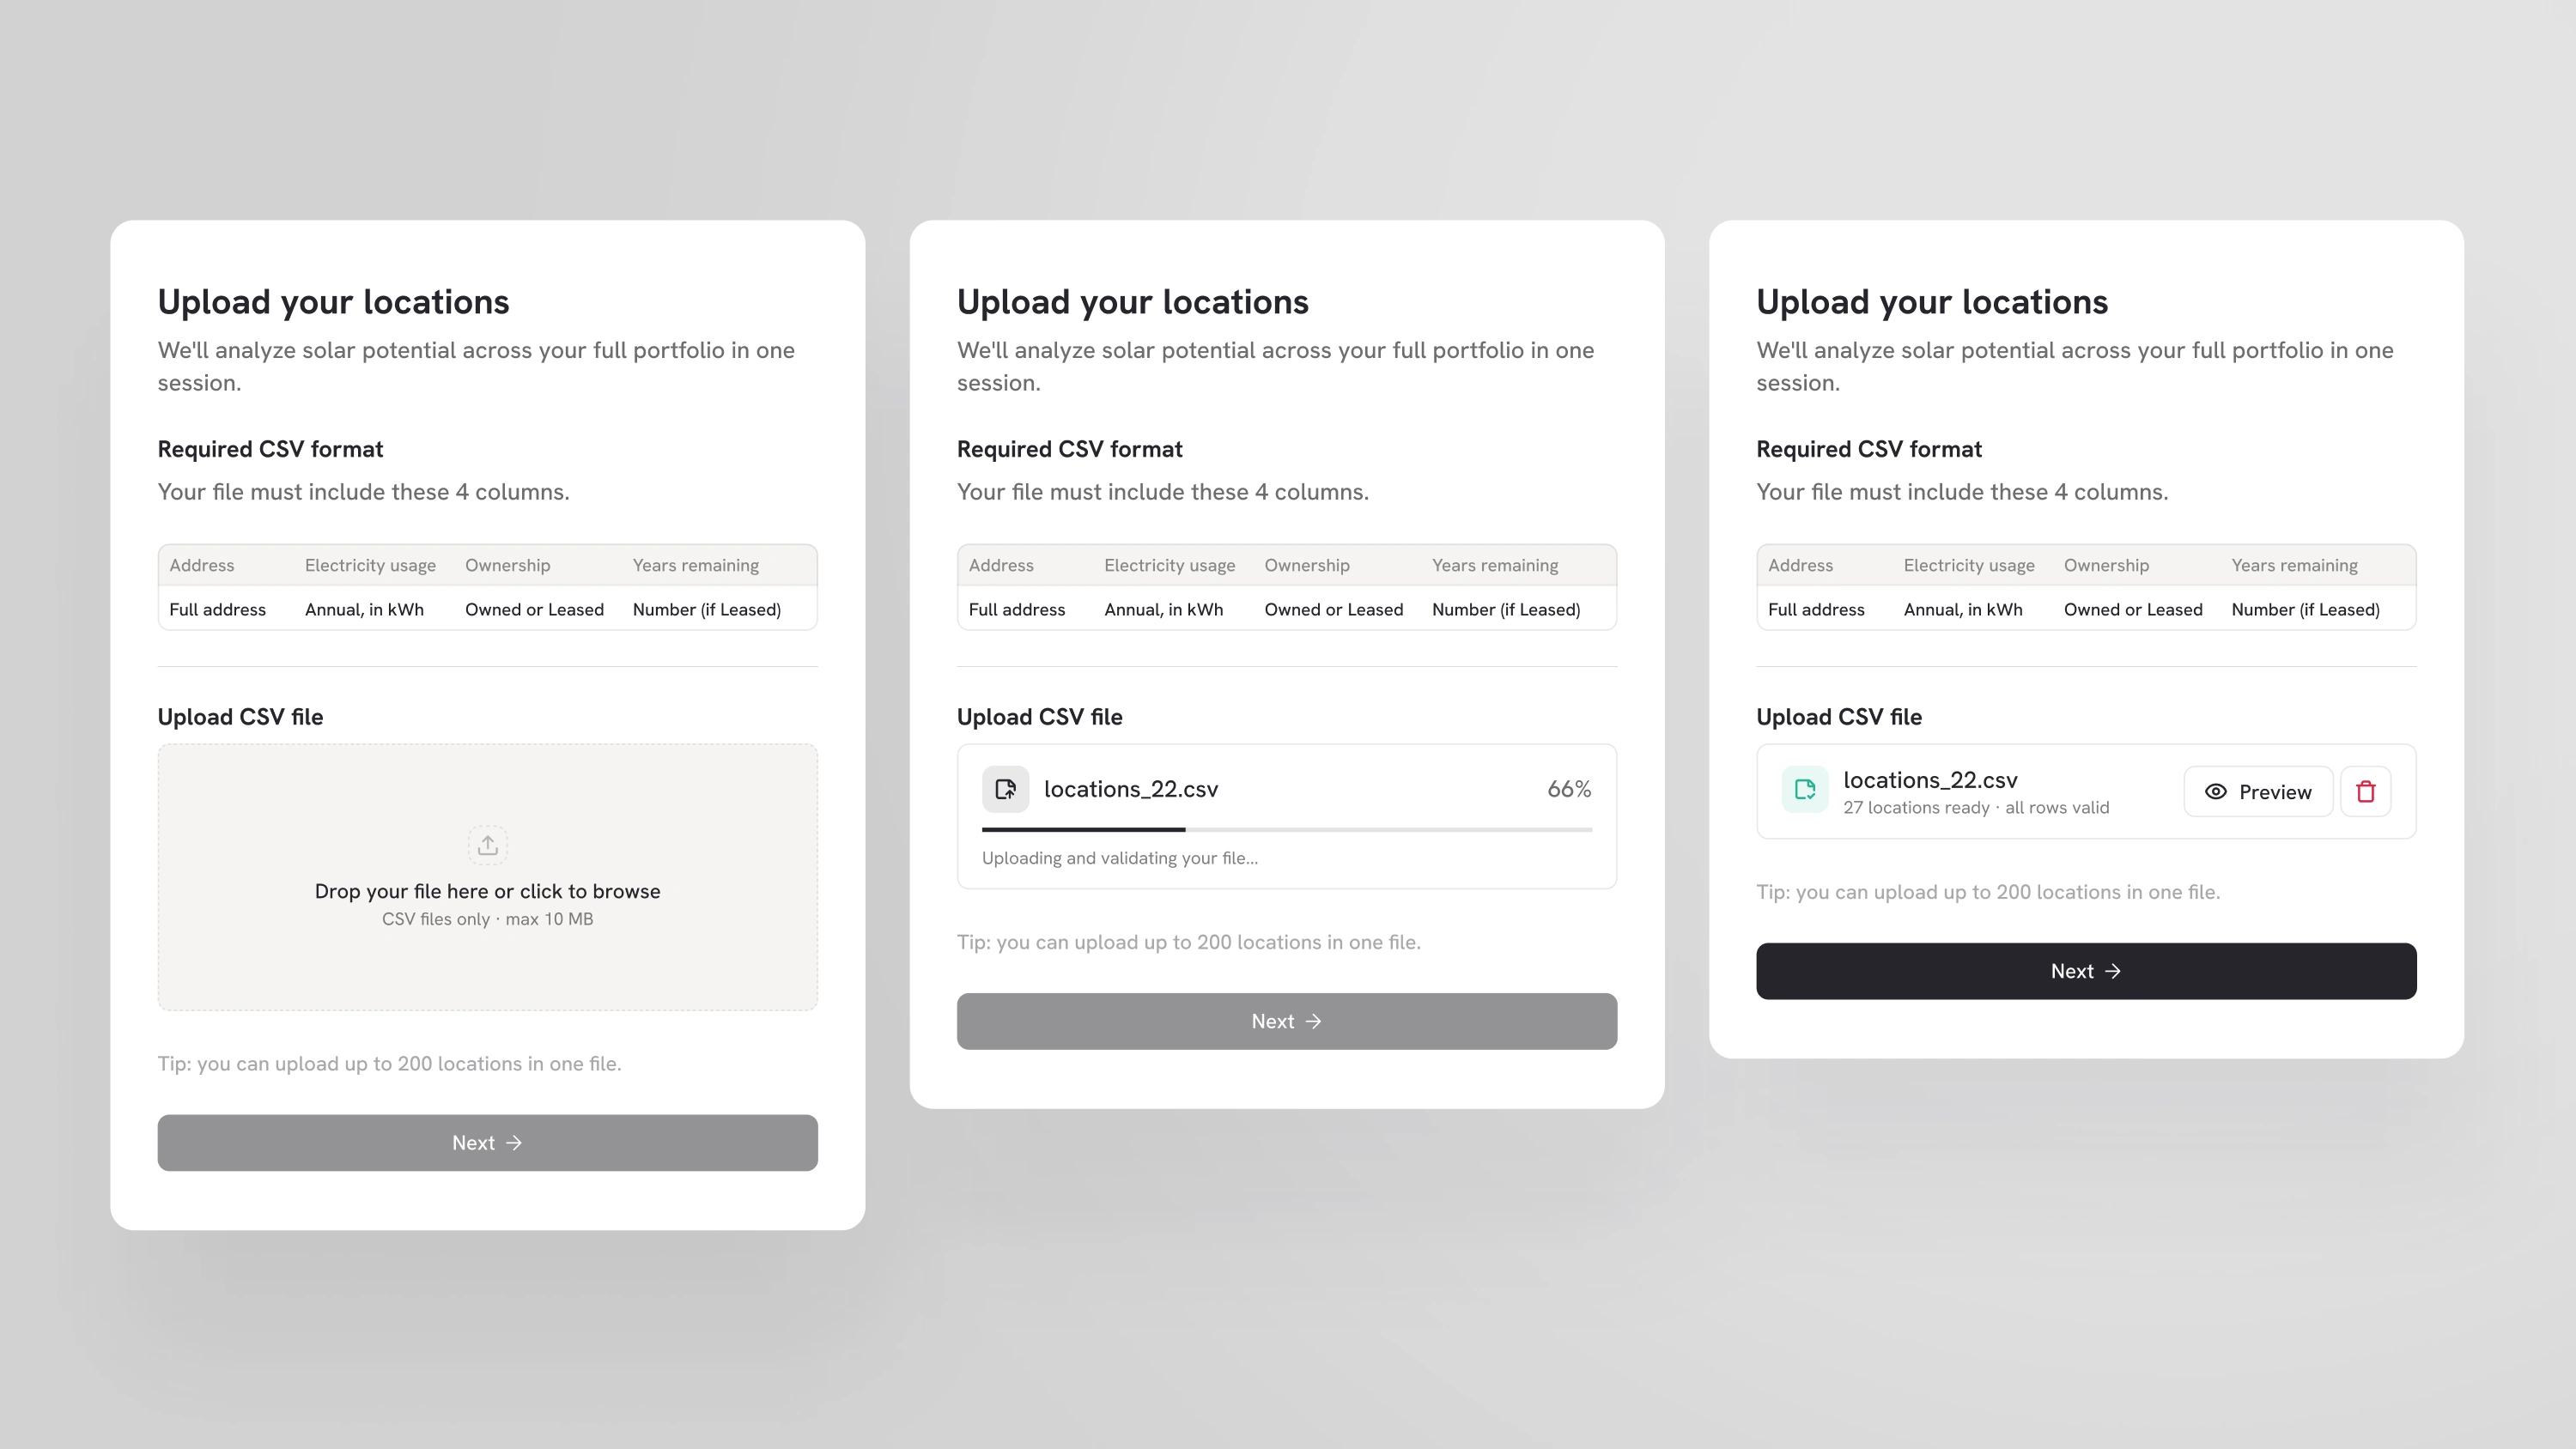
Everything starts with a CSV of the client's locations, handled in three states: attach, validate, proceed.
The schema is shown before the upload rather than after it fails. Portfolio managers export from systems that name columns inconsistently, so showing the expected format up front costs one screen and prevents a whole class of failed uploads.
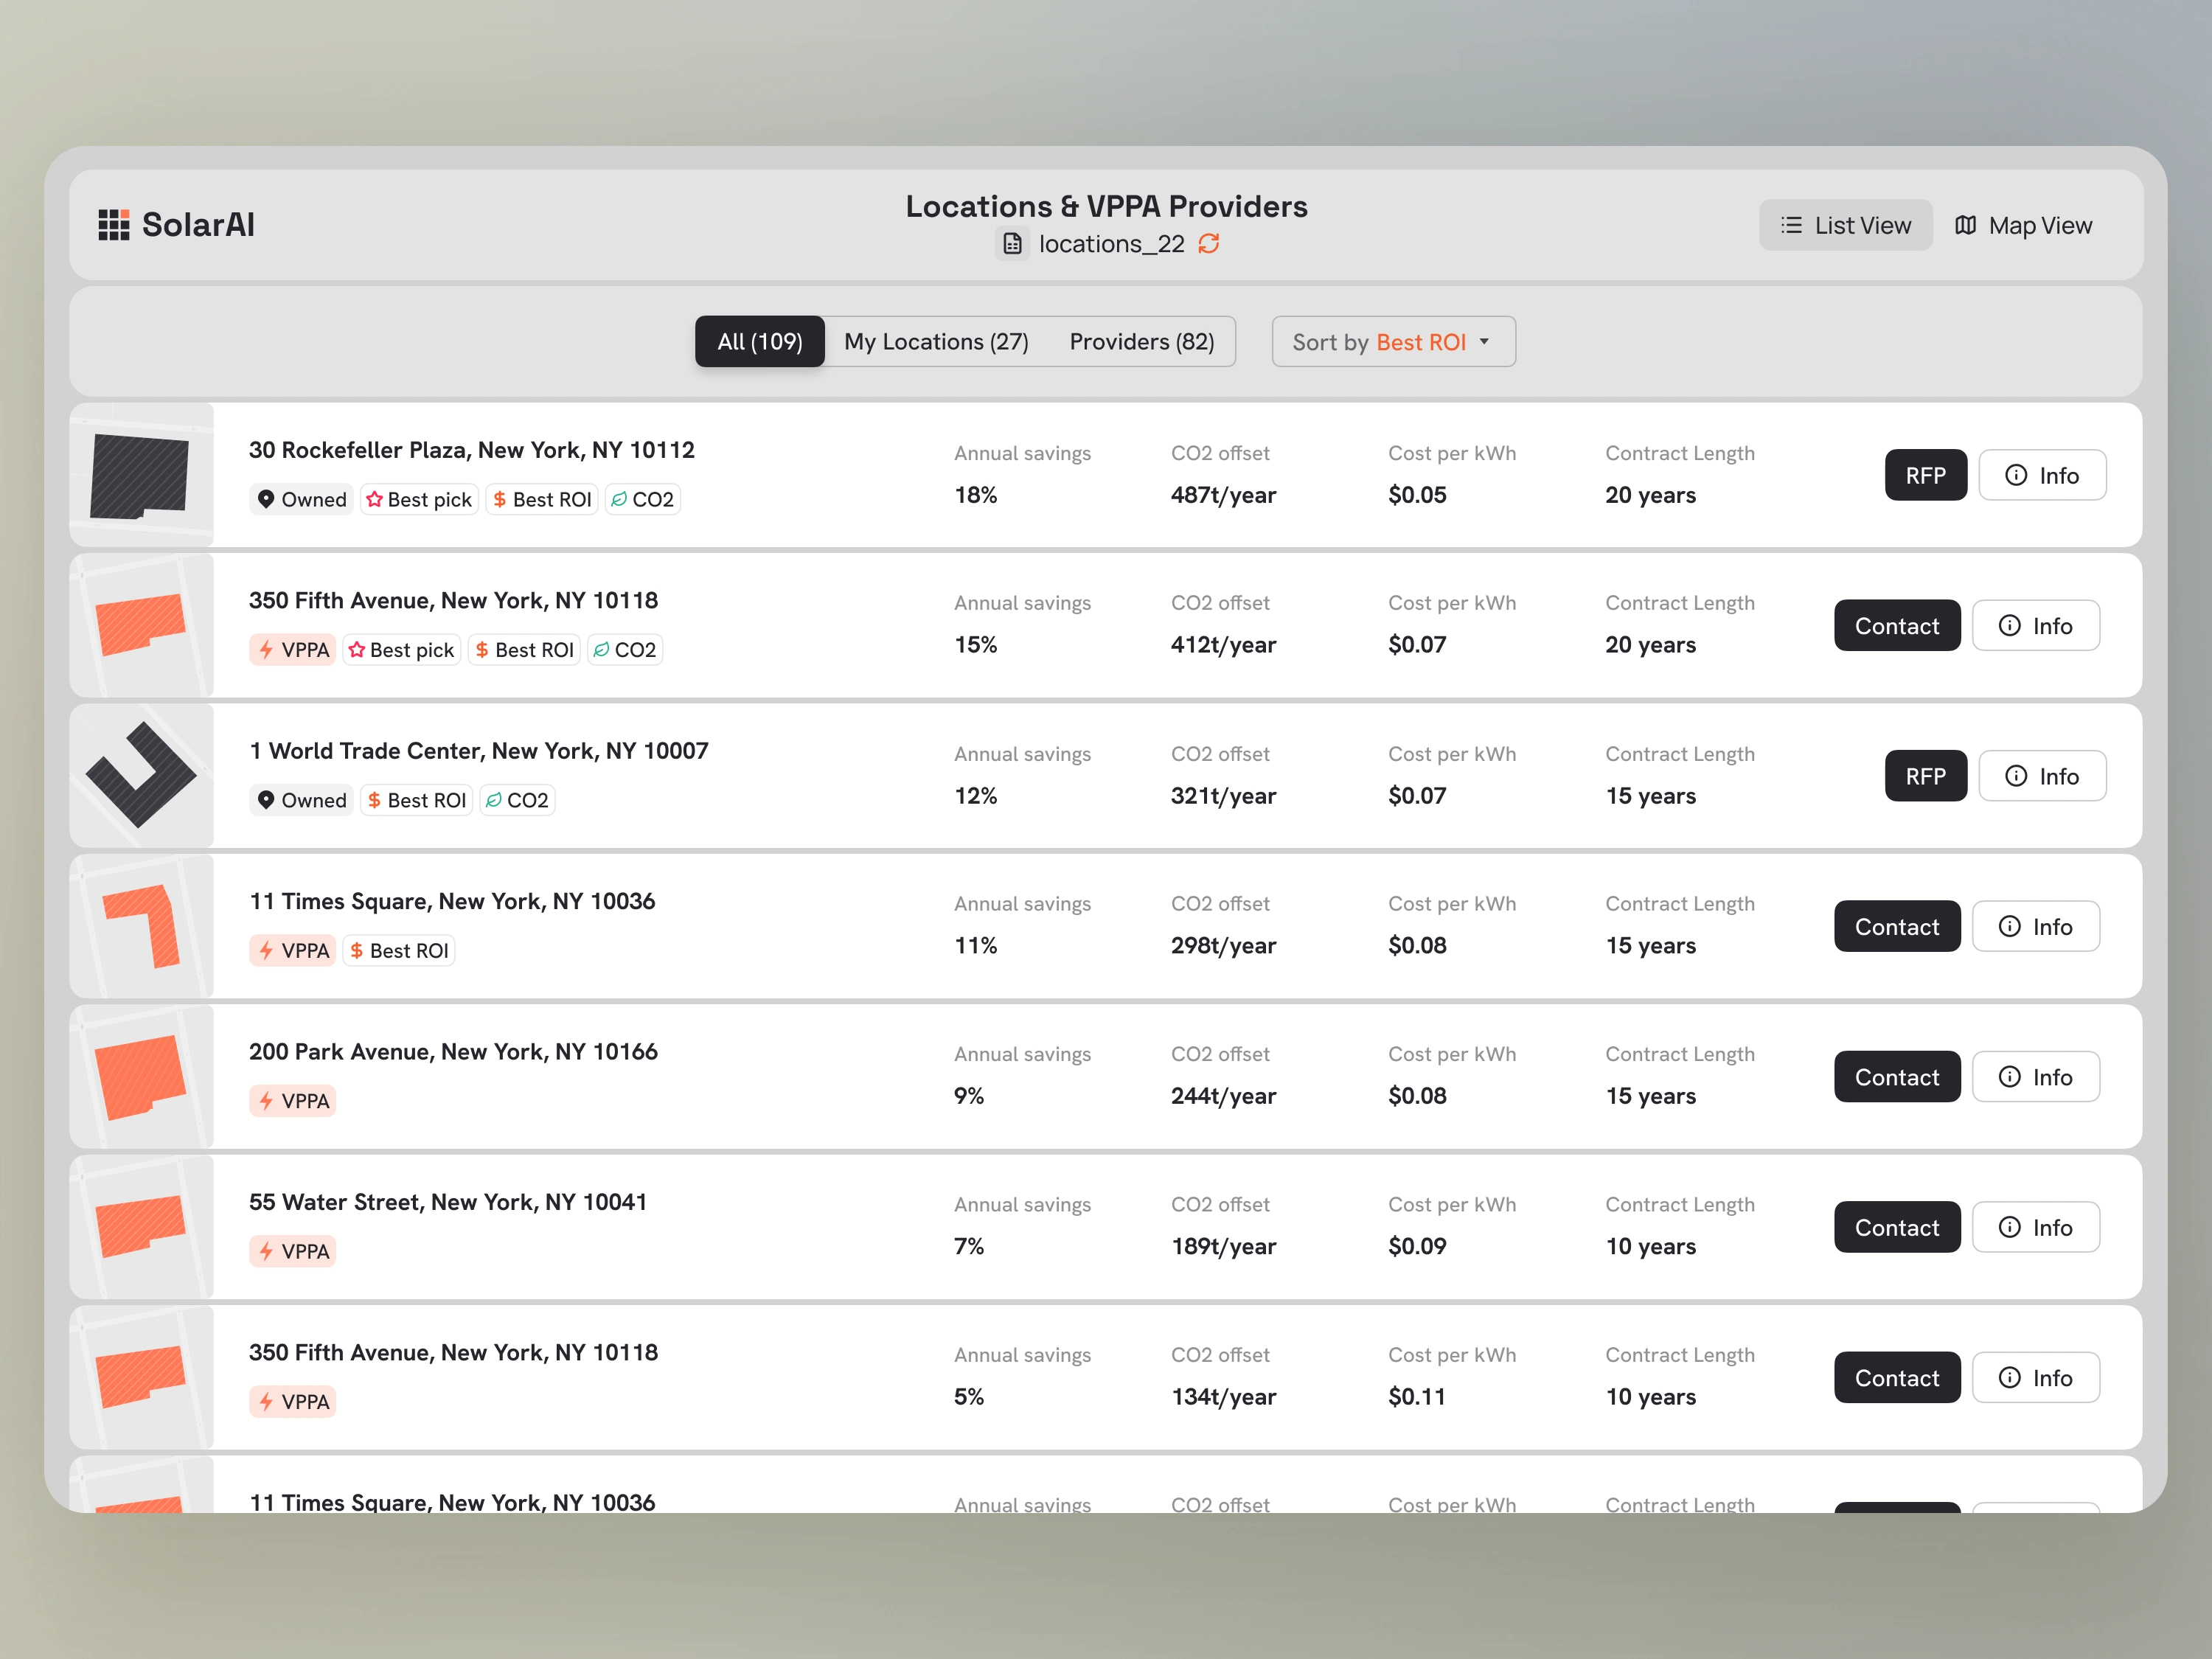
The list is where decisions happen
Every row carries the four numbers that drive the decision: annual savings, CO2 offset, cost per kWh, and contract length. Owned locations can go straight to an RFP, and provider rows open a path to contact.
The list is the default view because owners think in portfolios rather than geography. They arrive with a set of buildings and a budget, not with a region. Sorting forty rows by payback period is a decision. Panning a map is not.
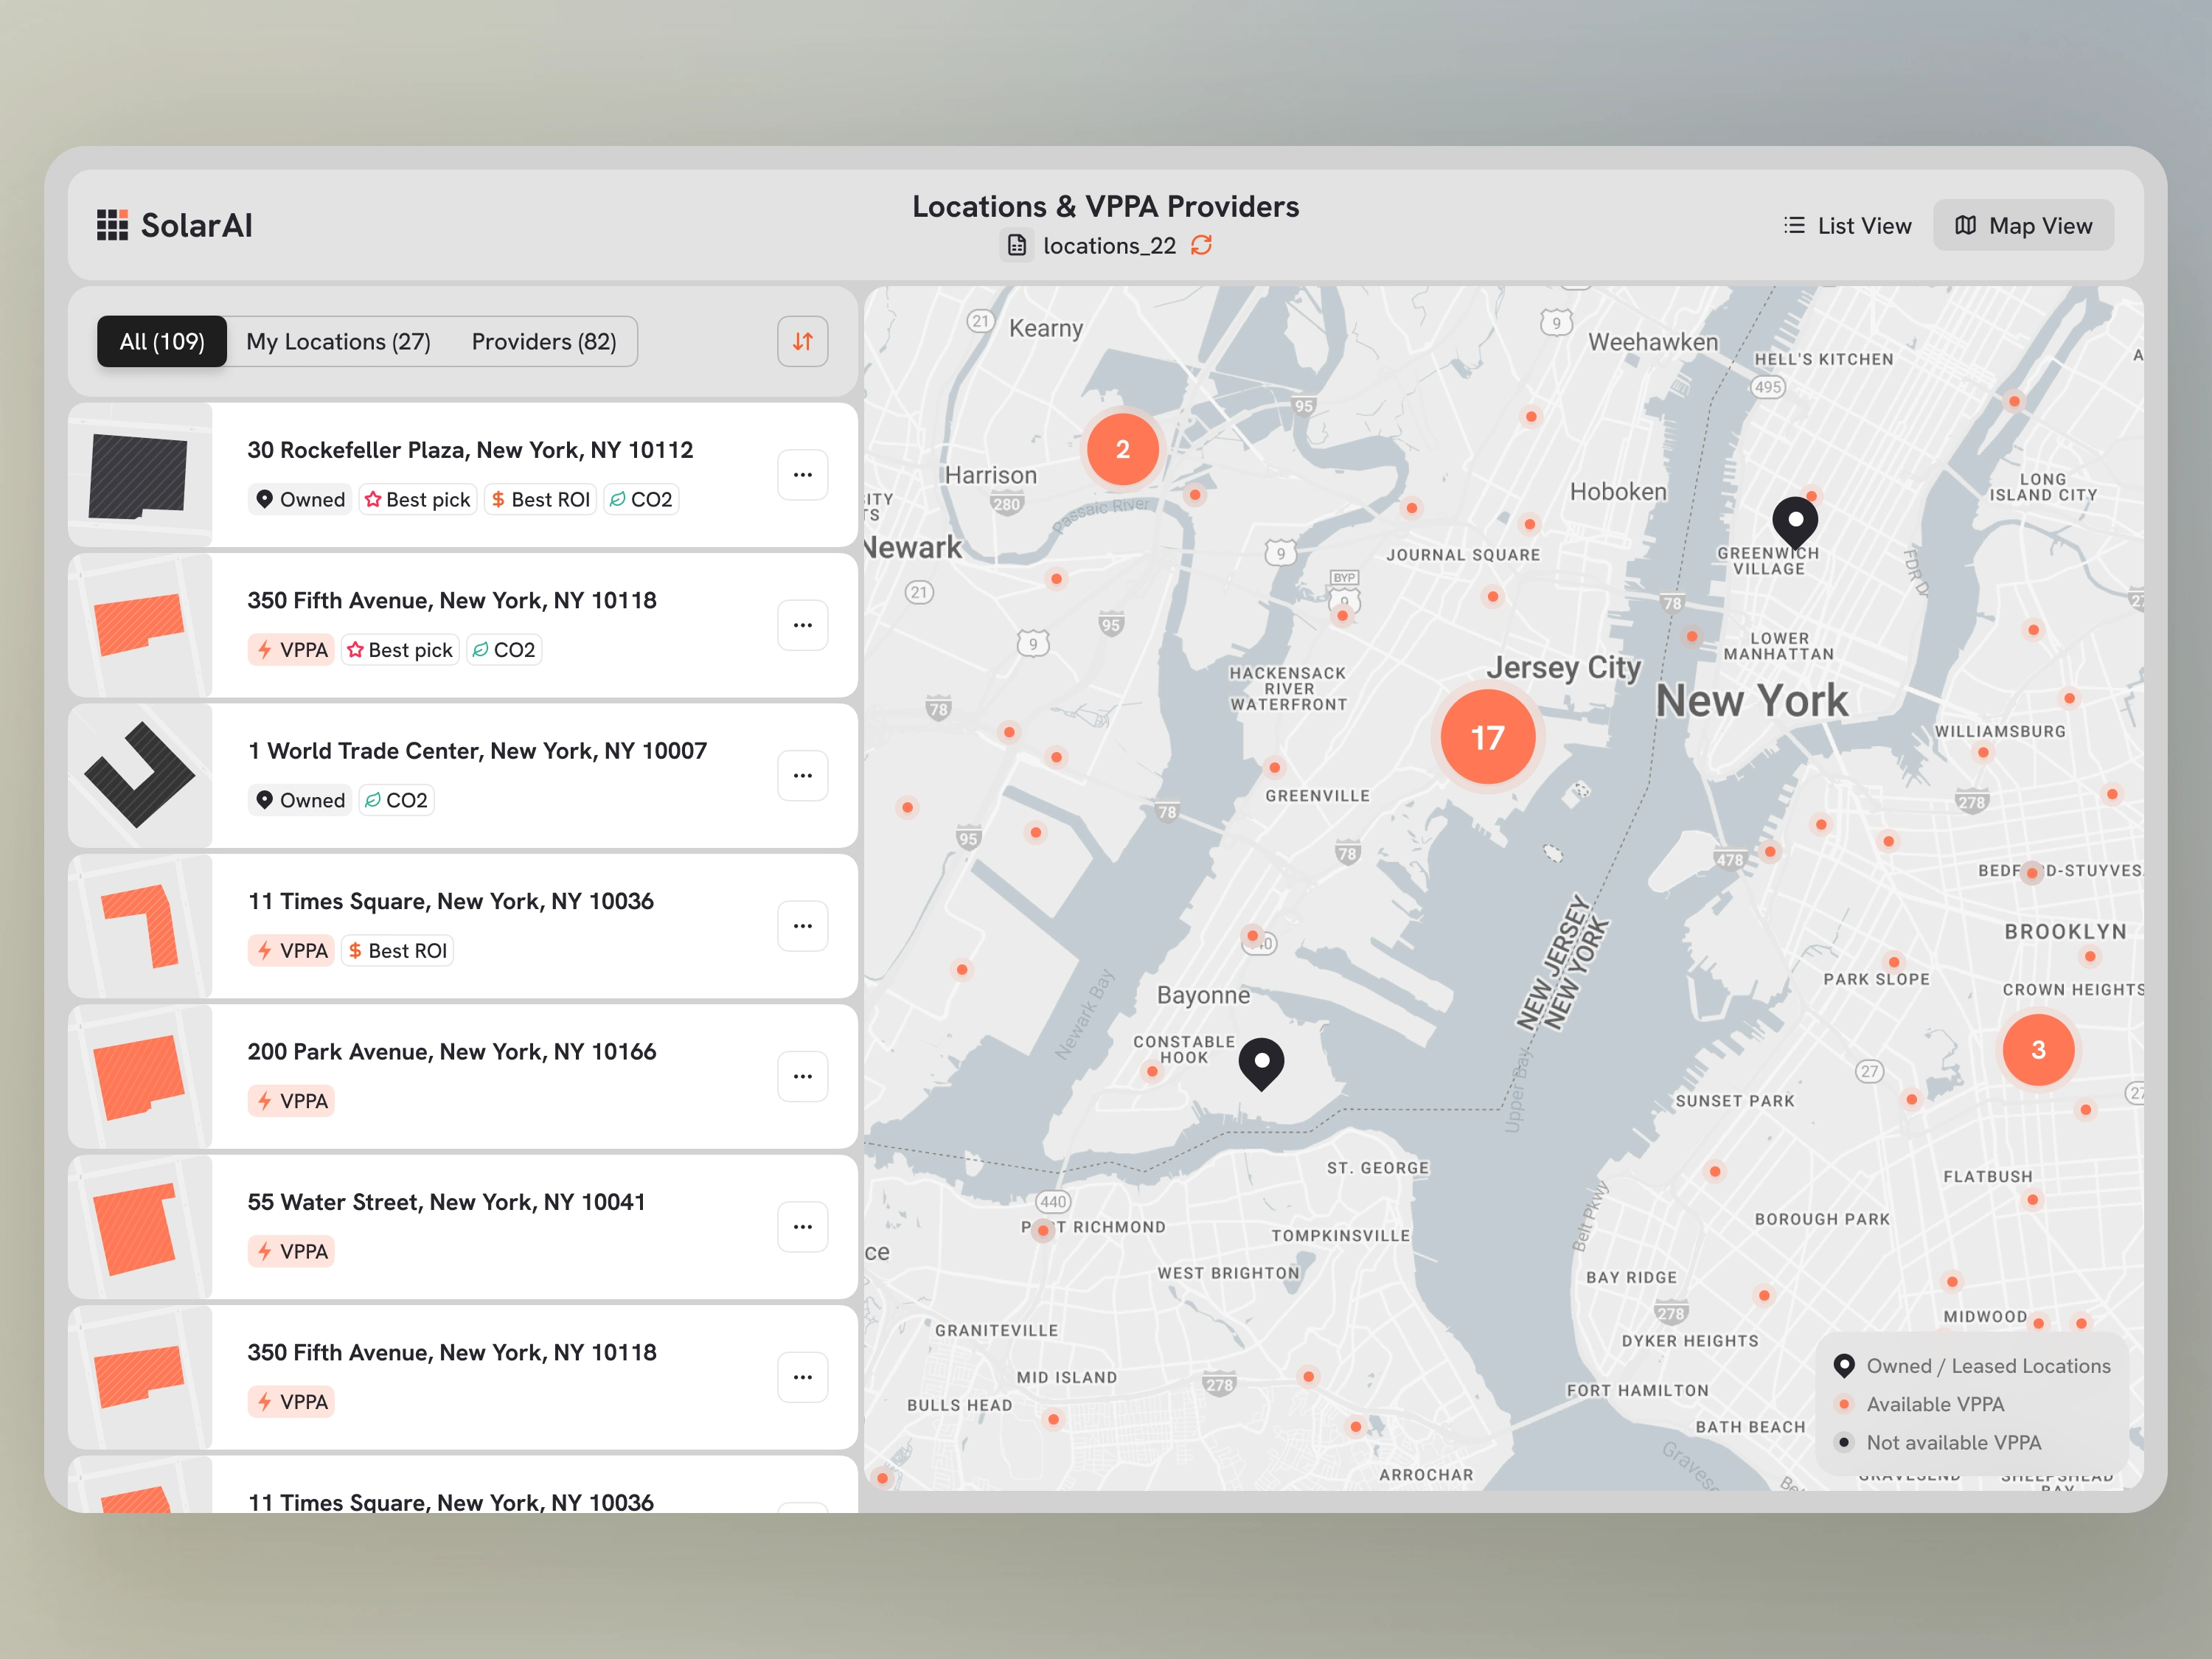
The map answers where, not whether
Switching to map view keeps the list visible and collapses the data columns. The question being asked changes: which regions hold the most opportunity, and where the strong candidates cluster.
It is the same data seen a different way. The list is for deciding and the map is for understanding, and keeping both on screen means the switch never costs the user their place.
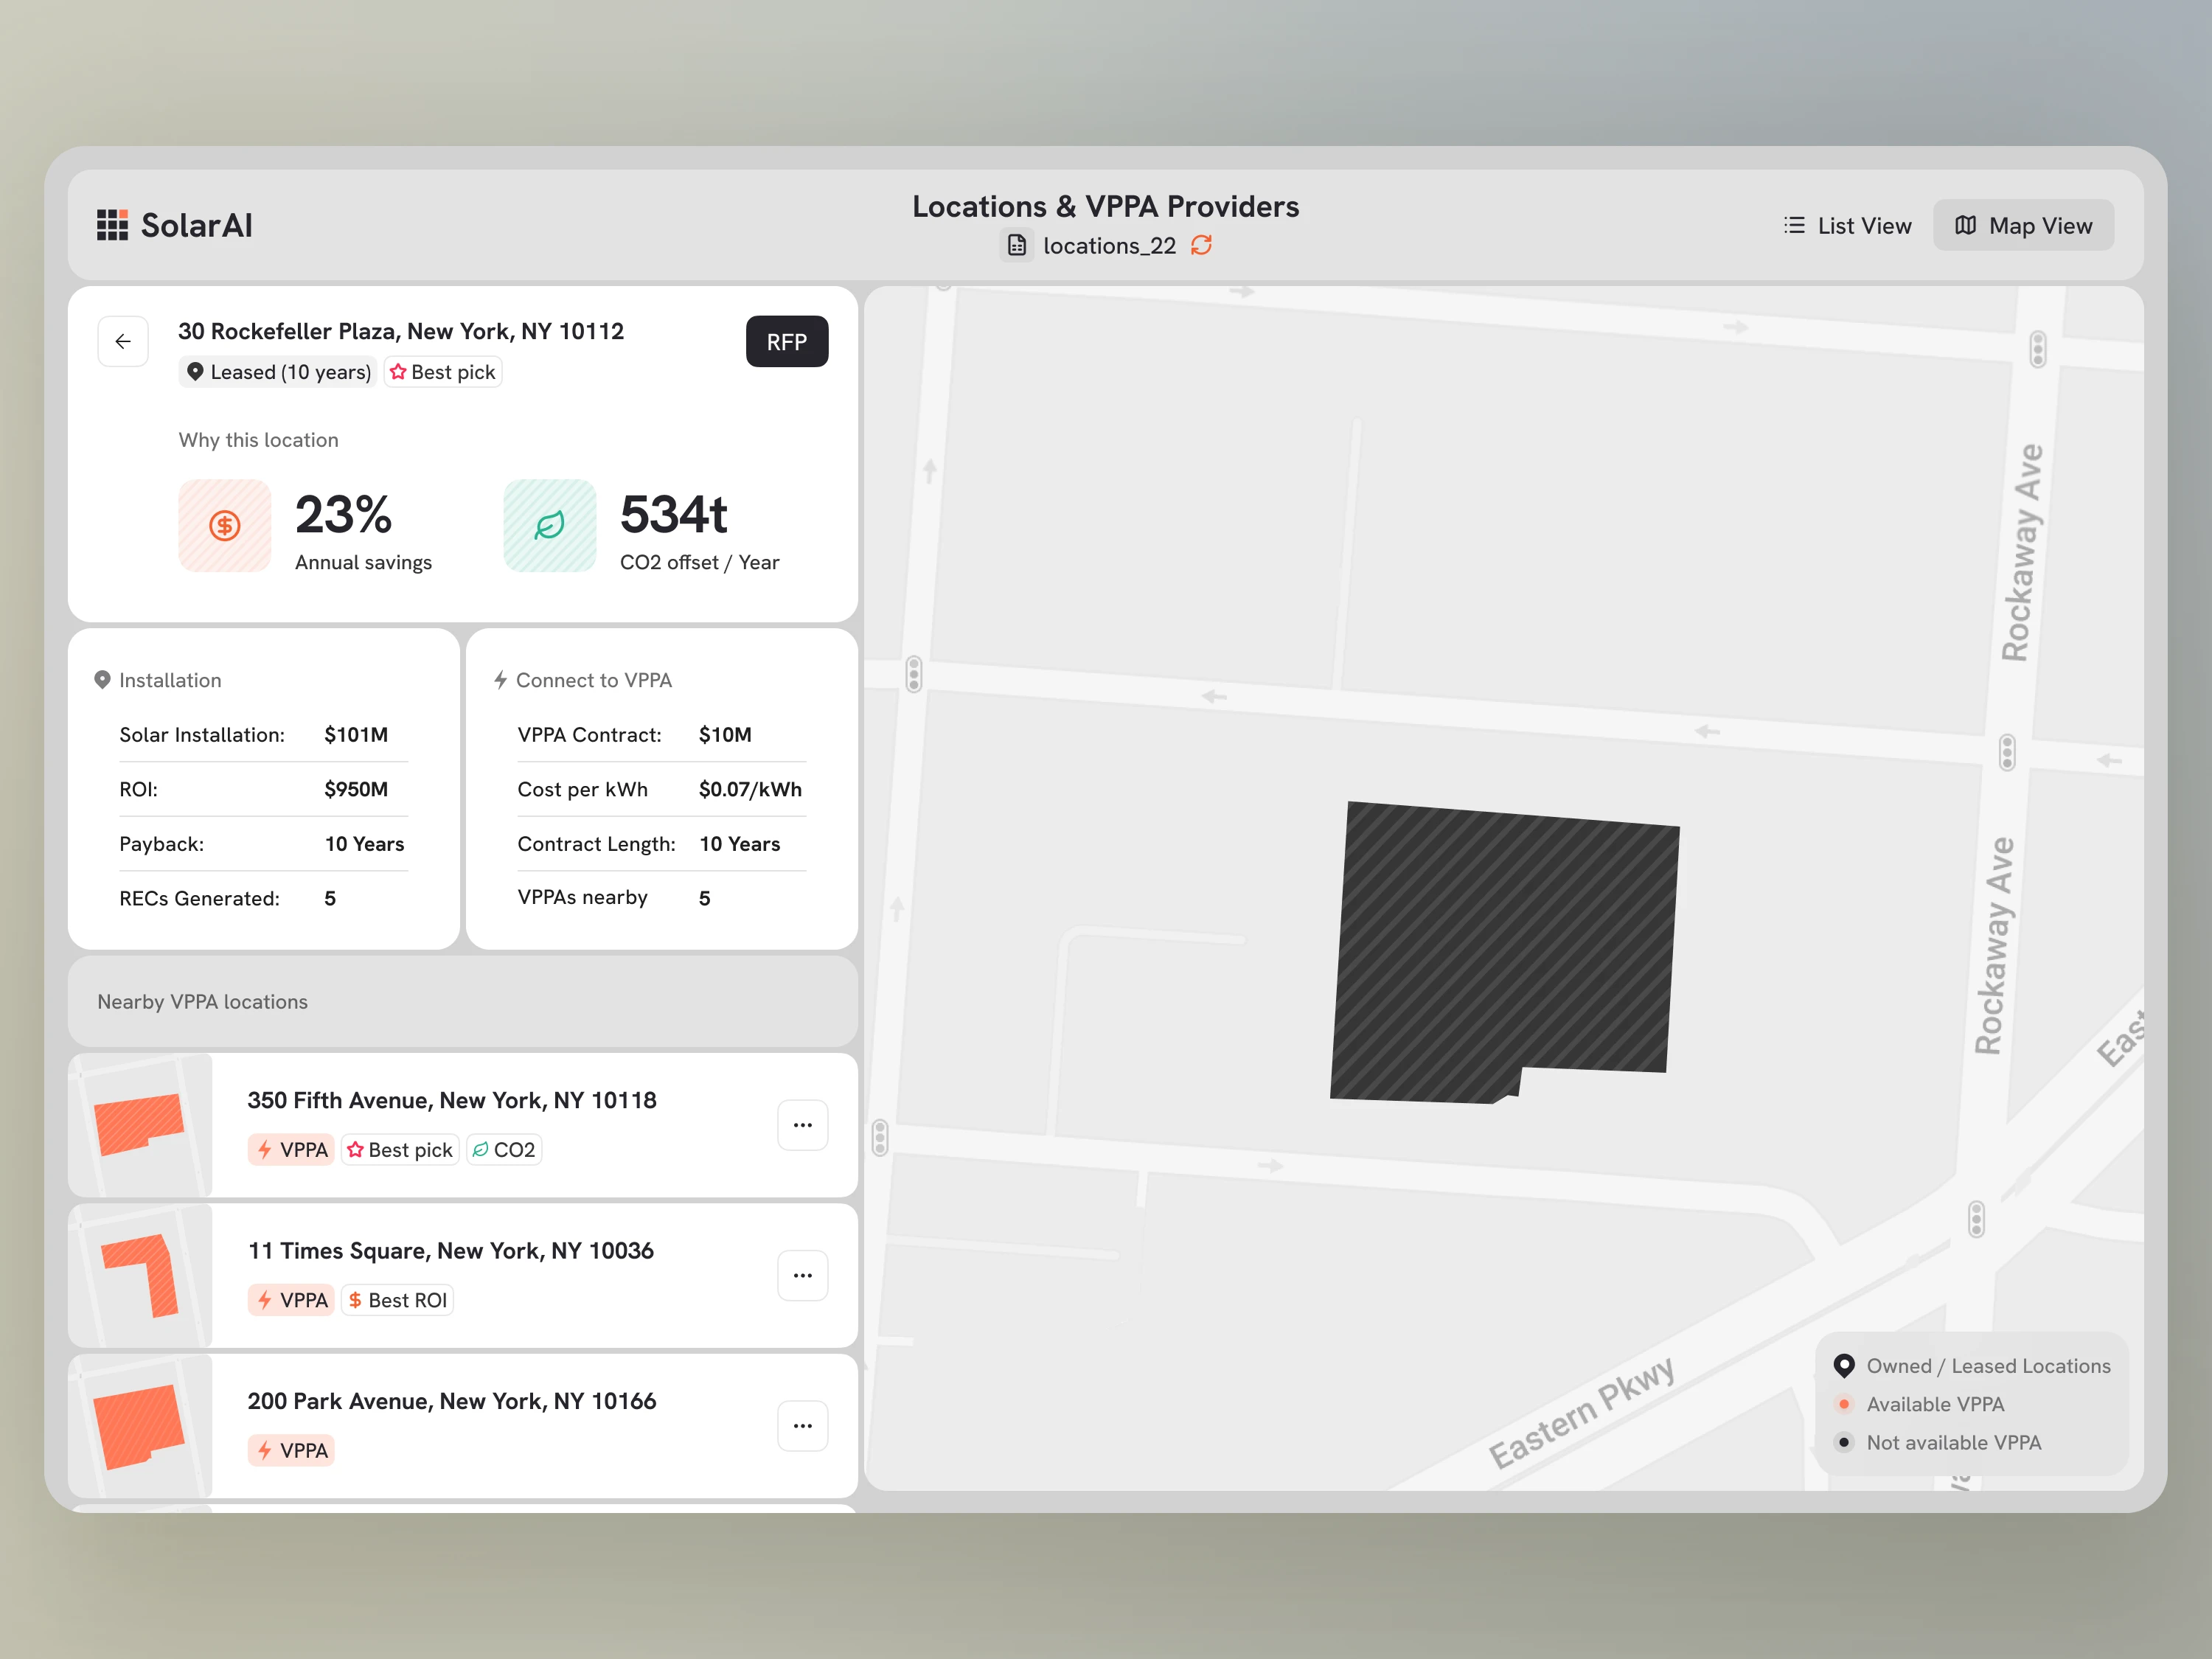
Why the AI flagged this building
Selecting one of your own locations opens the reasoning behind it: why the model surfaced this building, and the financial case for it. Nothing is committed at this point. The numbers are there so you can weigh installing against contracting.
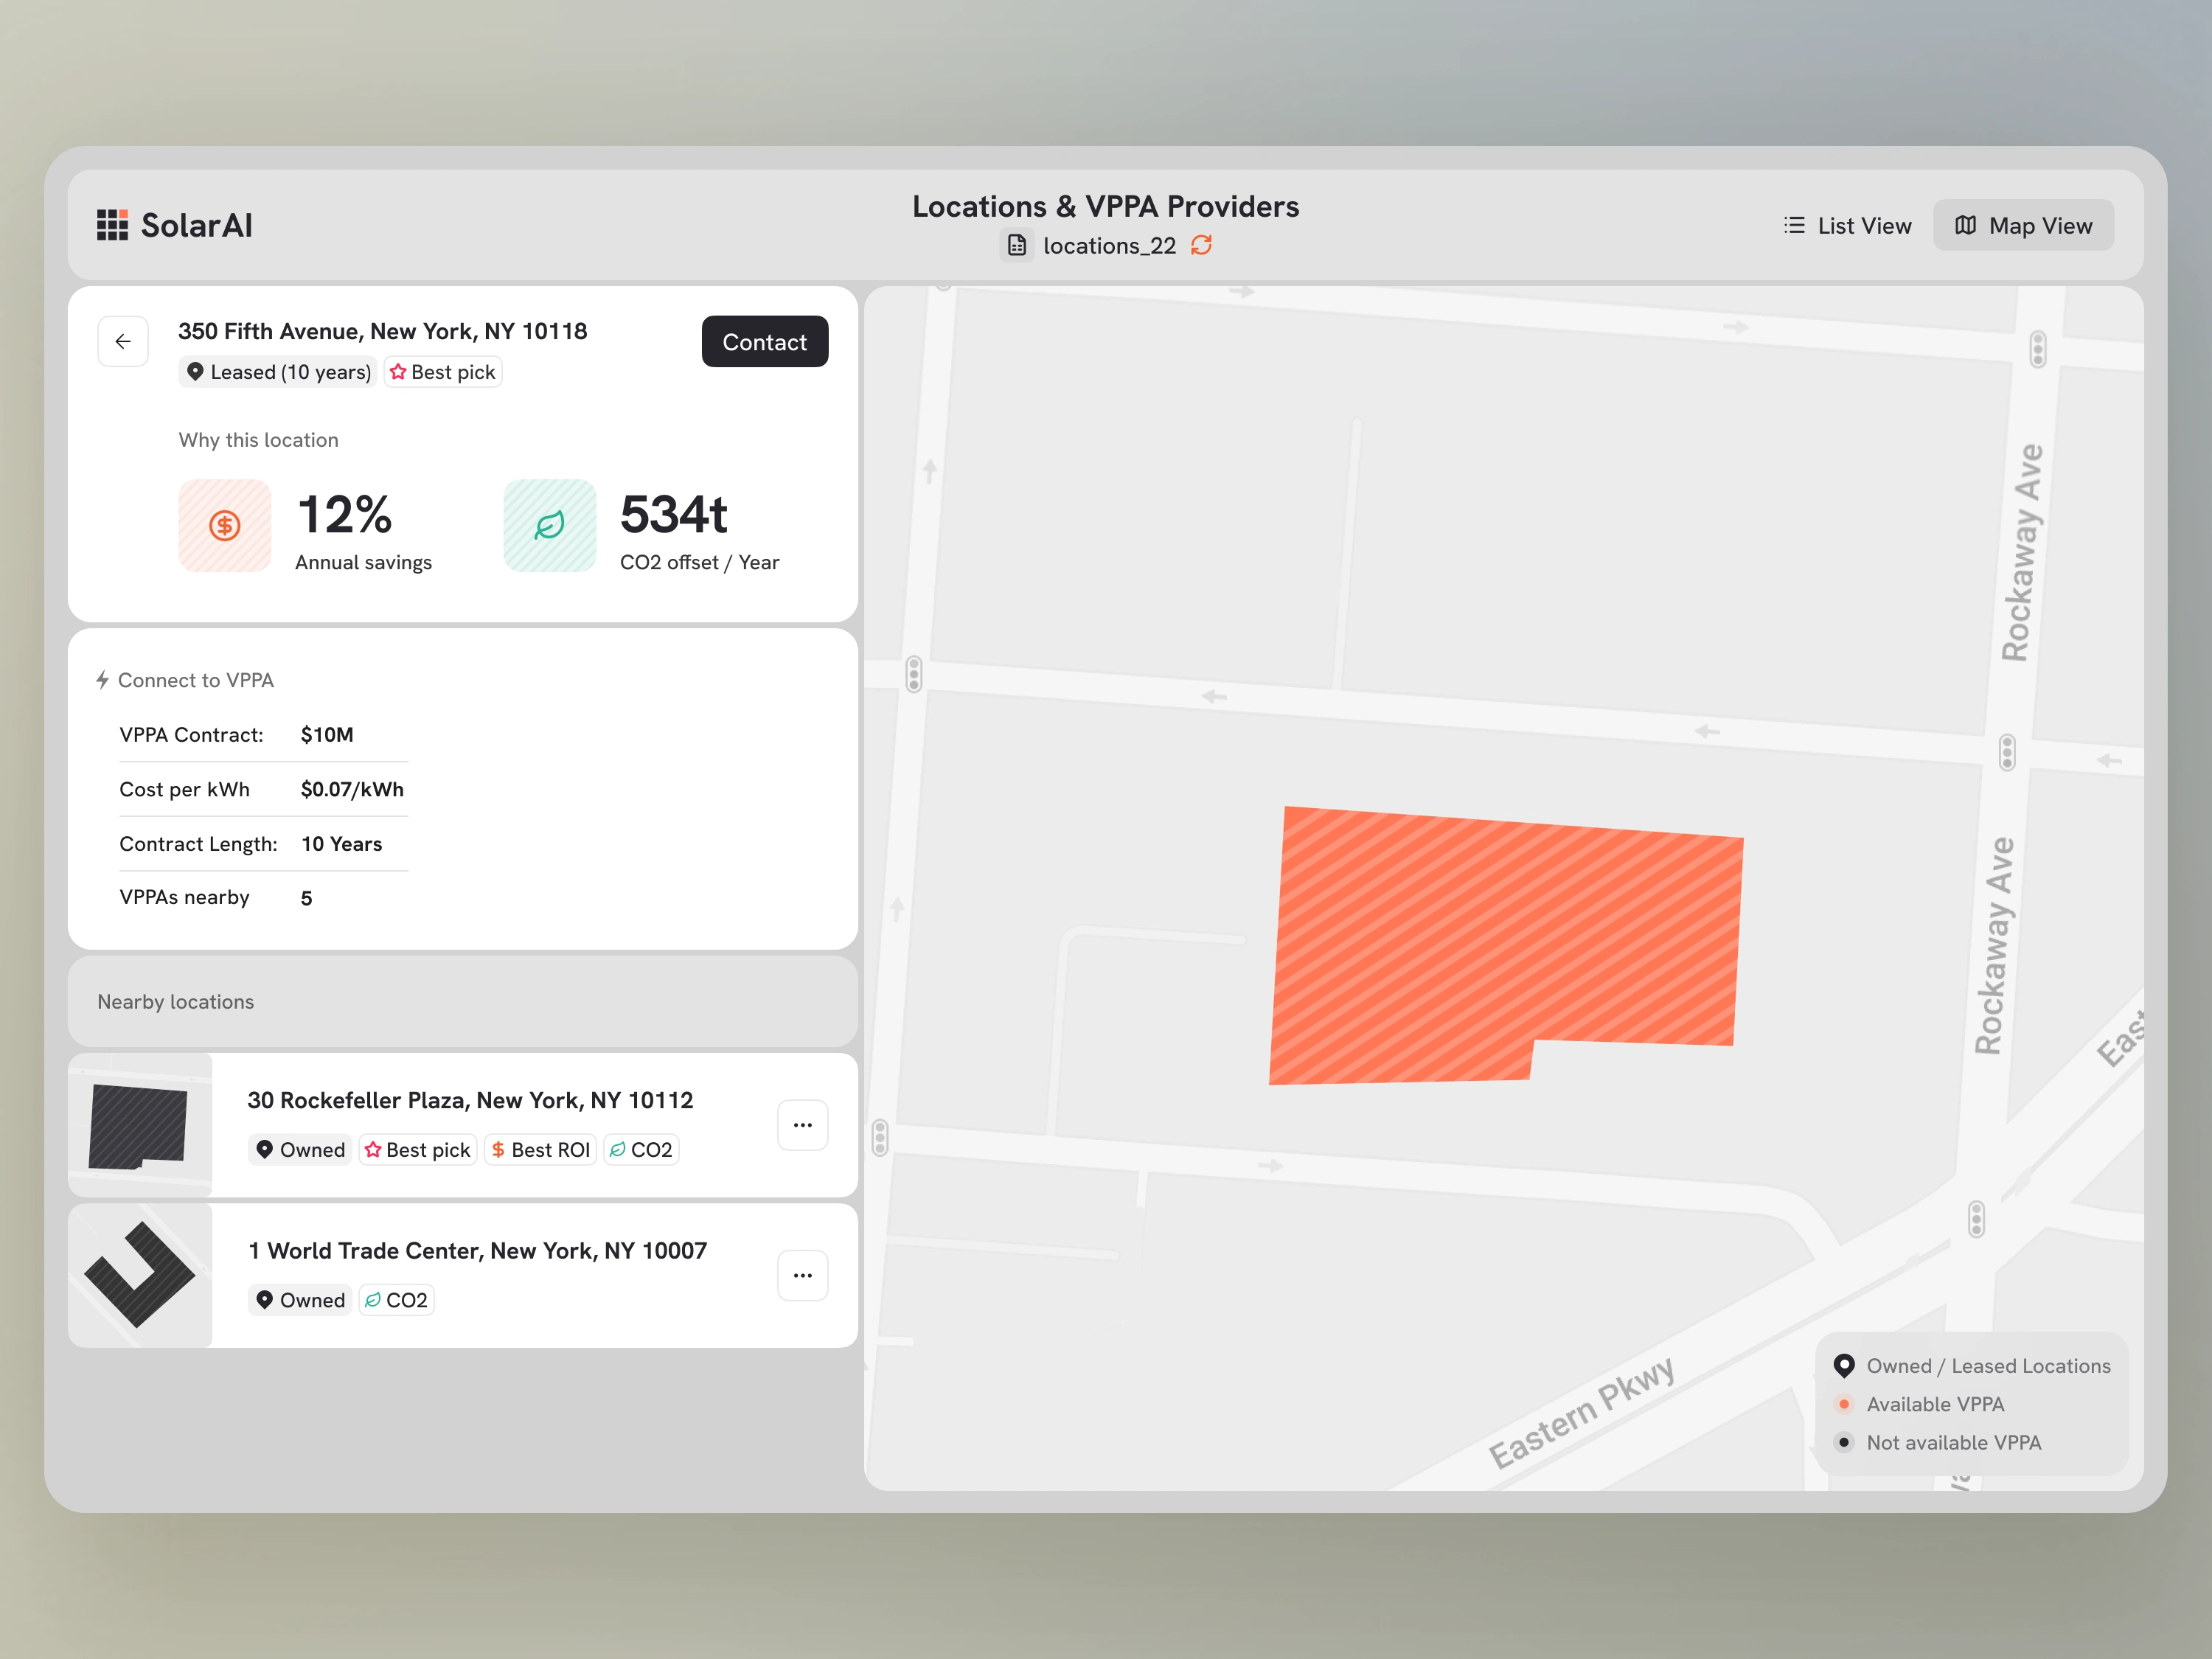
A provider is a contract, not an installation
Selecting a provider works differently. Installation data disappears because it does not apply here. What appears instead is the VPPA contract terms, the cost per kWh, and how many agreements are nearby, with the locations that provider could serve listed underneath.
It is the same component holding different content, so the panel answers whichever question the selection implies.
What I'd push further
Structured stakeholder interviews at the start, about how these teams evaluate portfolios today, would have surfaced the VPPA mechanics before I designed against them. That is a correction to the process rather than to the interface.
After that: real-time energy output monitoring with live data, and predictive analytics for contract renewals. Both need the product to be running before they mean anything.
Where it landed
Delivered within the agreed design sprint, working alone, from the first flow through every interaction state. The client left a positive review.
One limit worth stating: this was an MVP built to secure stakeholder buy-in, not a metered product, so there are no adoption numbers to report. What the project does show is how I work when I’m entering an unfamiliar domain, and how I change direction when the client’s constraints contradict my first assumption.
Like this project
Posted Jul 30, 2026
I designed a B2B tool that helps commercial property teams compare solar opportunities across 40+ buildings, without spreadsheet-heavy site-by-site analysis.
Likes
1
Views
8