Finance Analytics Dashboard Design
Pooja Pawar
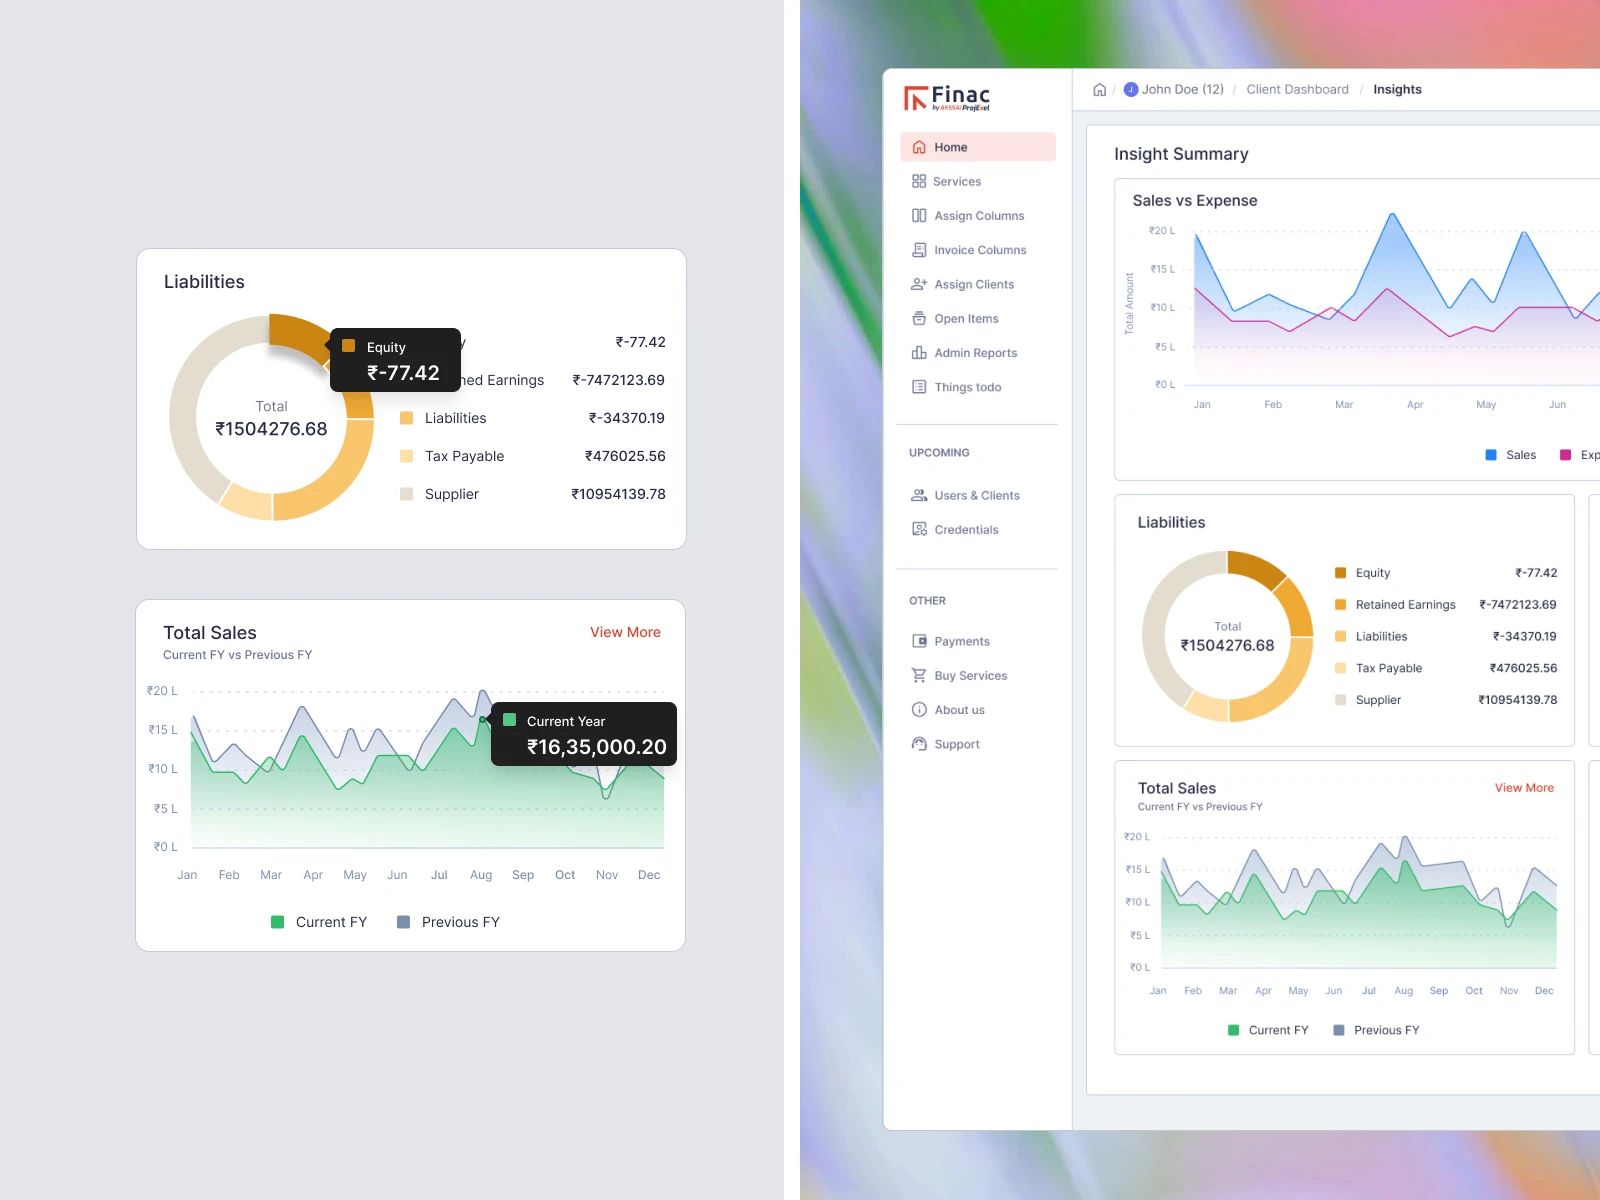
Graph On Hover Interactions
Project Overview
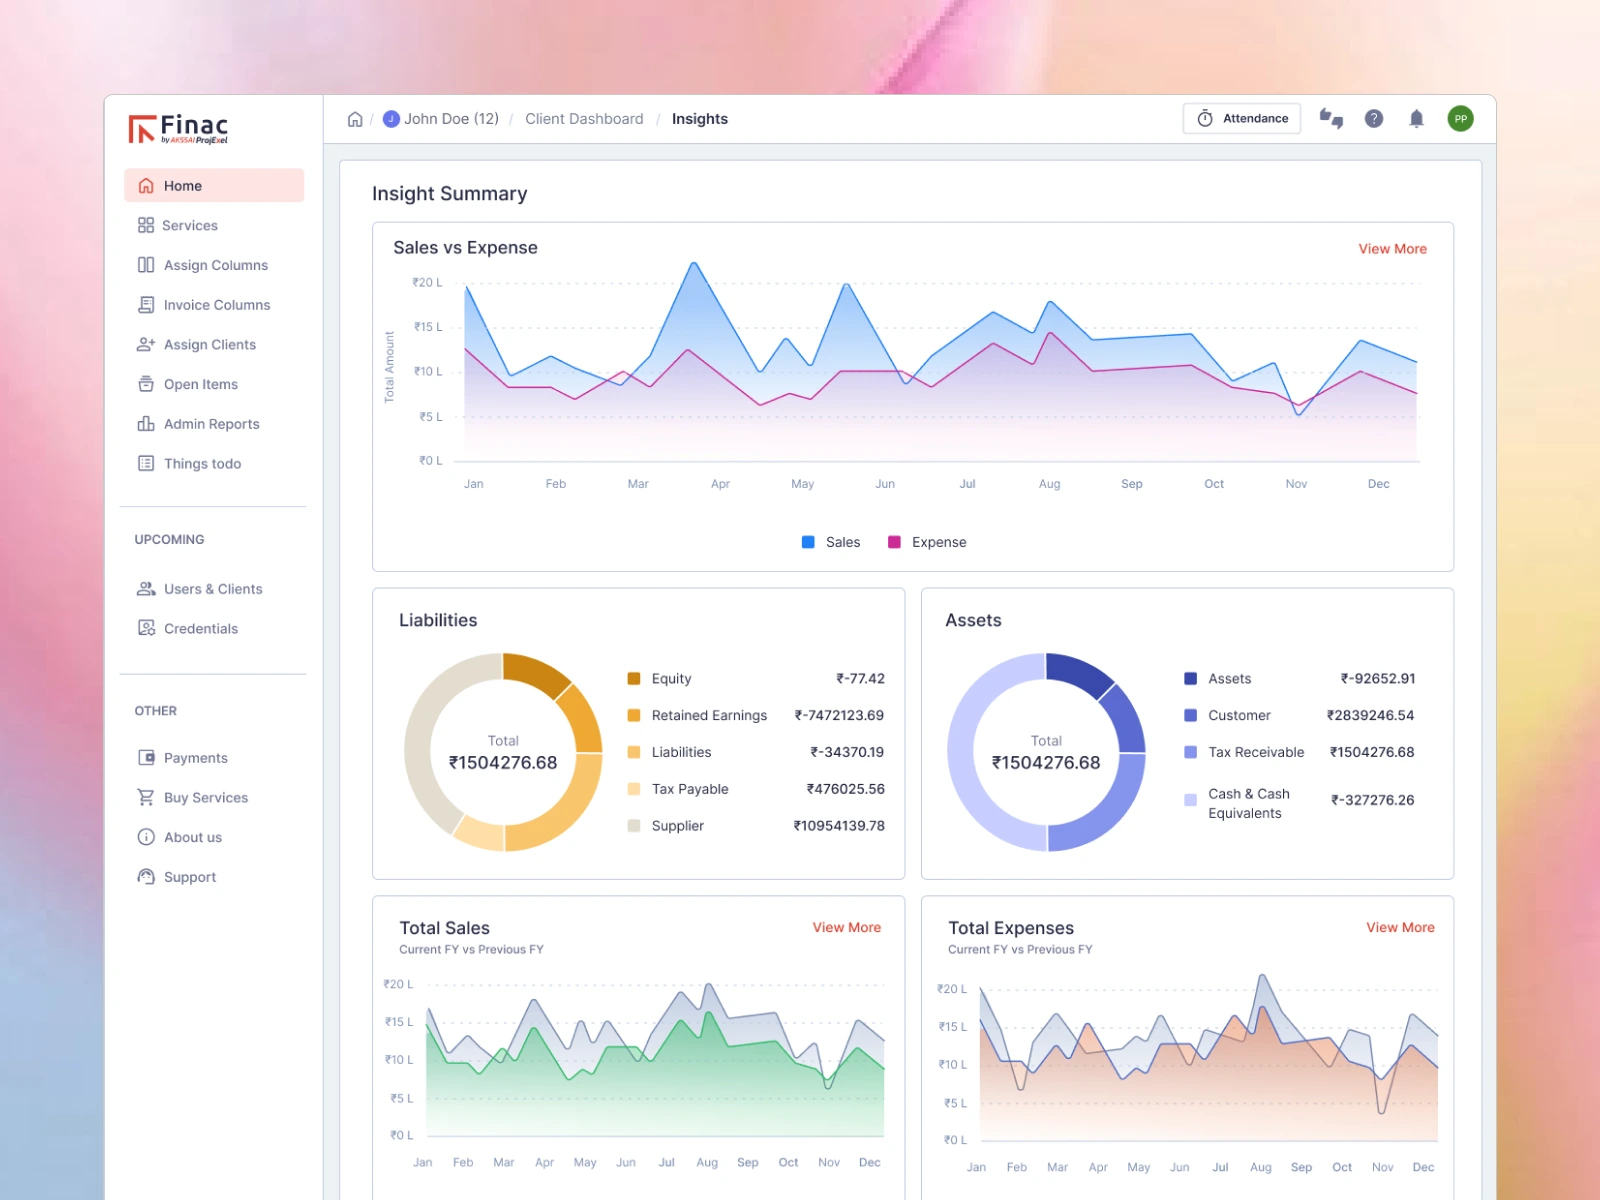
Designed a financial insights dashboard for Finac, aimed at giving users a clear, real-time understanding of their business health. The goal was to transform complex financial data into an intuitive, easy-to-read interface that supports faster decision-making.
Problem Definition
Users struggled to understand their financial position due to scattered data, dense tables, and lack of visual clarity. The challenge was to consolidate sales, expenses, assets, and liabilities into a single, digestible view without overwhelming the user.
Product Strategy & Planning
Defined core user goals: quick financial overview, trend tracking, and clarity on cash flow
Prioritized key metrics such as sales vs expenses, liabilities, assets, and profitability
Structured information hierarchy to support both high-level insights and detailed analysis
Aligned dashboard structure with real accounting workflows
UX Research & Information Architecture
Analyzed existing financial tools to identify usability gaps
Structured data into logical sections: summary, trends, breakdowns, and detailed tables
Designed navigation to reduce cognitive load and enable fast scanning
Dashboard & Interaction Design
Designed a clean, minimal dashboard with strong visual hierarchy
Used graphs and charts to clearly represent financial trends over time
Applied color coding to differentiate income, expenses, and liabilities
Created reusable UI components for scalability across financial modules
Data Visualization & Clarity
Line graphs for trend comparison (sales vs expenses)
Donut charts for asset and liability distribution
Tabular views for detailed financial breakdowns
Consistent spacing, typography, and color usage to improve readability
Outcome
The final dashboard enables users to:
Quickly assess financial health at a glance
Track performance trends month-over-month
Make informed decisions with minimal cognitive effort
The design balances clarity, structure, and usability while supporting future scalability of the platform.
Like this project
Posted Dec 25, 2025
Designed a clean, intuitive financial dashboard that helps users track sales, expenses, assets, and liabilities through clear visuals and actionable insights.
Likes
1
Views
9
Timeline
Aug 11, 2024 - Aug 29, 2024
Clients
AKSSAI