SwimGoTrain: iOS swim training app concept

Yana Kostina


SwimGoTrain: a swim training app that shows a session as it happened
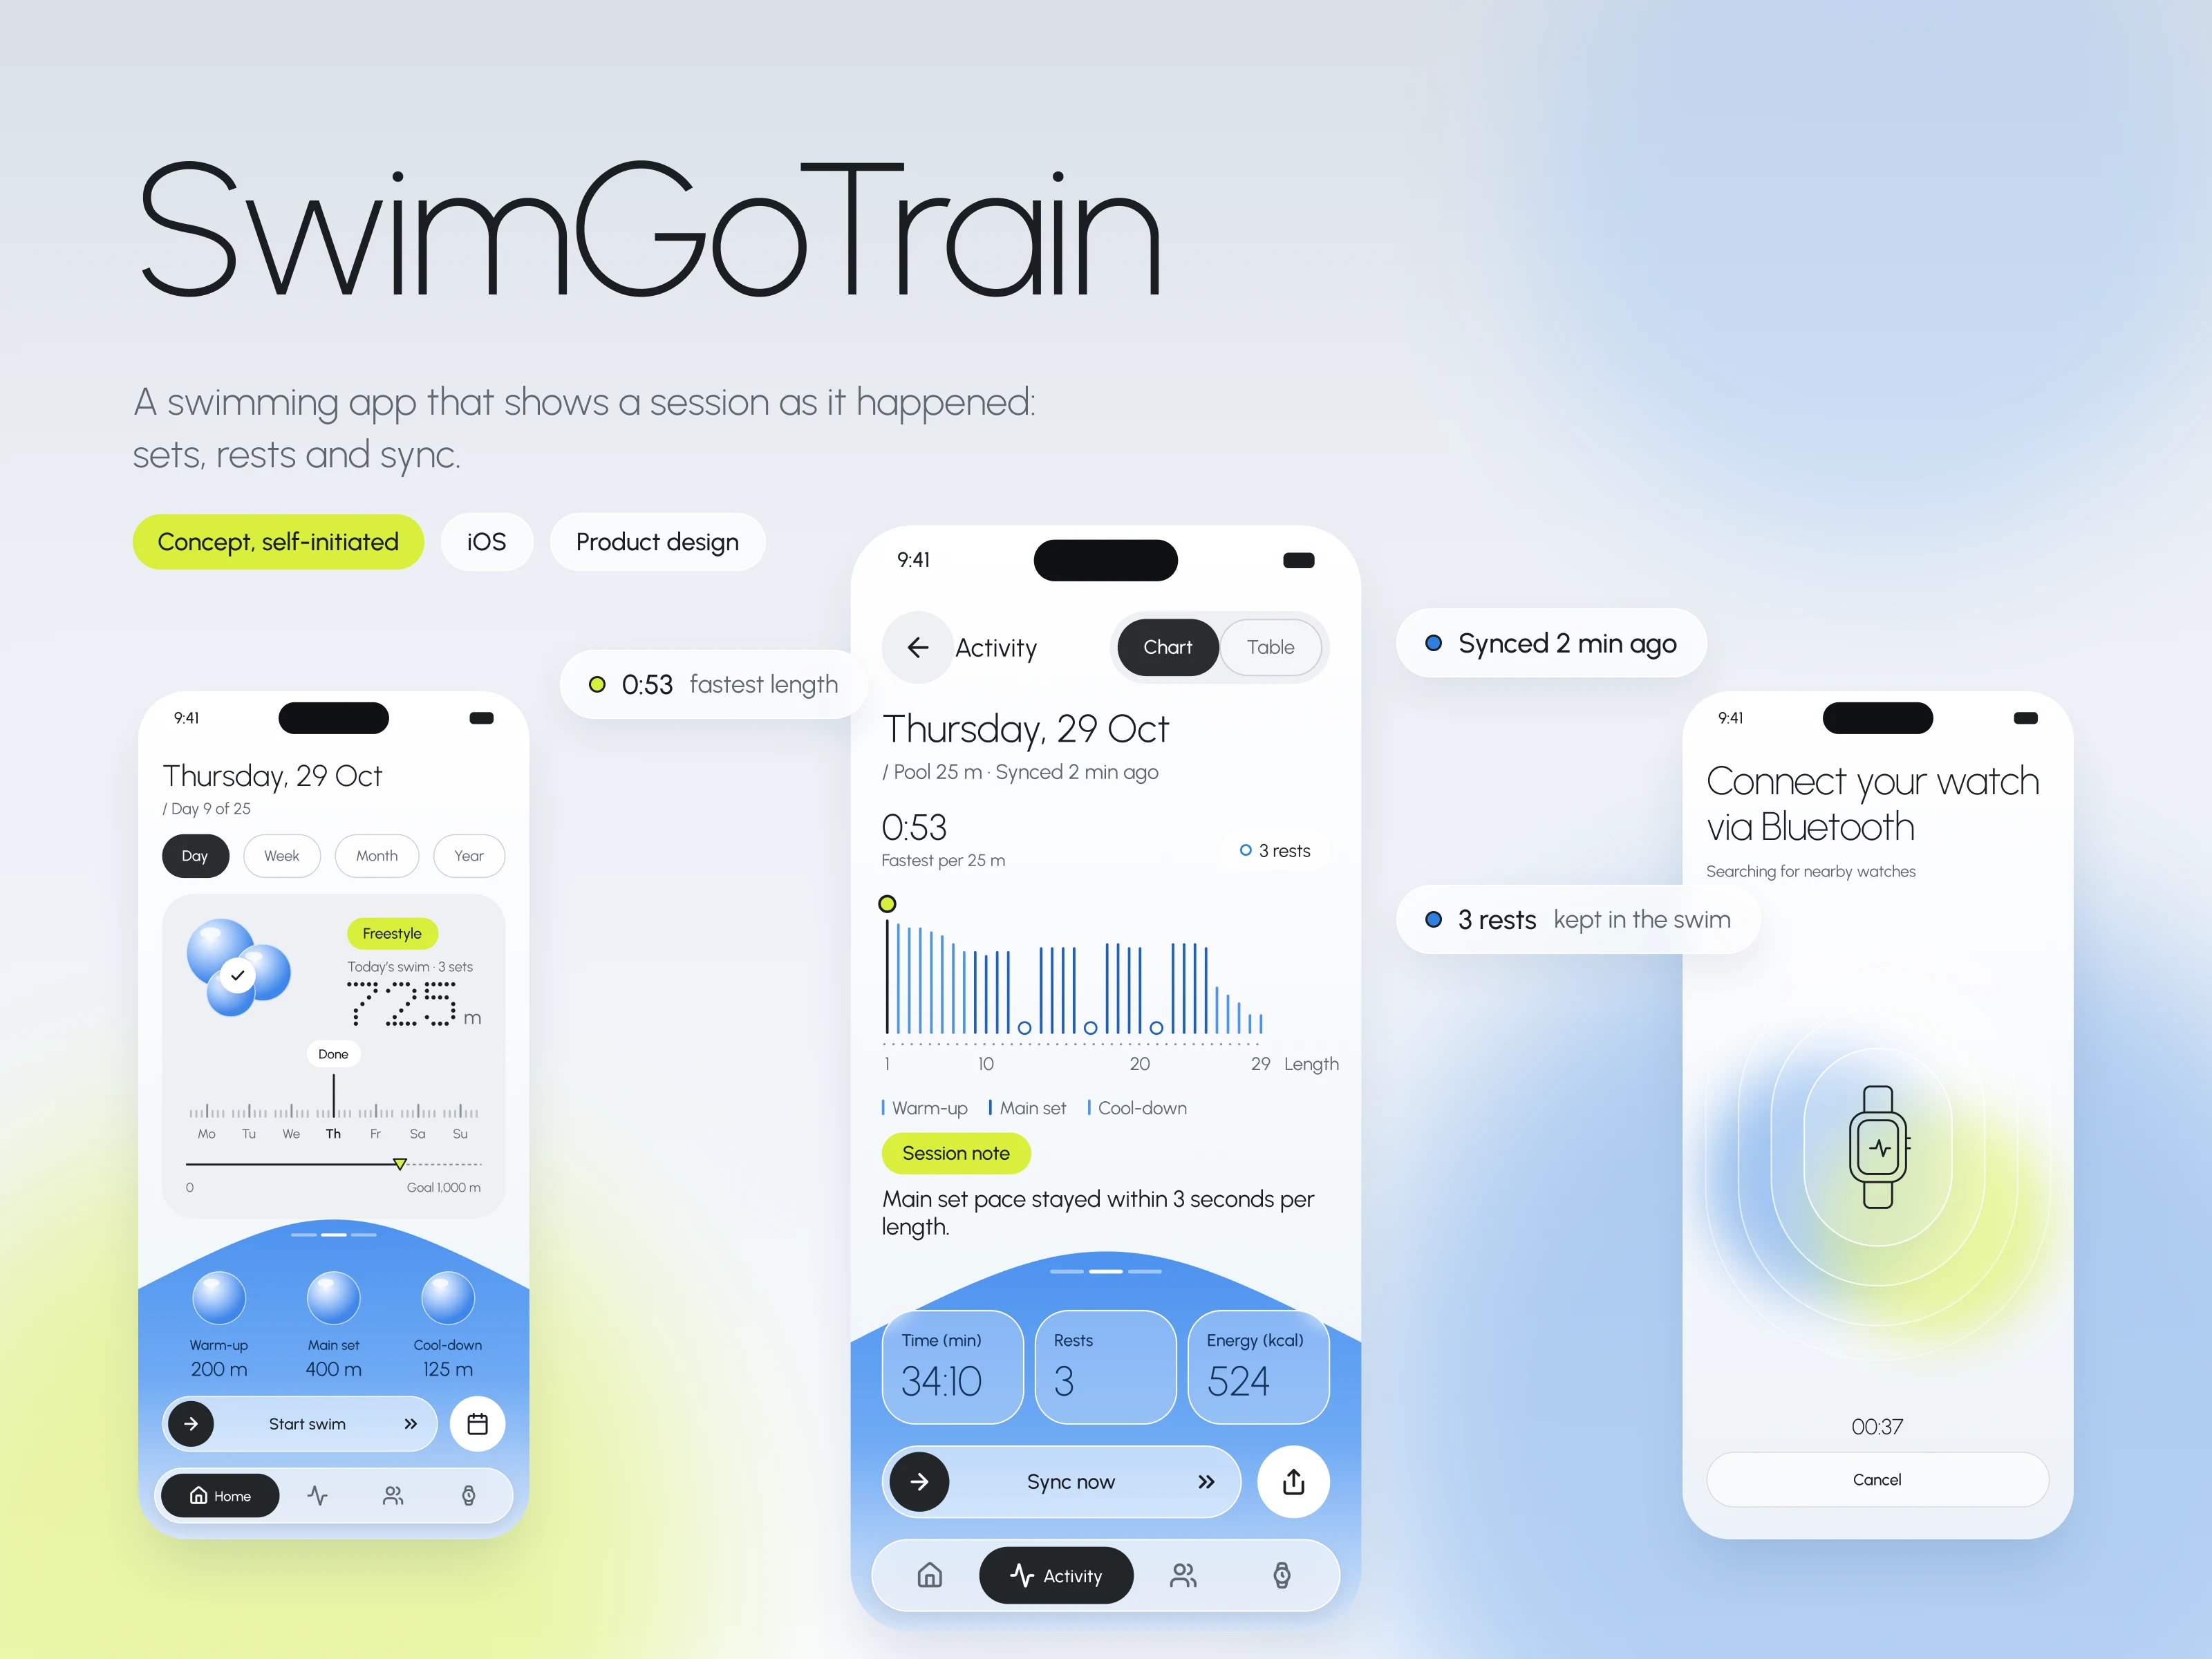
An iOS swimming app that treats a swim as sets and rests, keeps sync status in view, and gives every empty or broken state a next step.
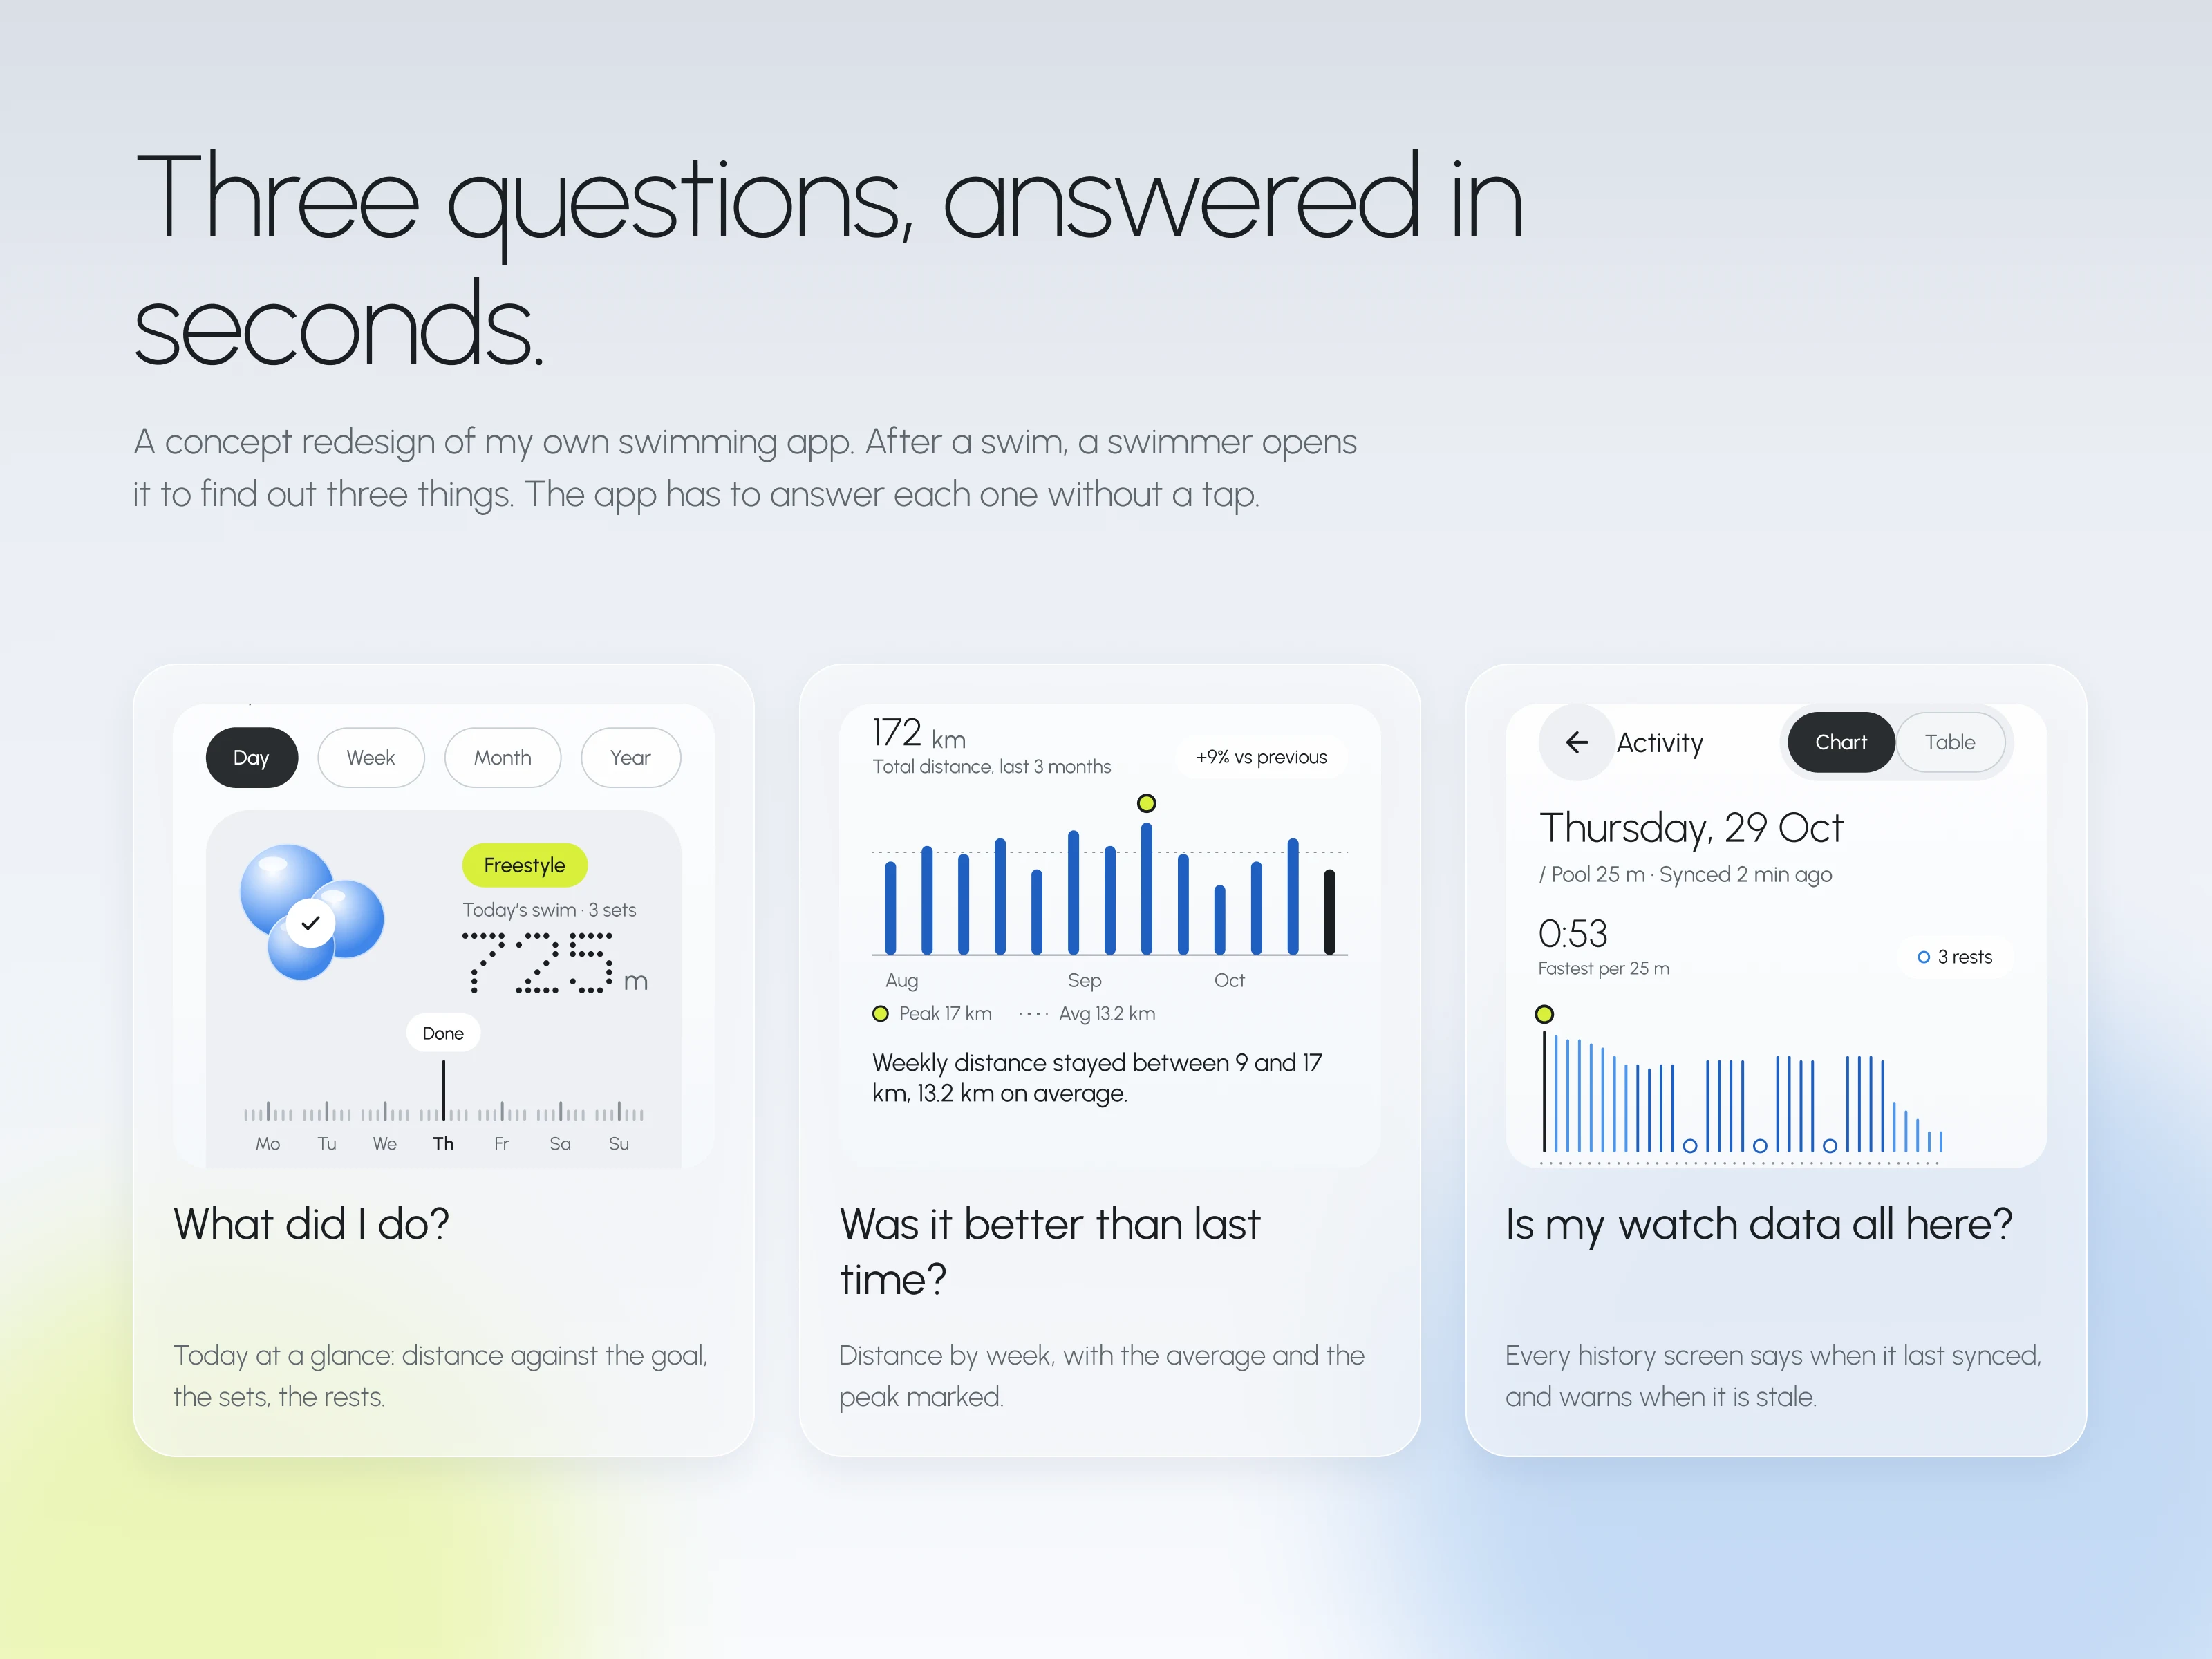
A swimmer should answer three questions within seconds of opening the app. What did I do? Was it better than last time? Is my watch data all here?
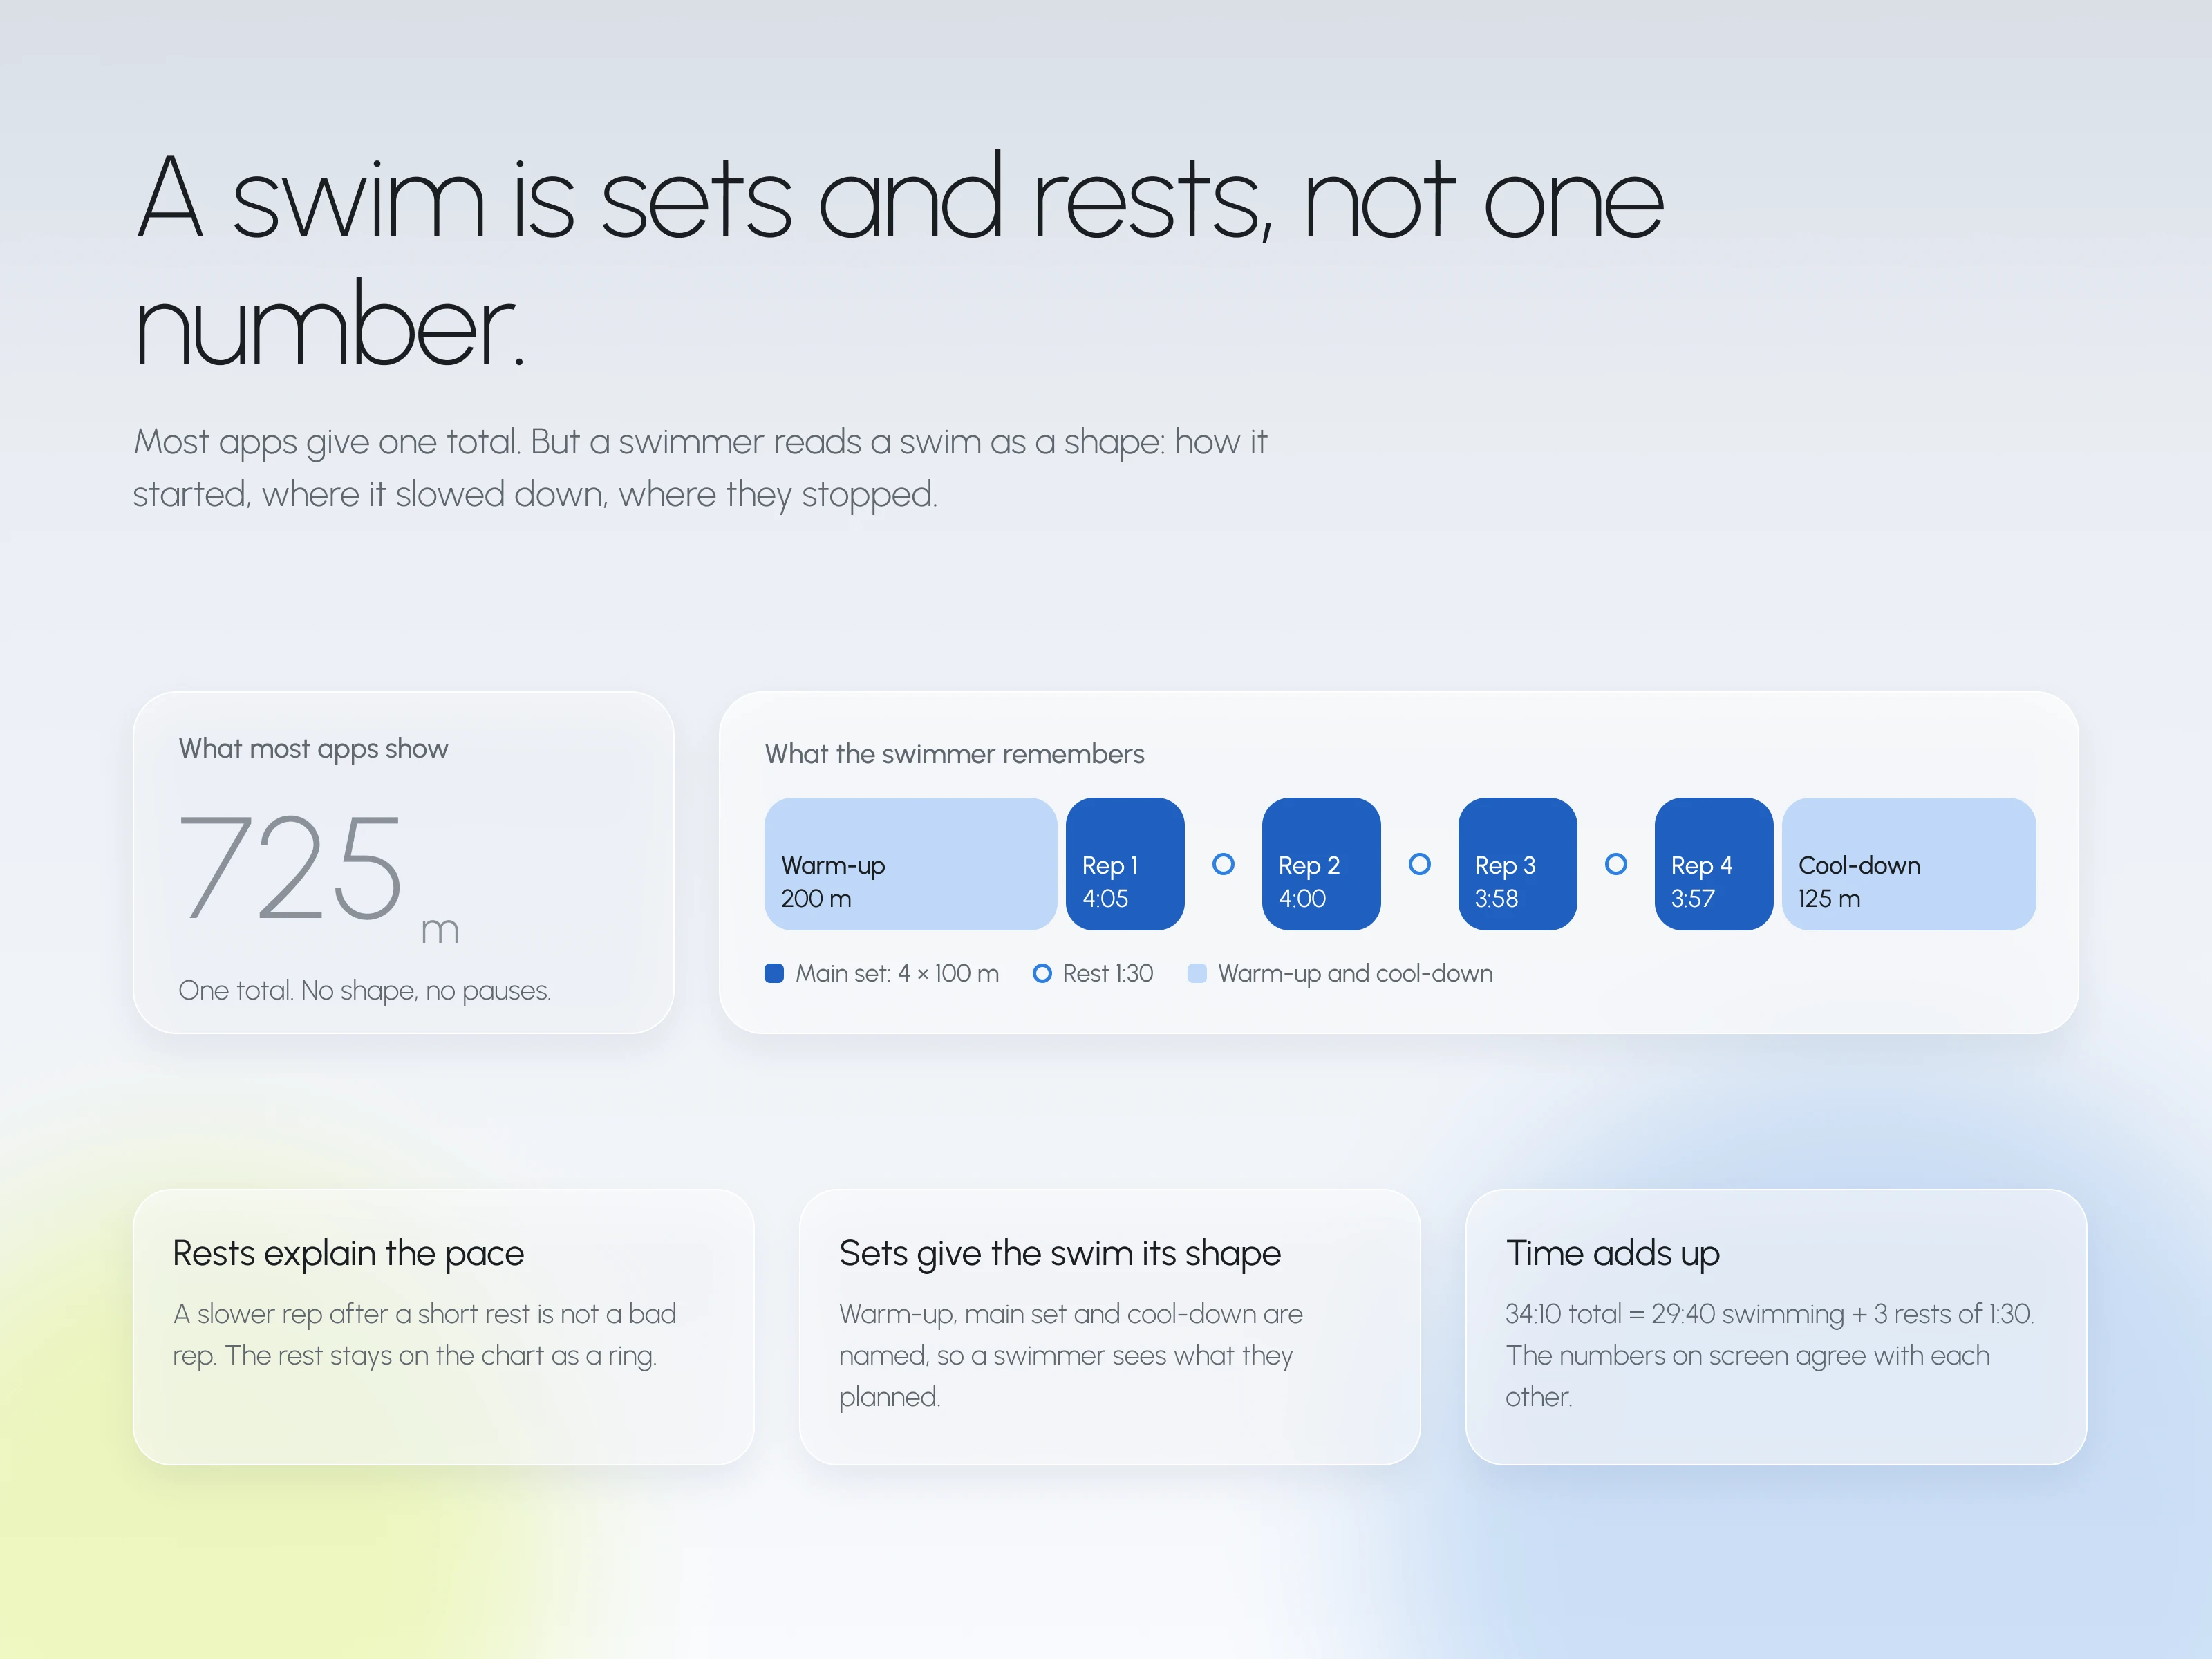
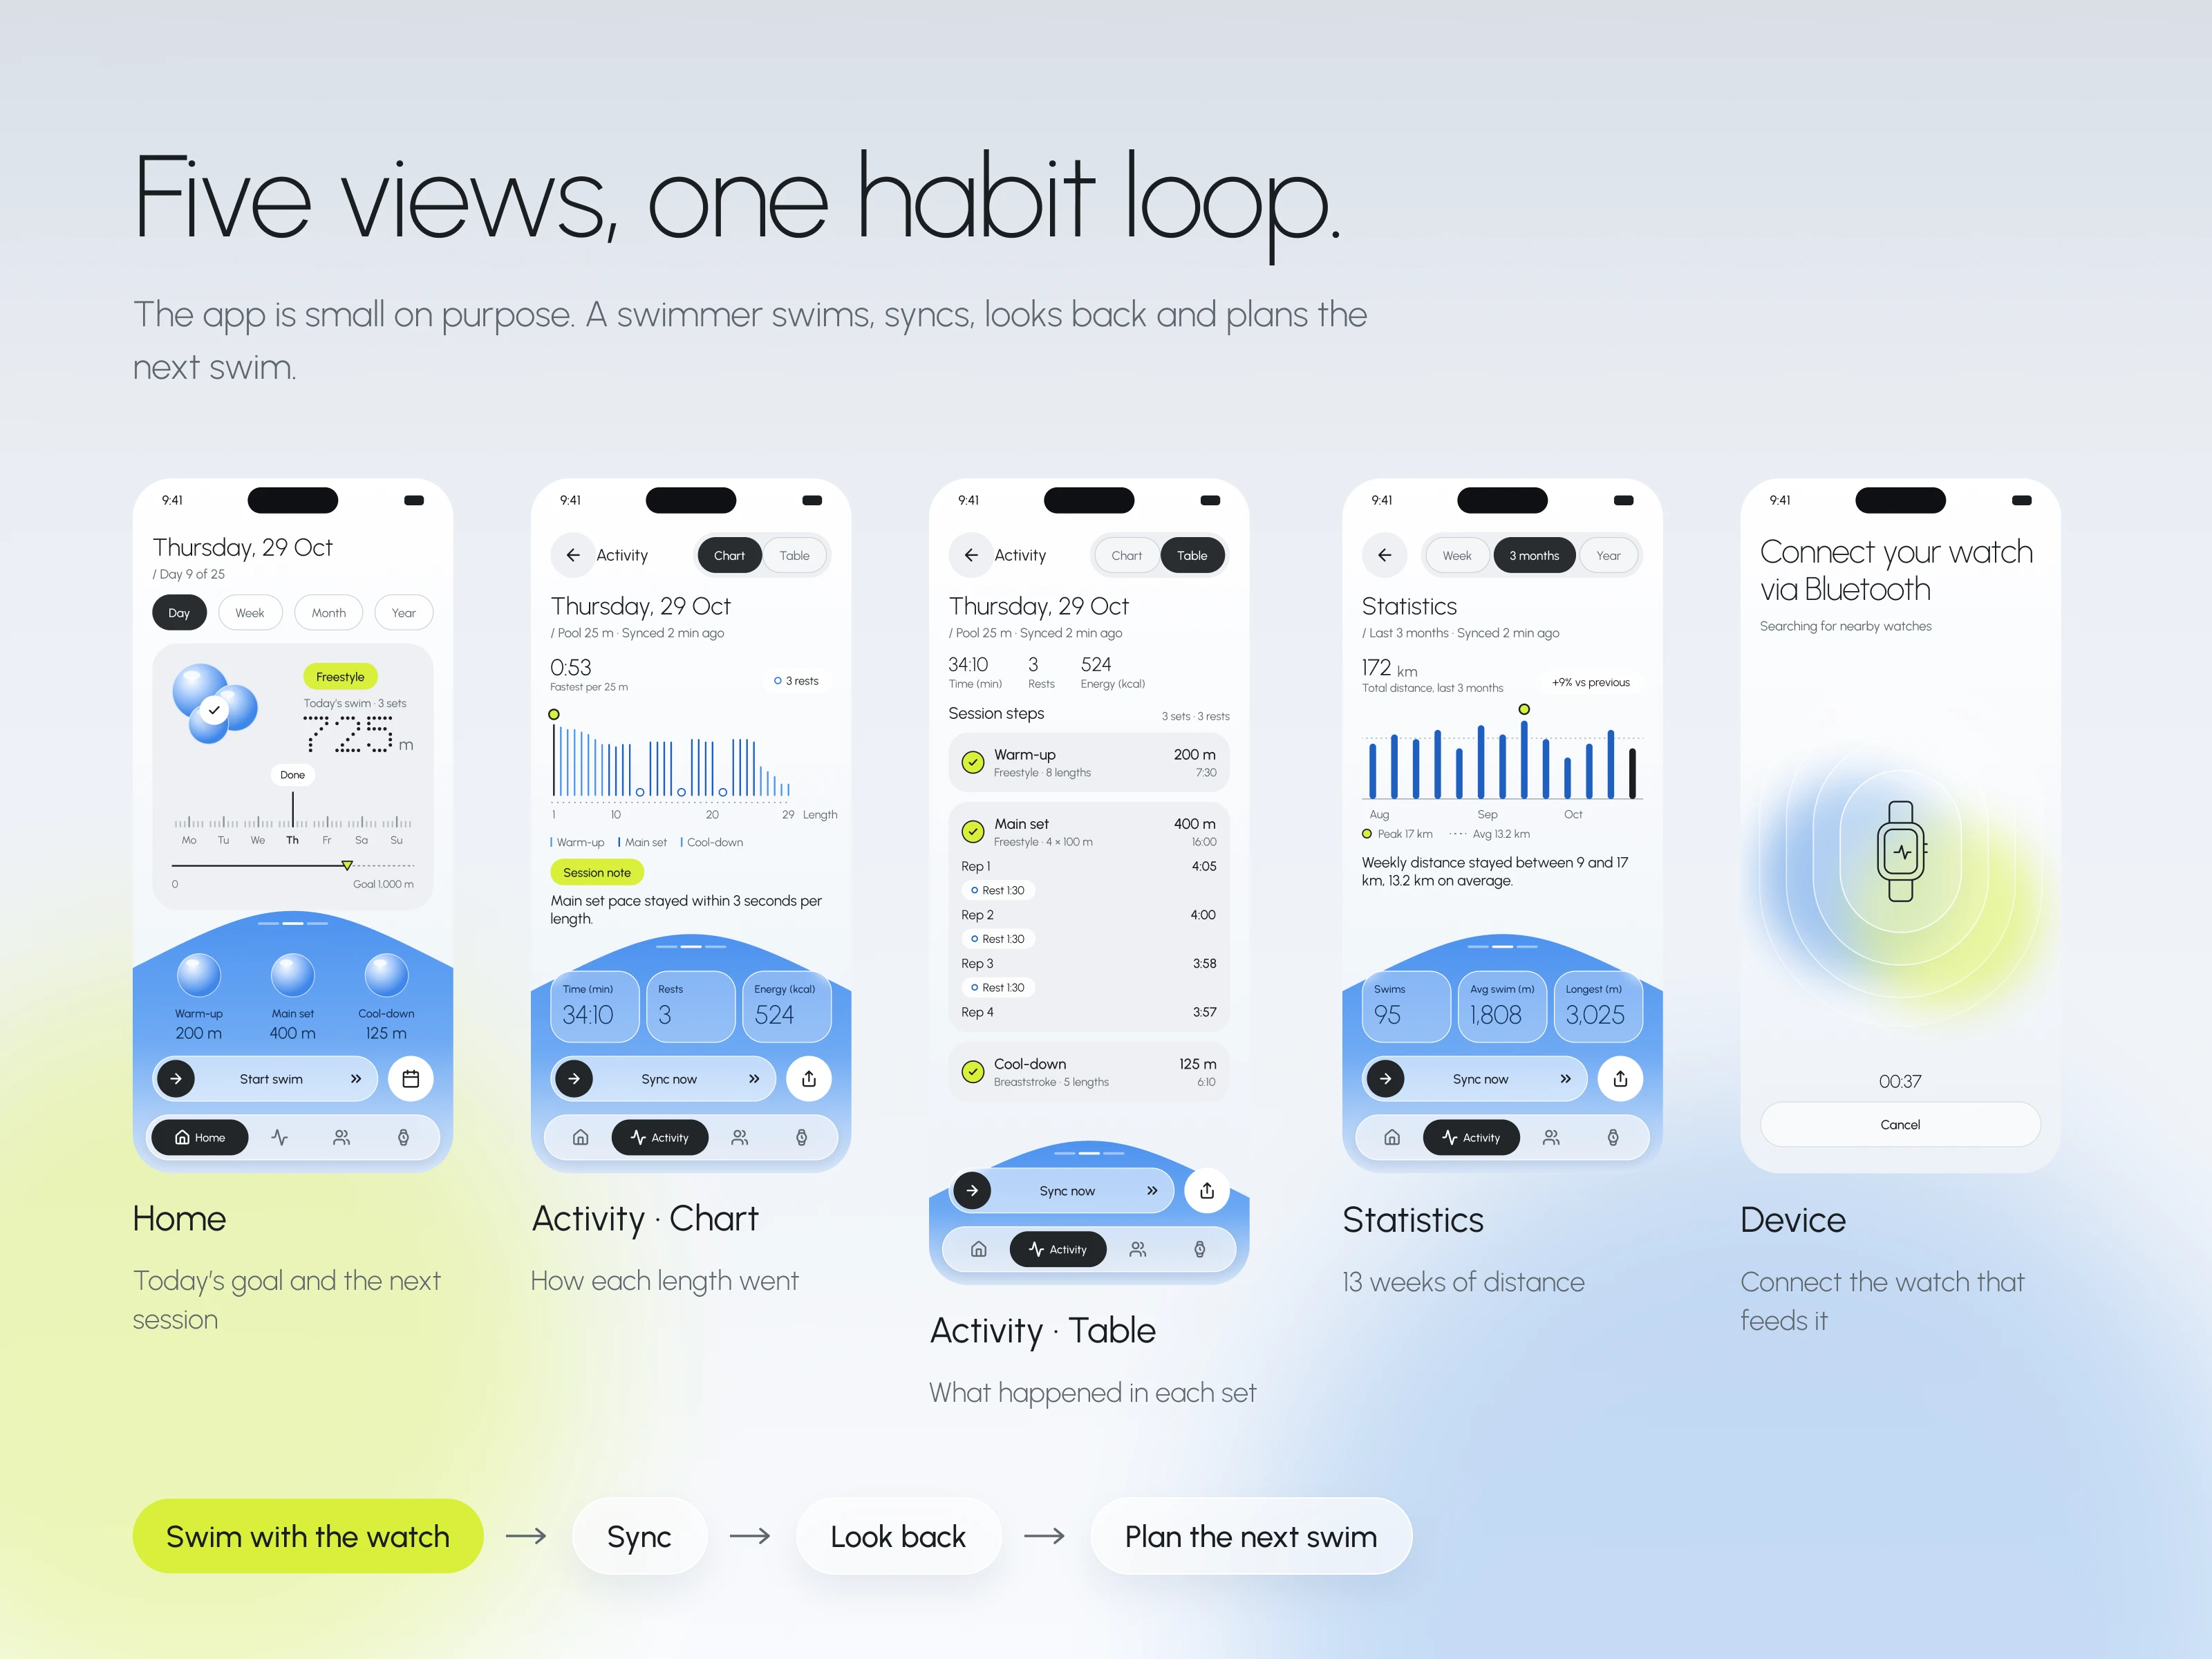
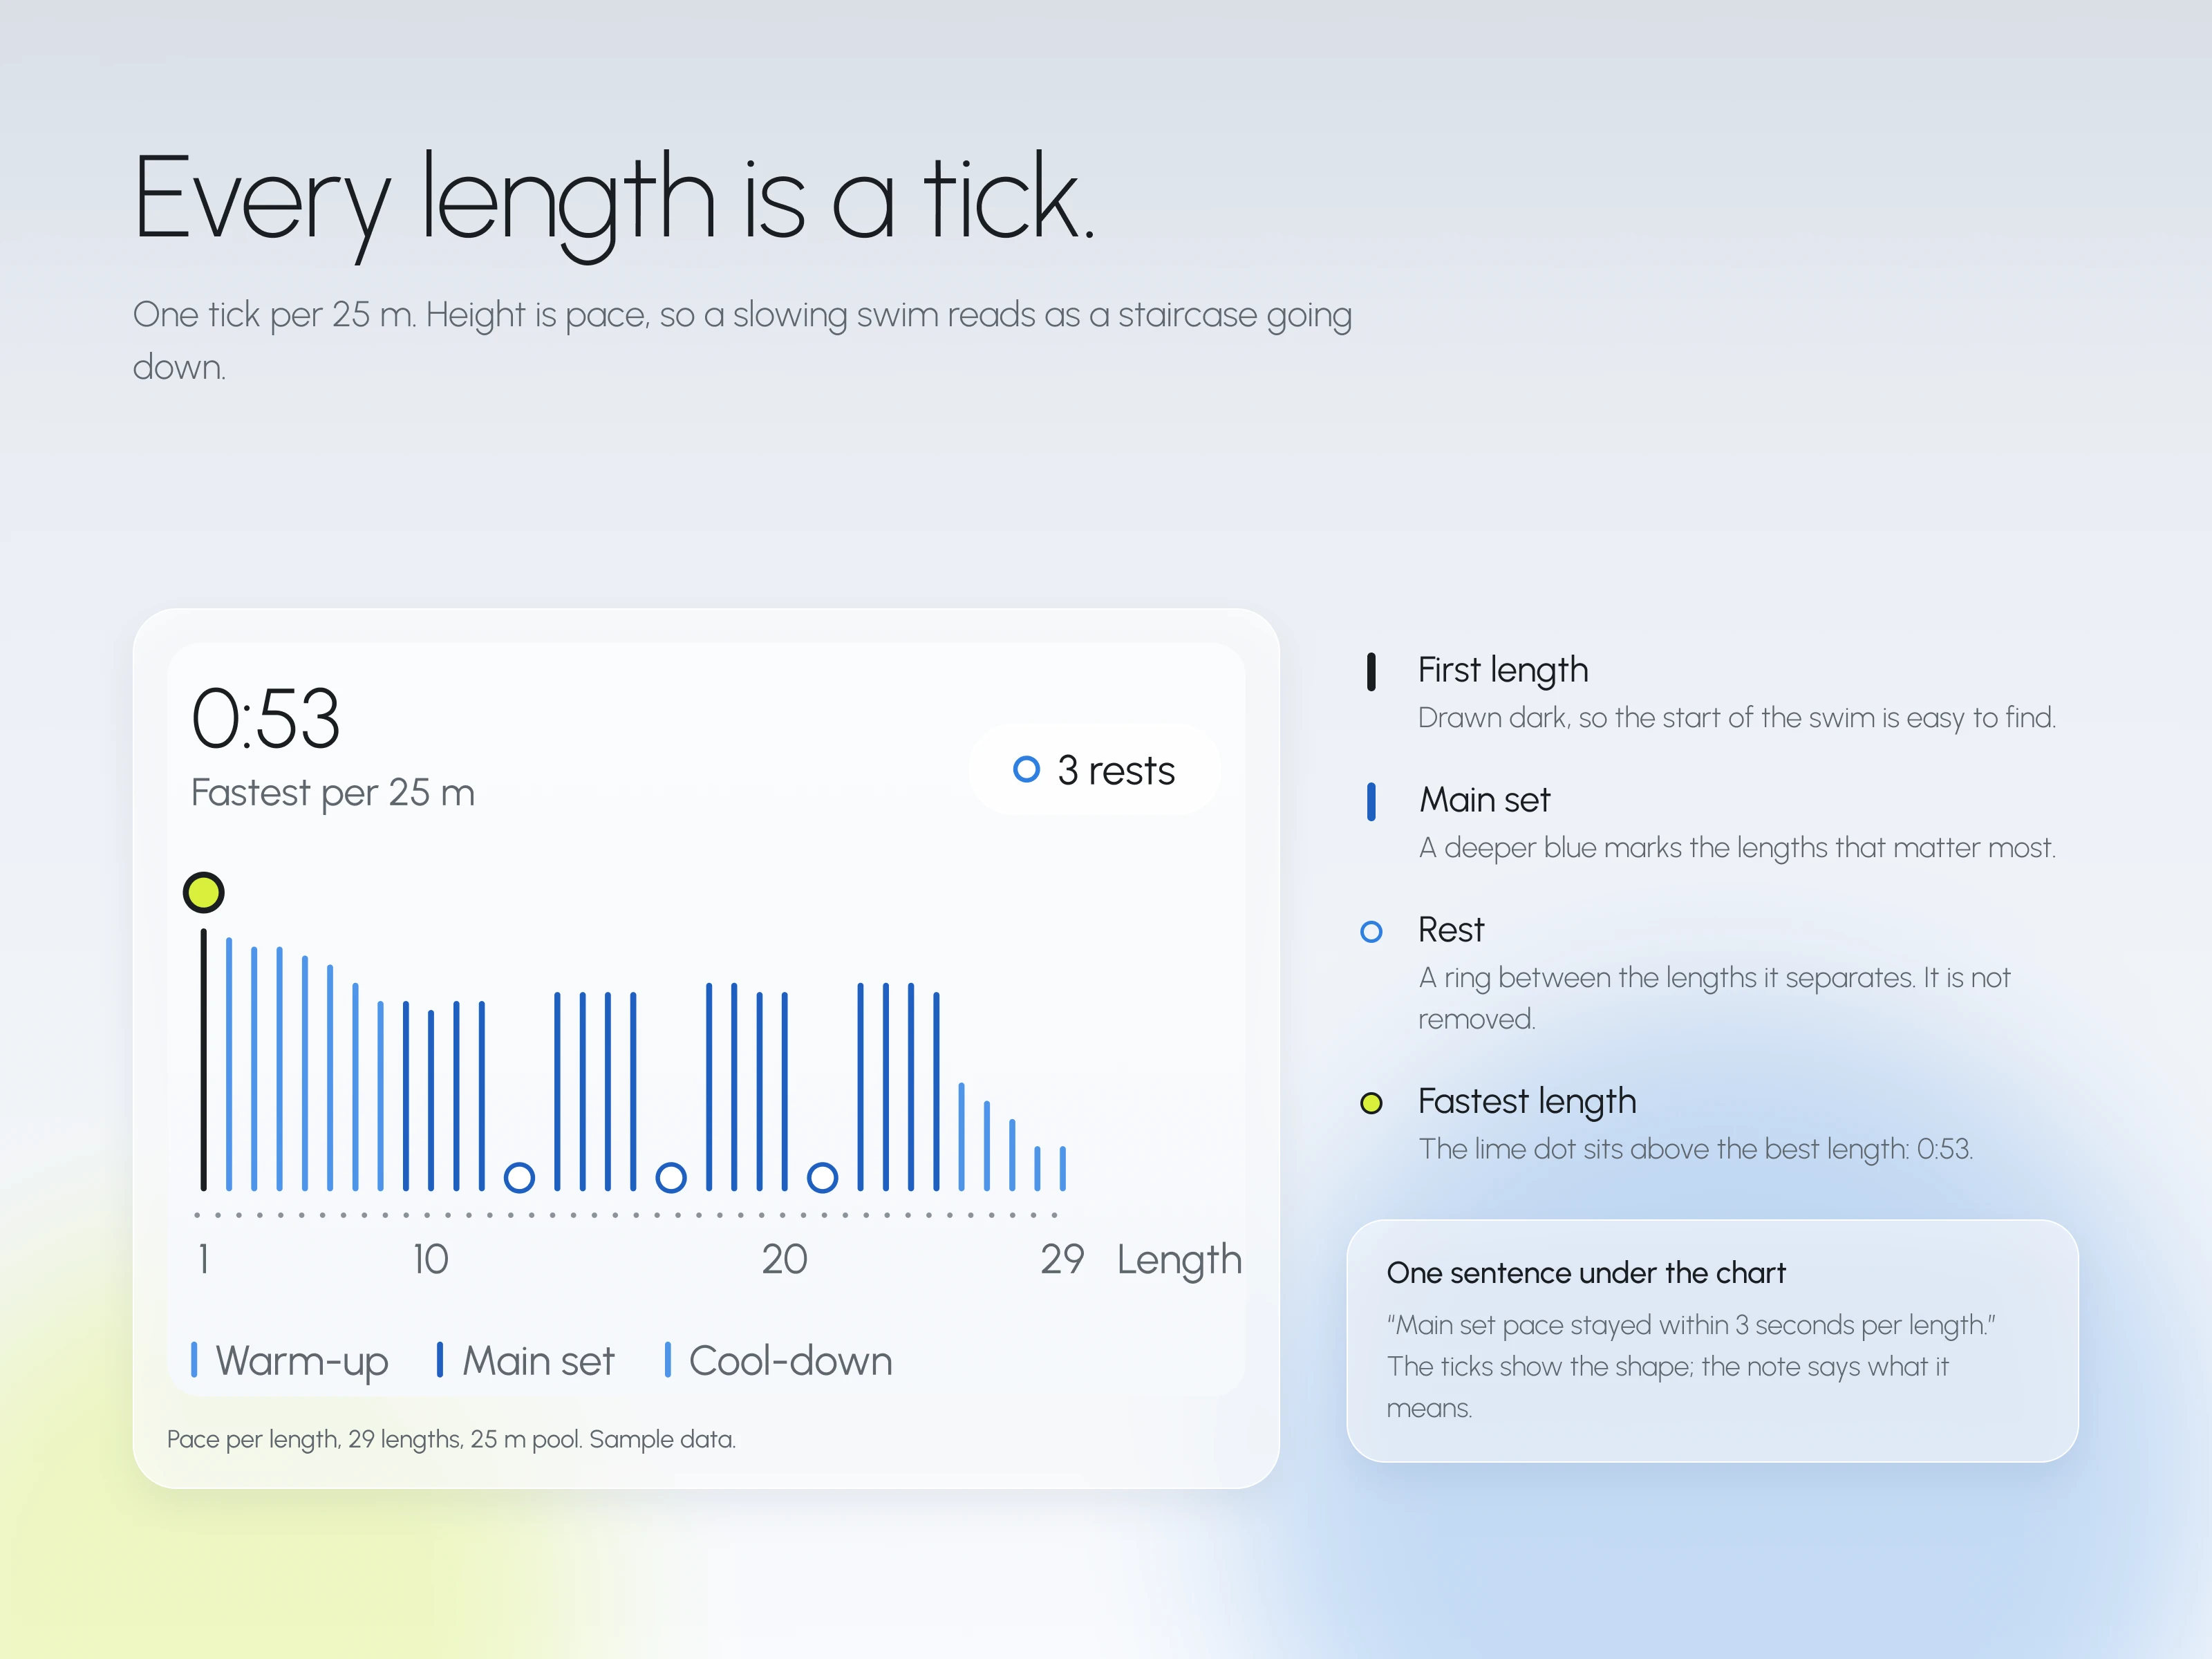
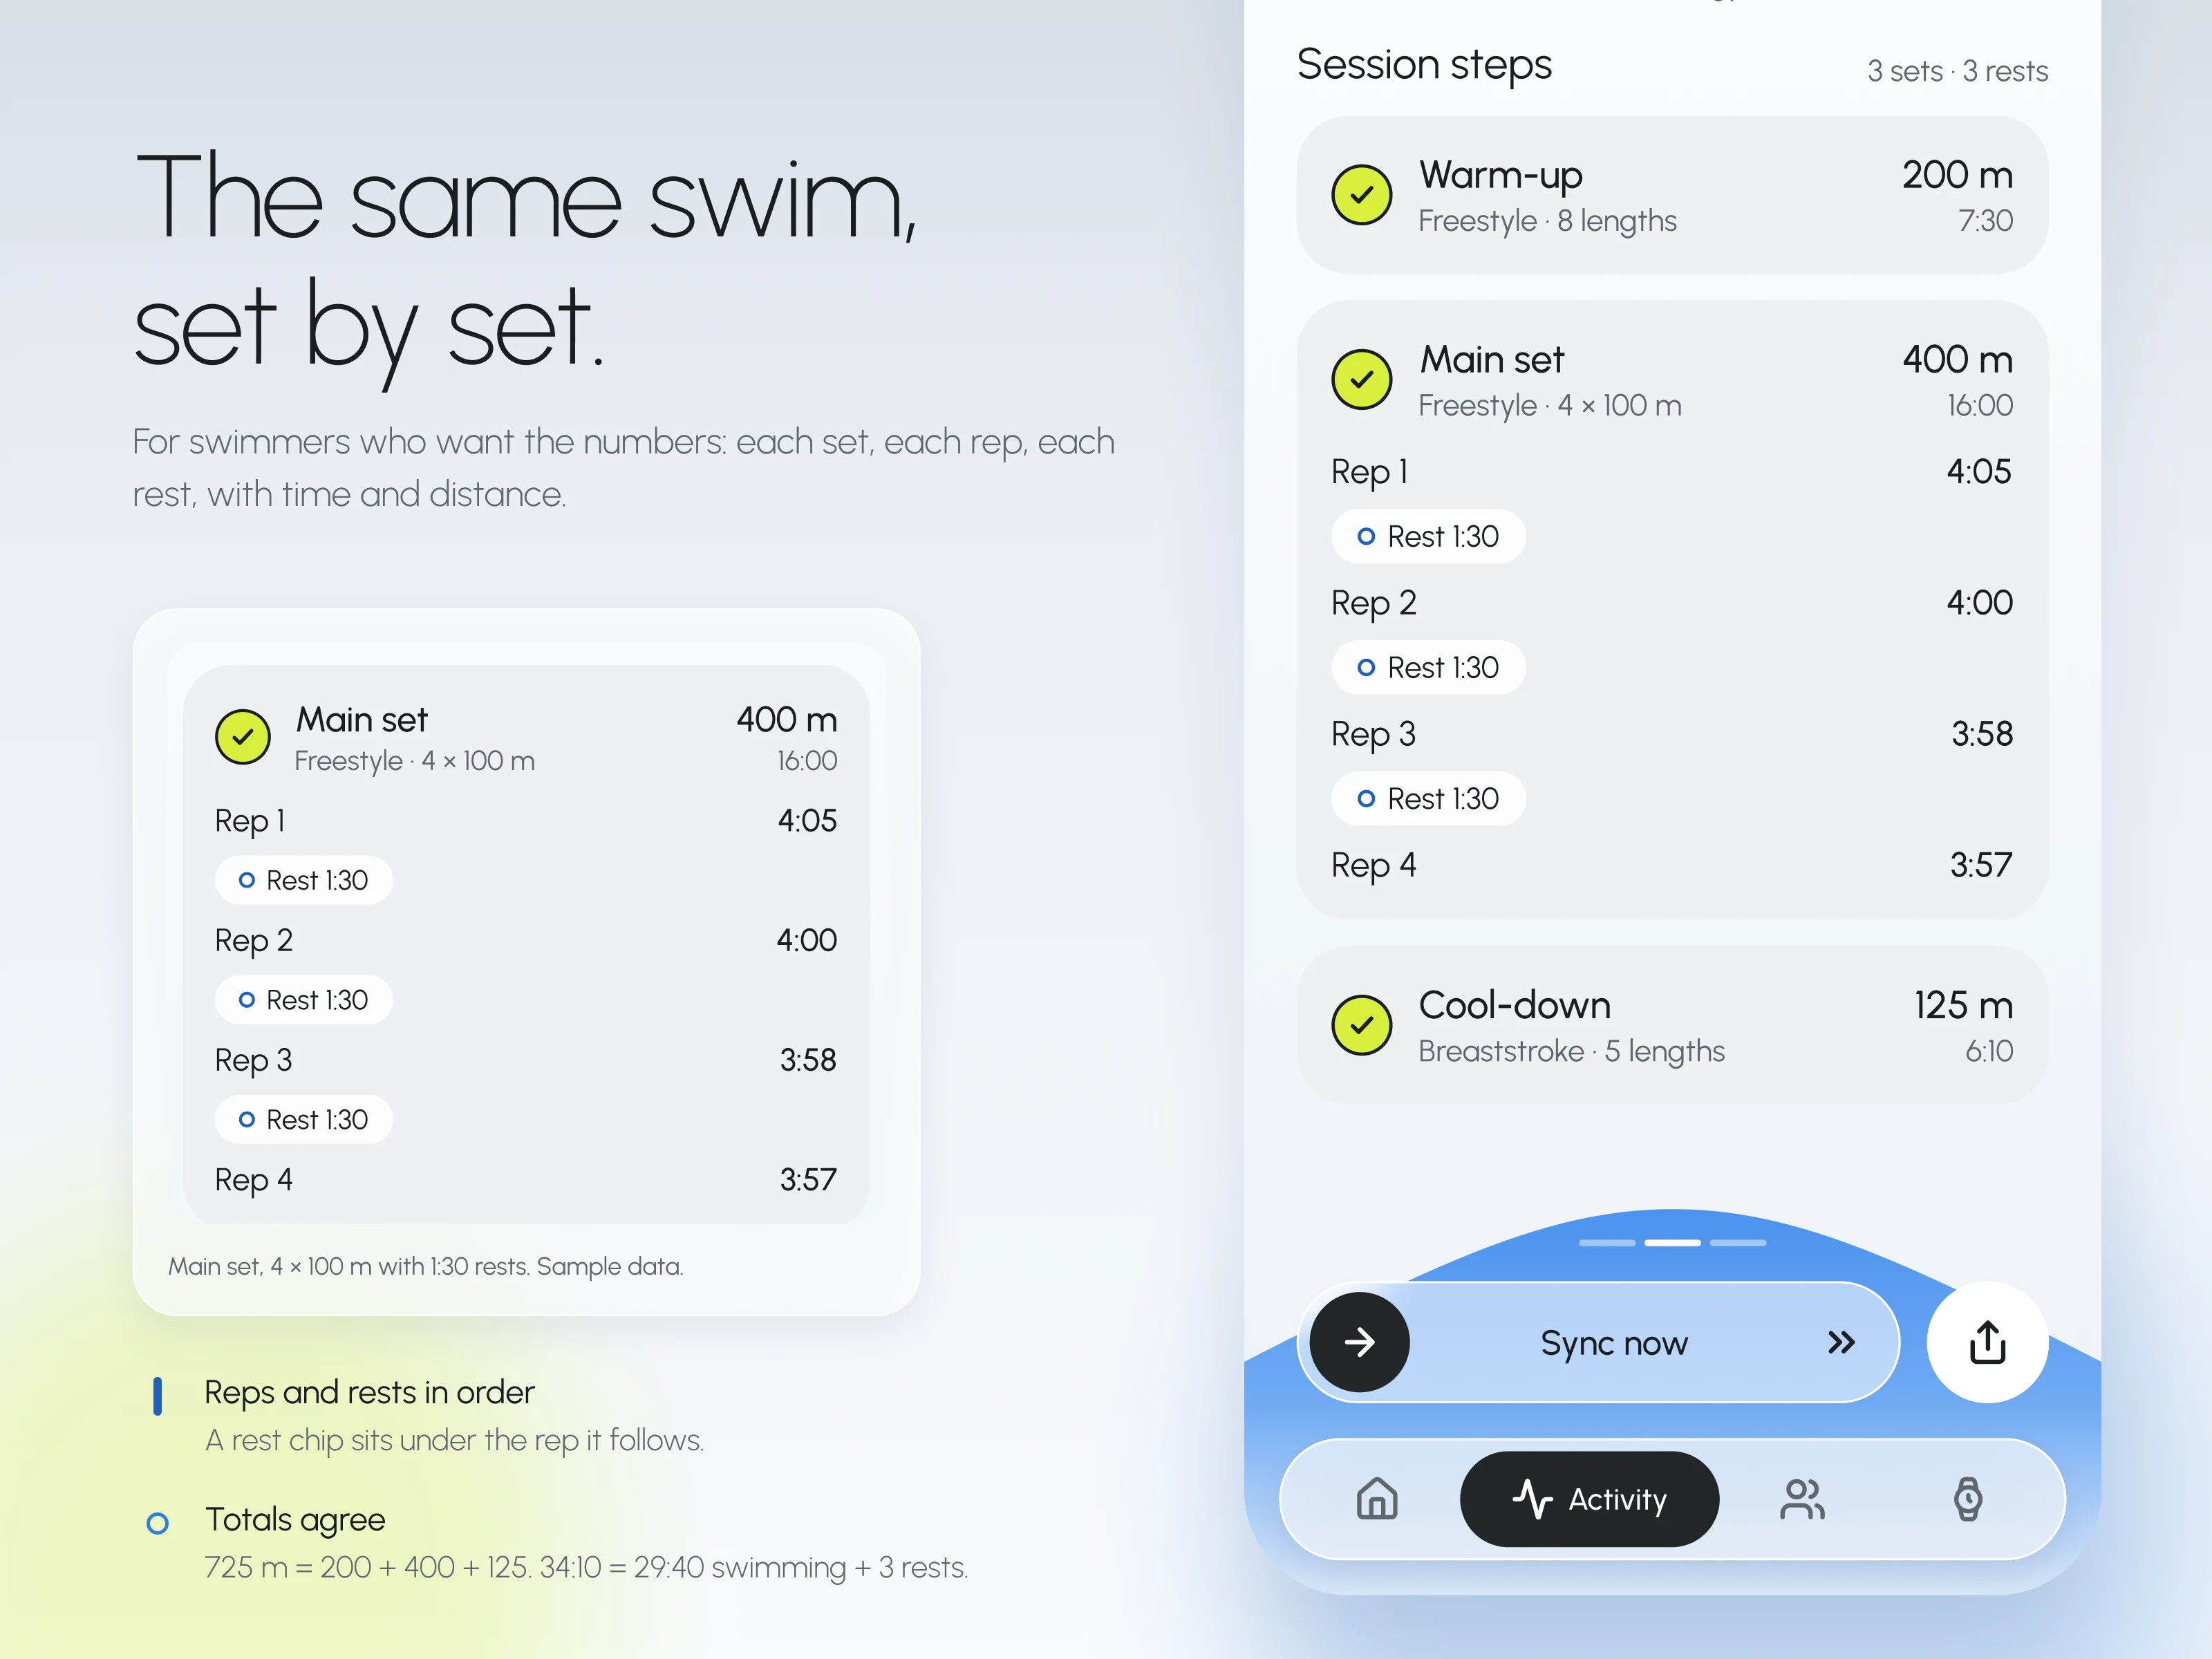
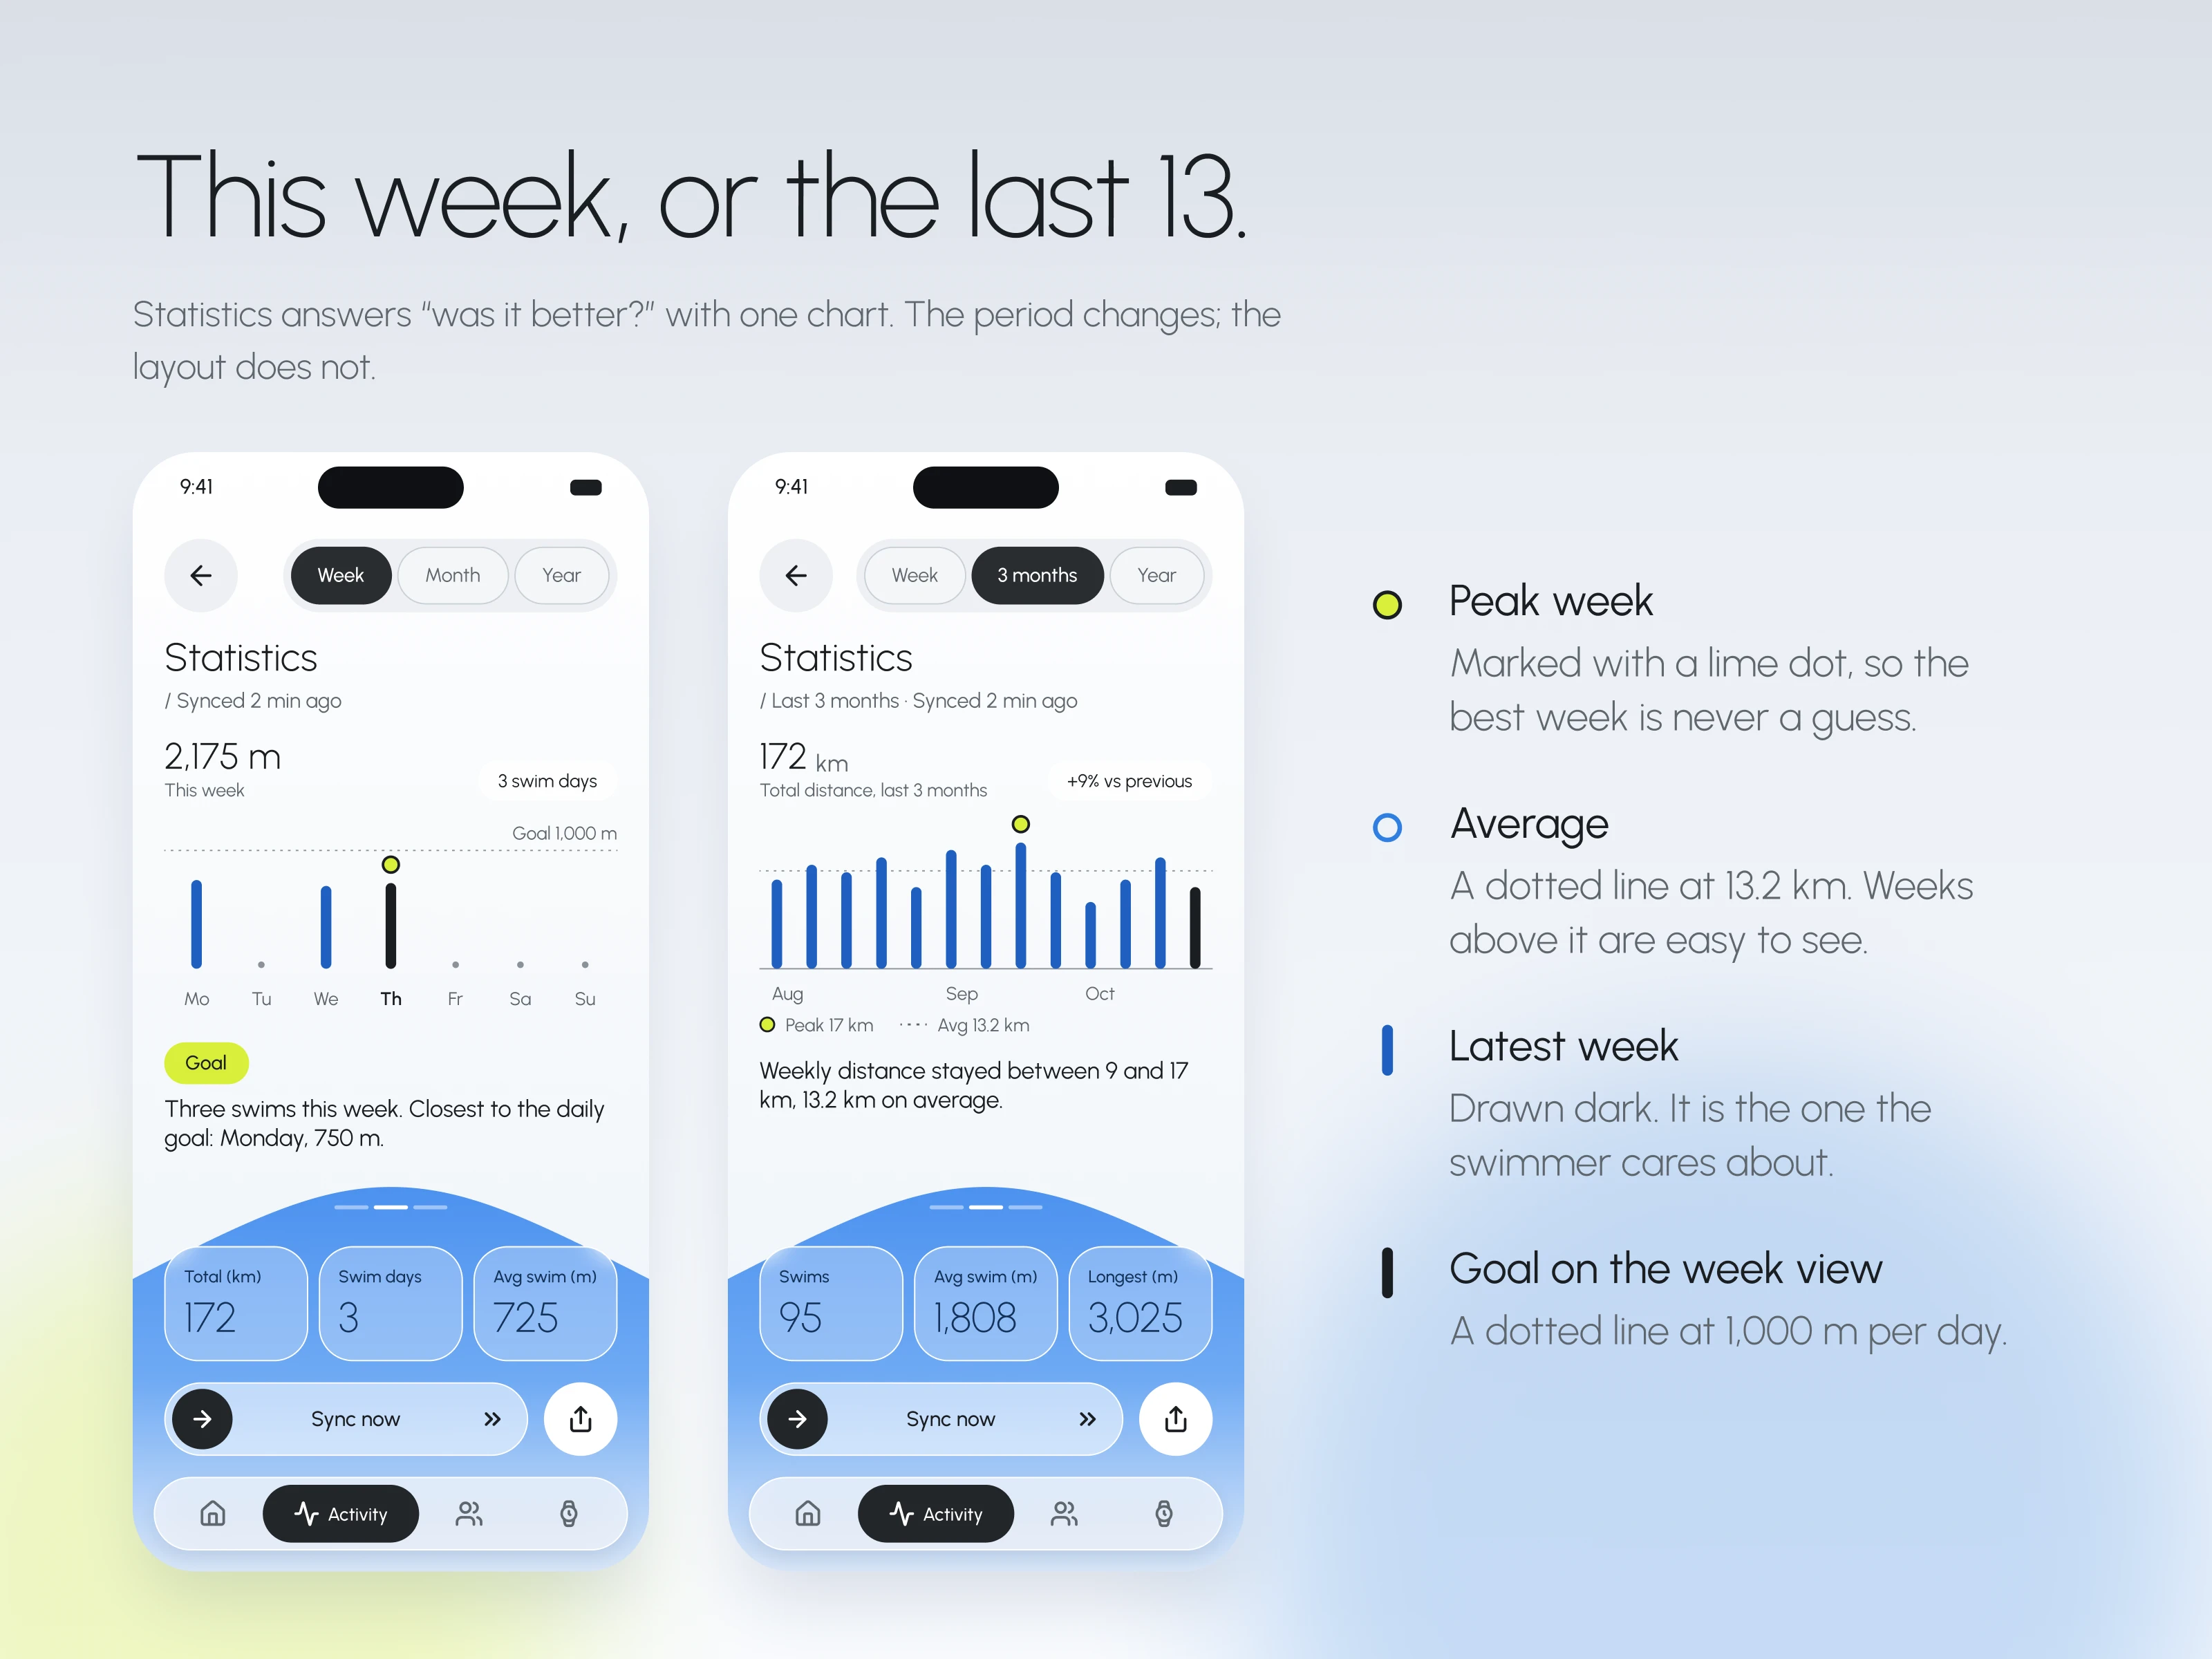
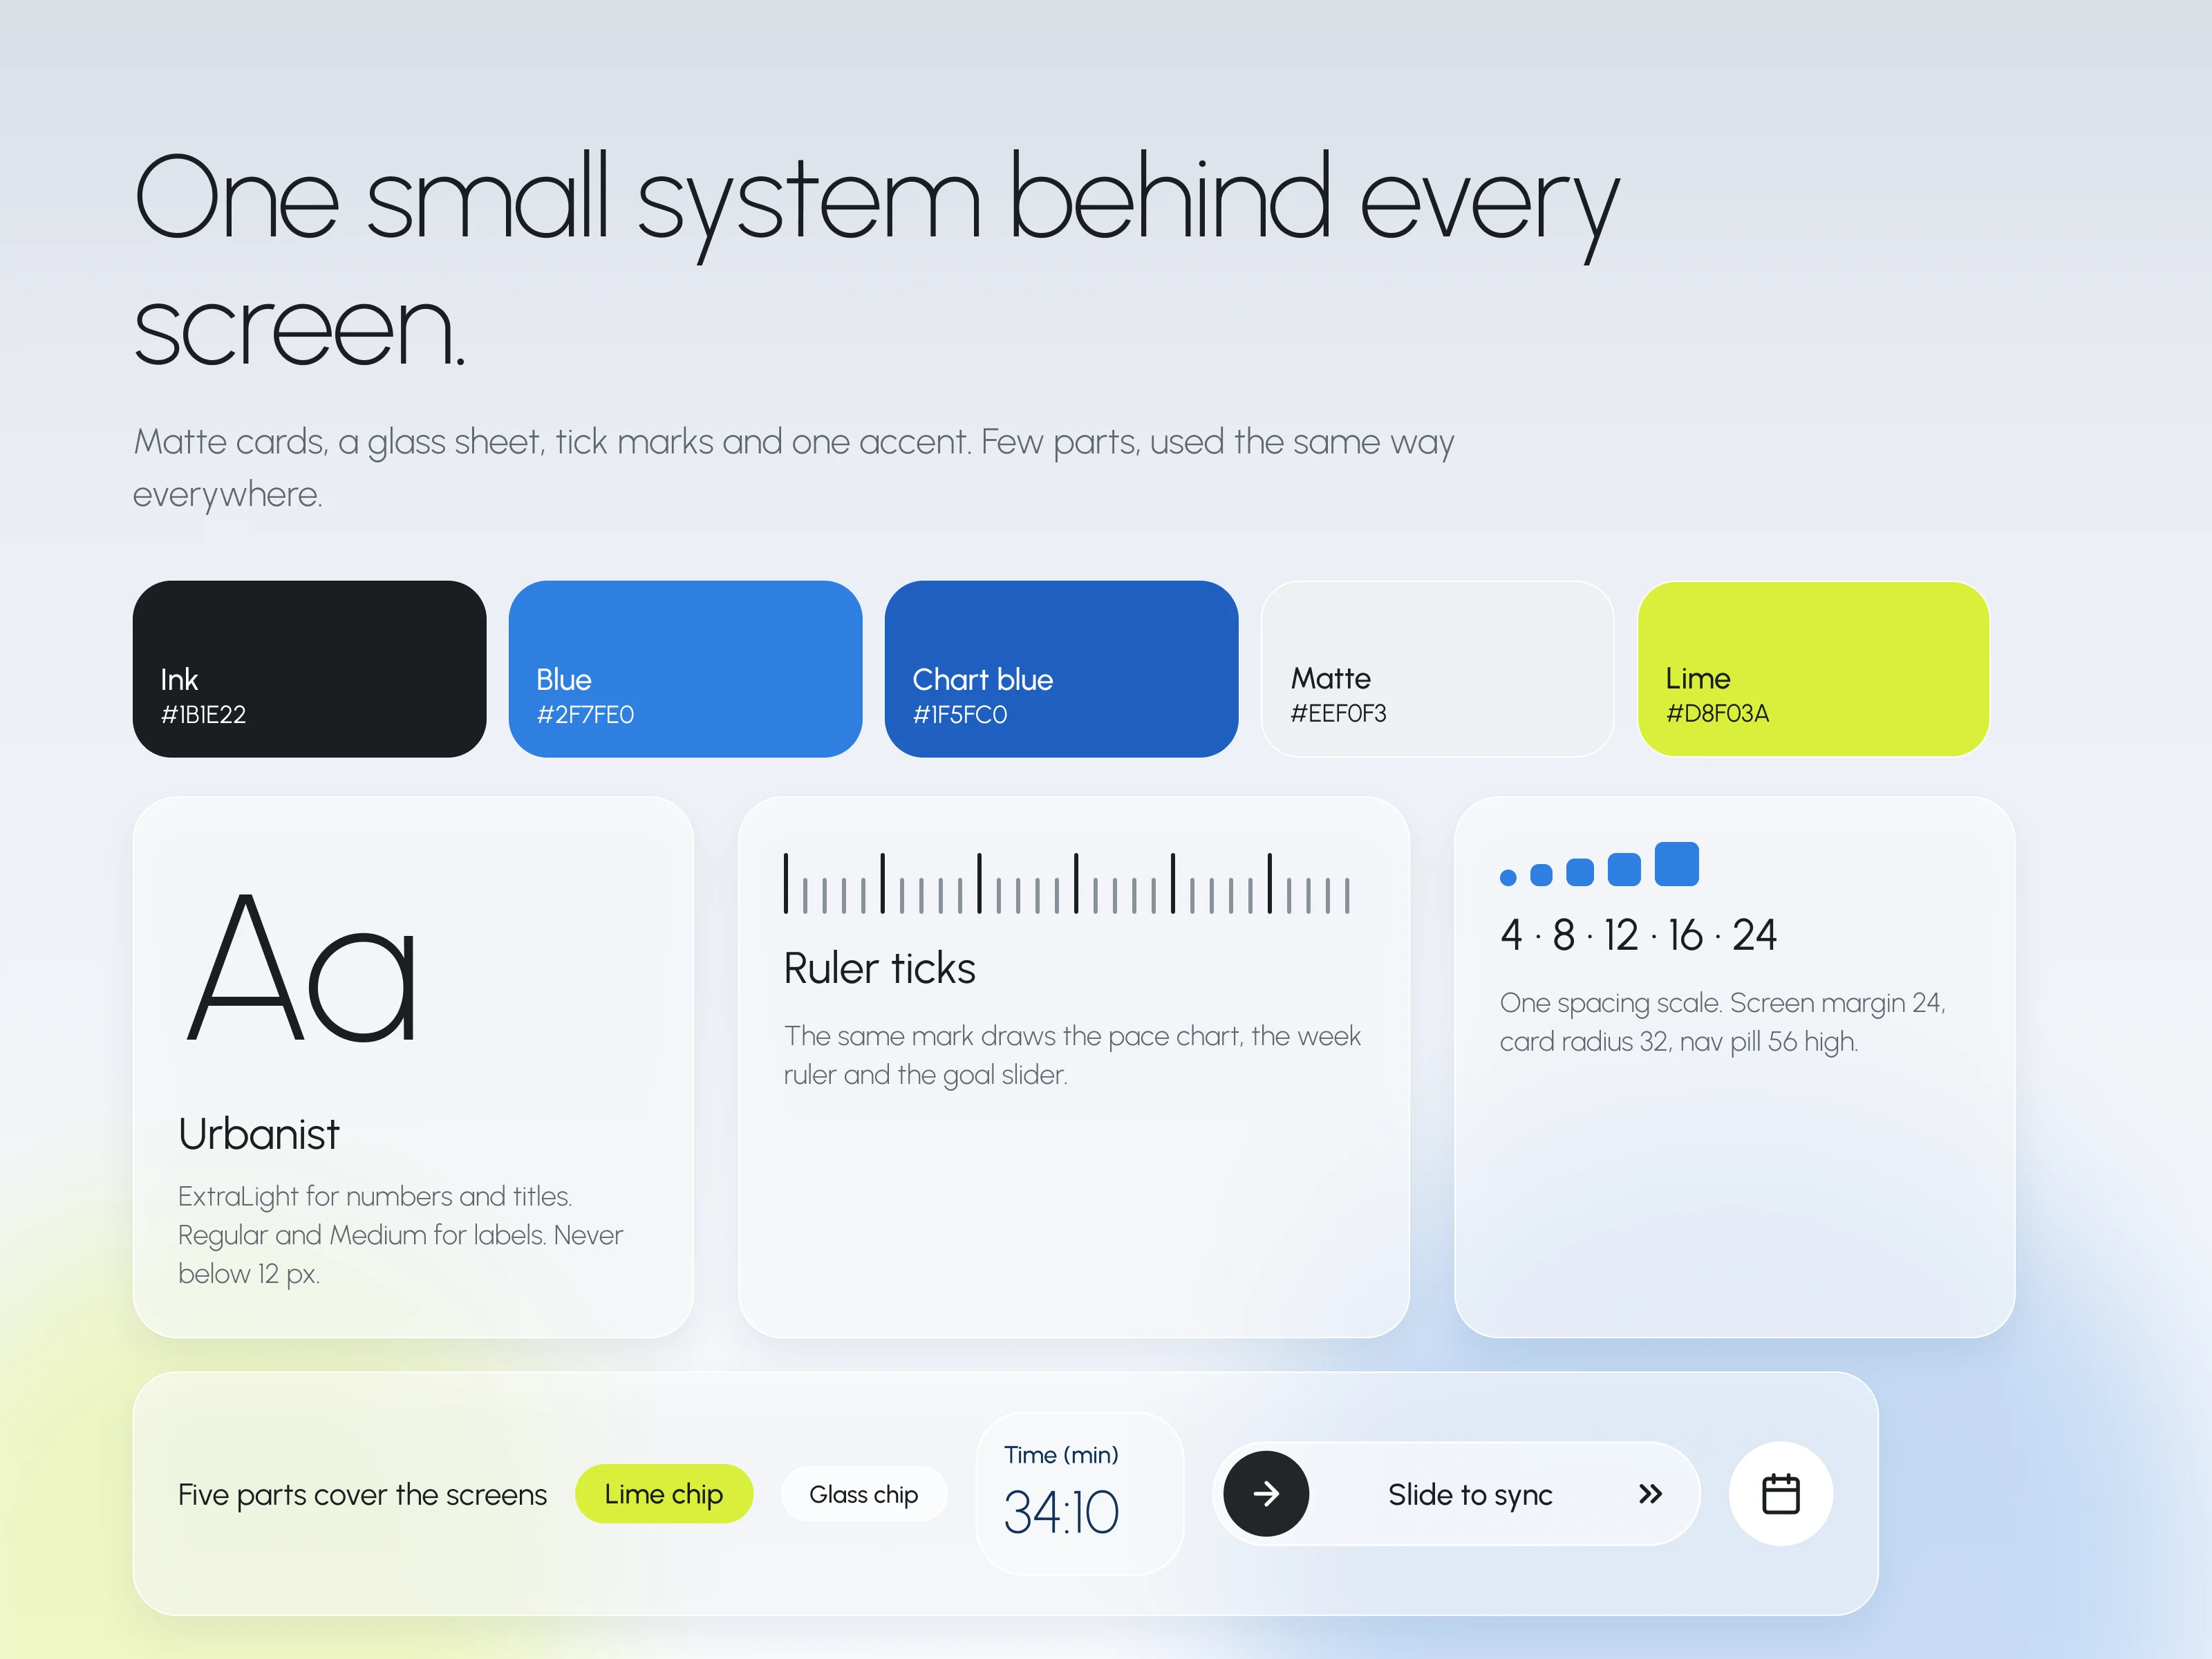
The app has five views: Home (today's goal and the next session), Activity as a chart, Activity as a table, Statistics, and Device. Activity shows one swim in two ways. The chart gives one tick per 25 m length, so a slowing pace is visible at a glance. The table breaks the same swim into sets, reps and rests for people who want the numbers. Statistics covers a week or the last 13 weeks, with the average drawn as a line and the peak week marked.
Decisions I made and why:
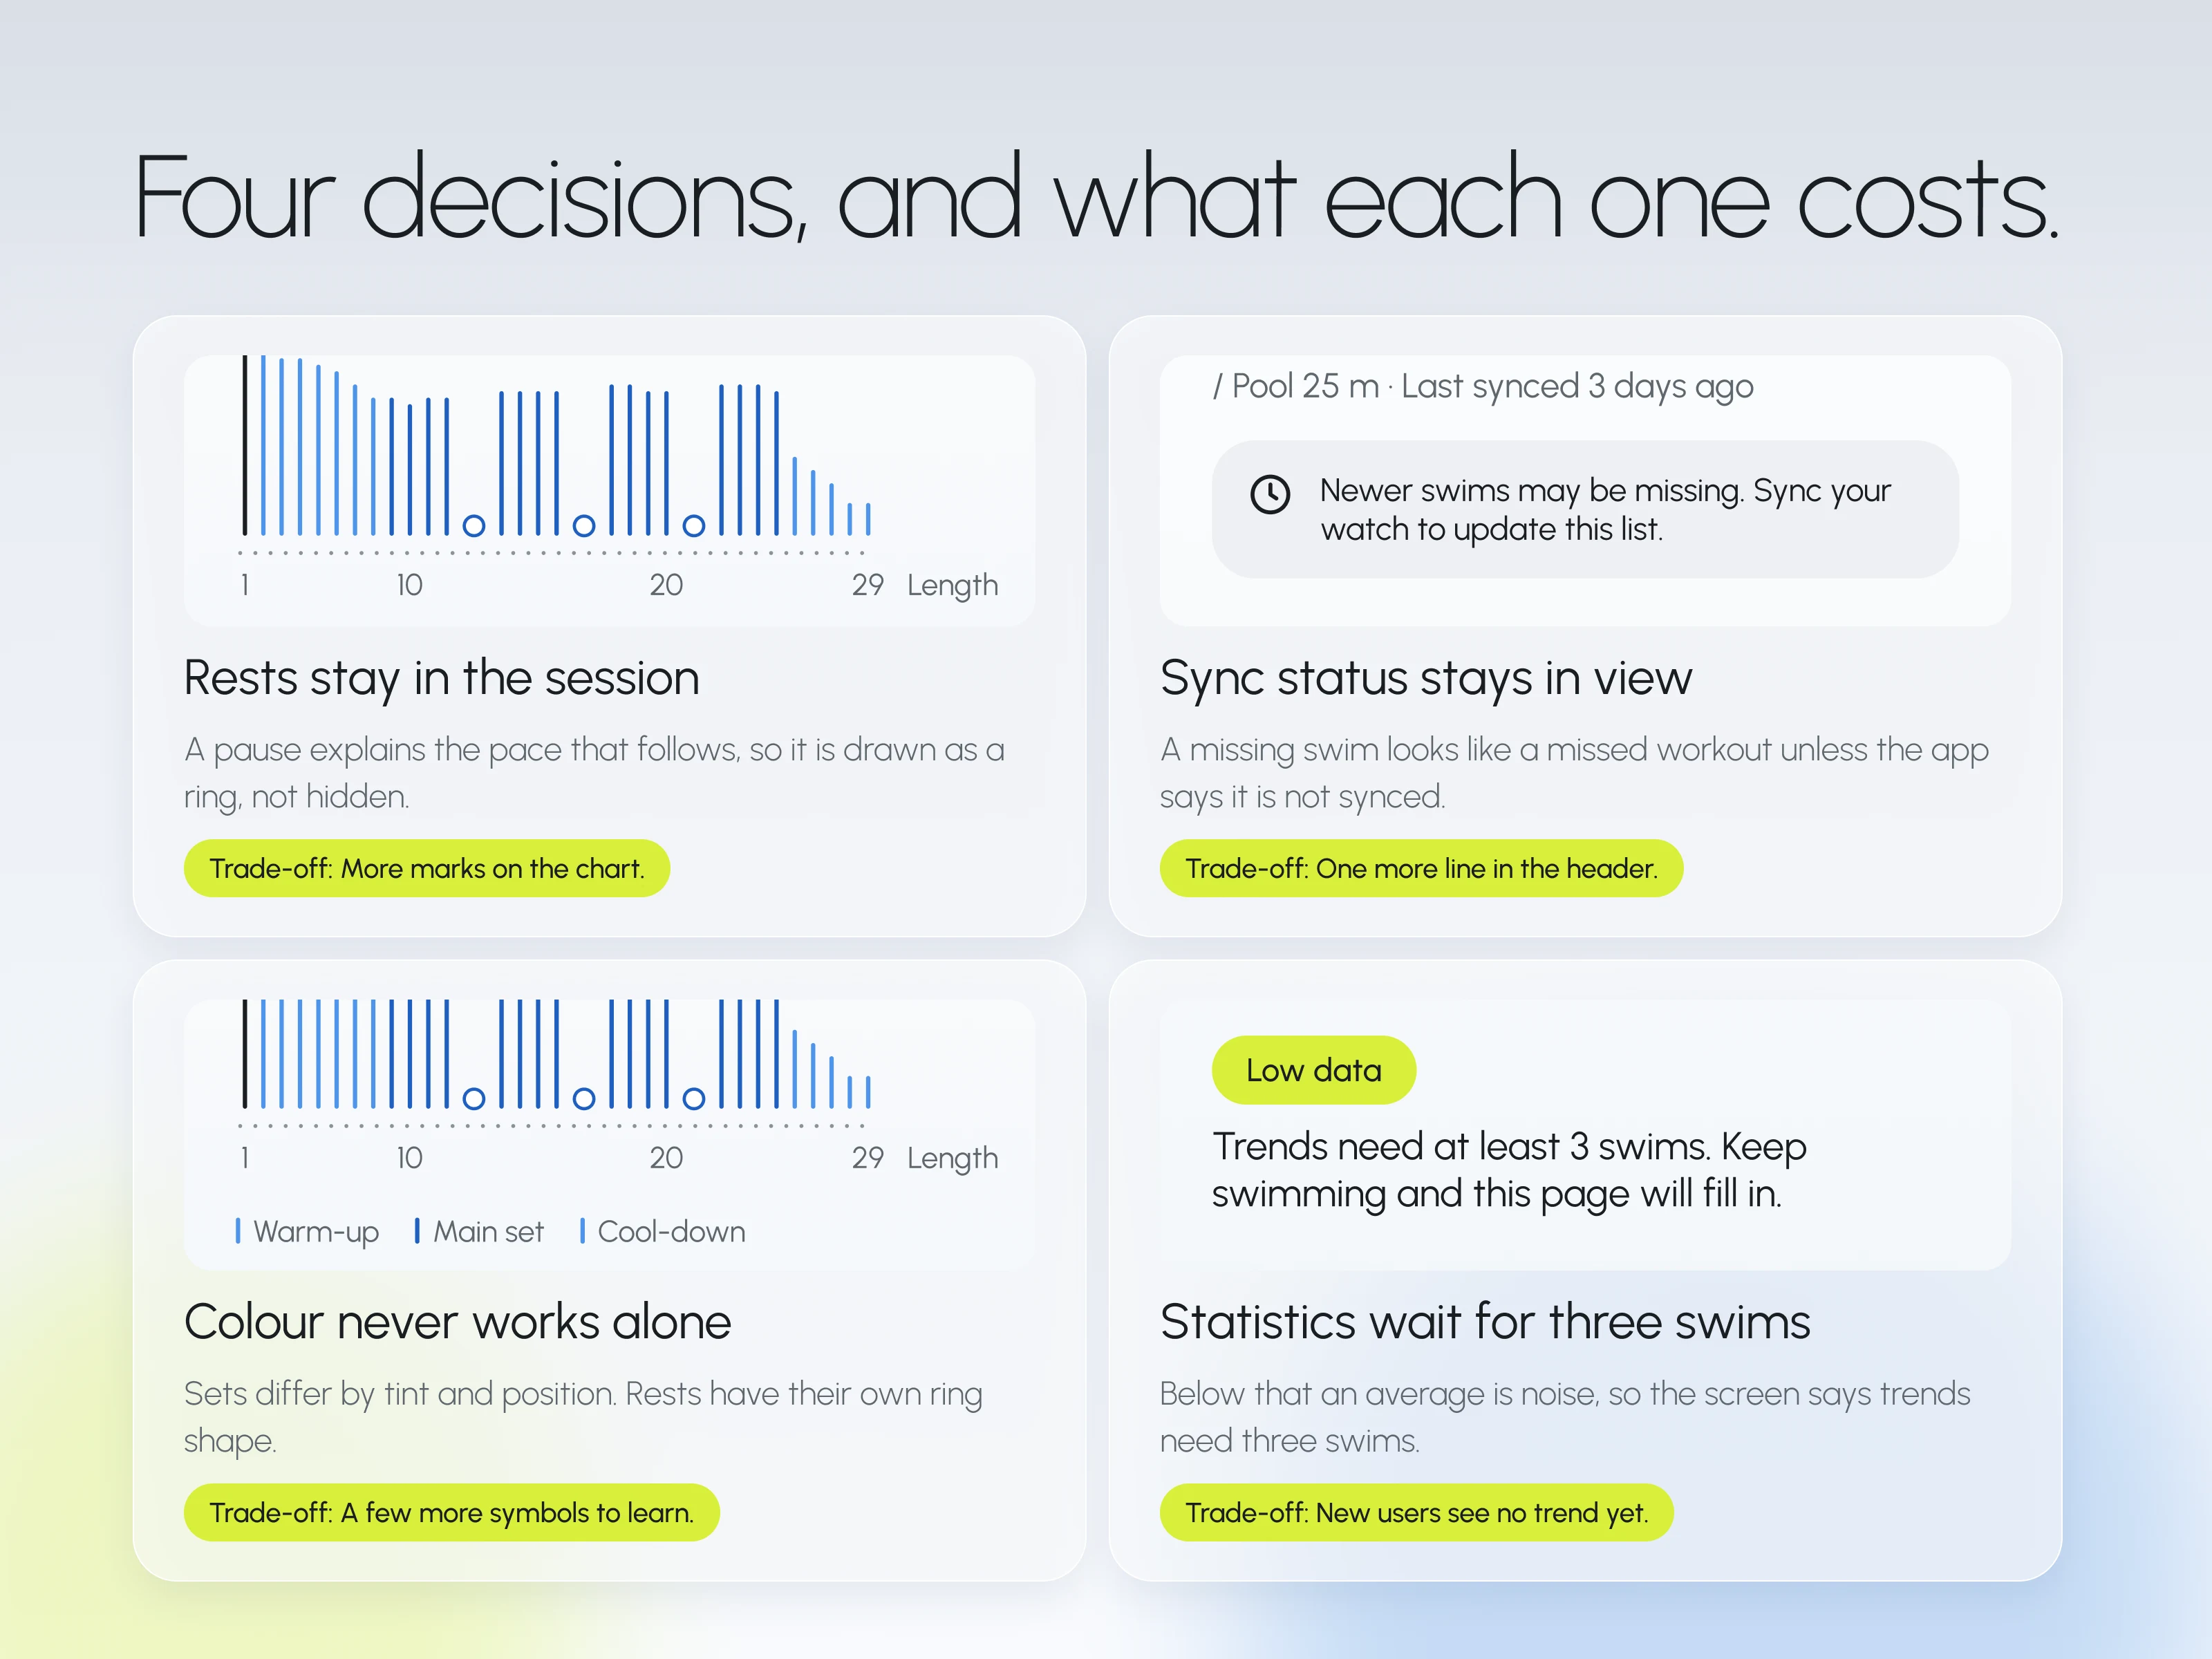
Rests stay in the session. A pause explains the pace that follows, so it is drawn as a ring, not hidden. Trade-off: more marks on the chart.
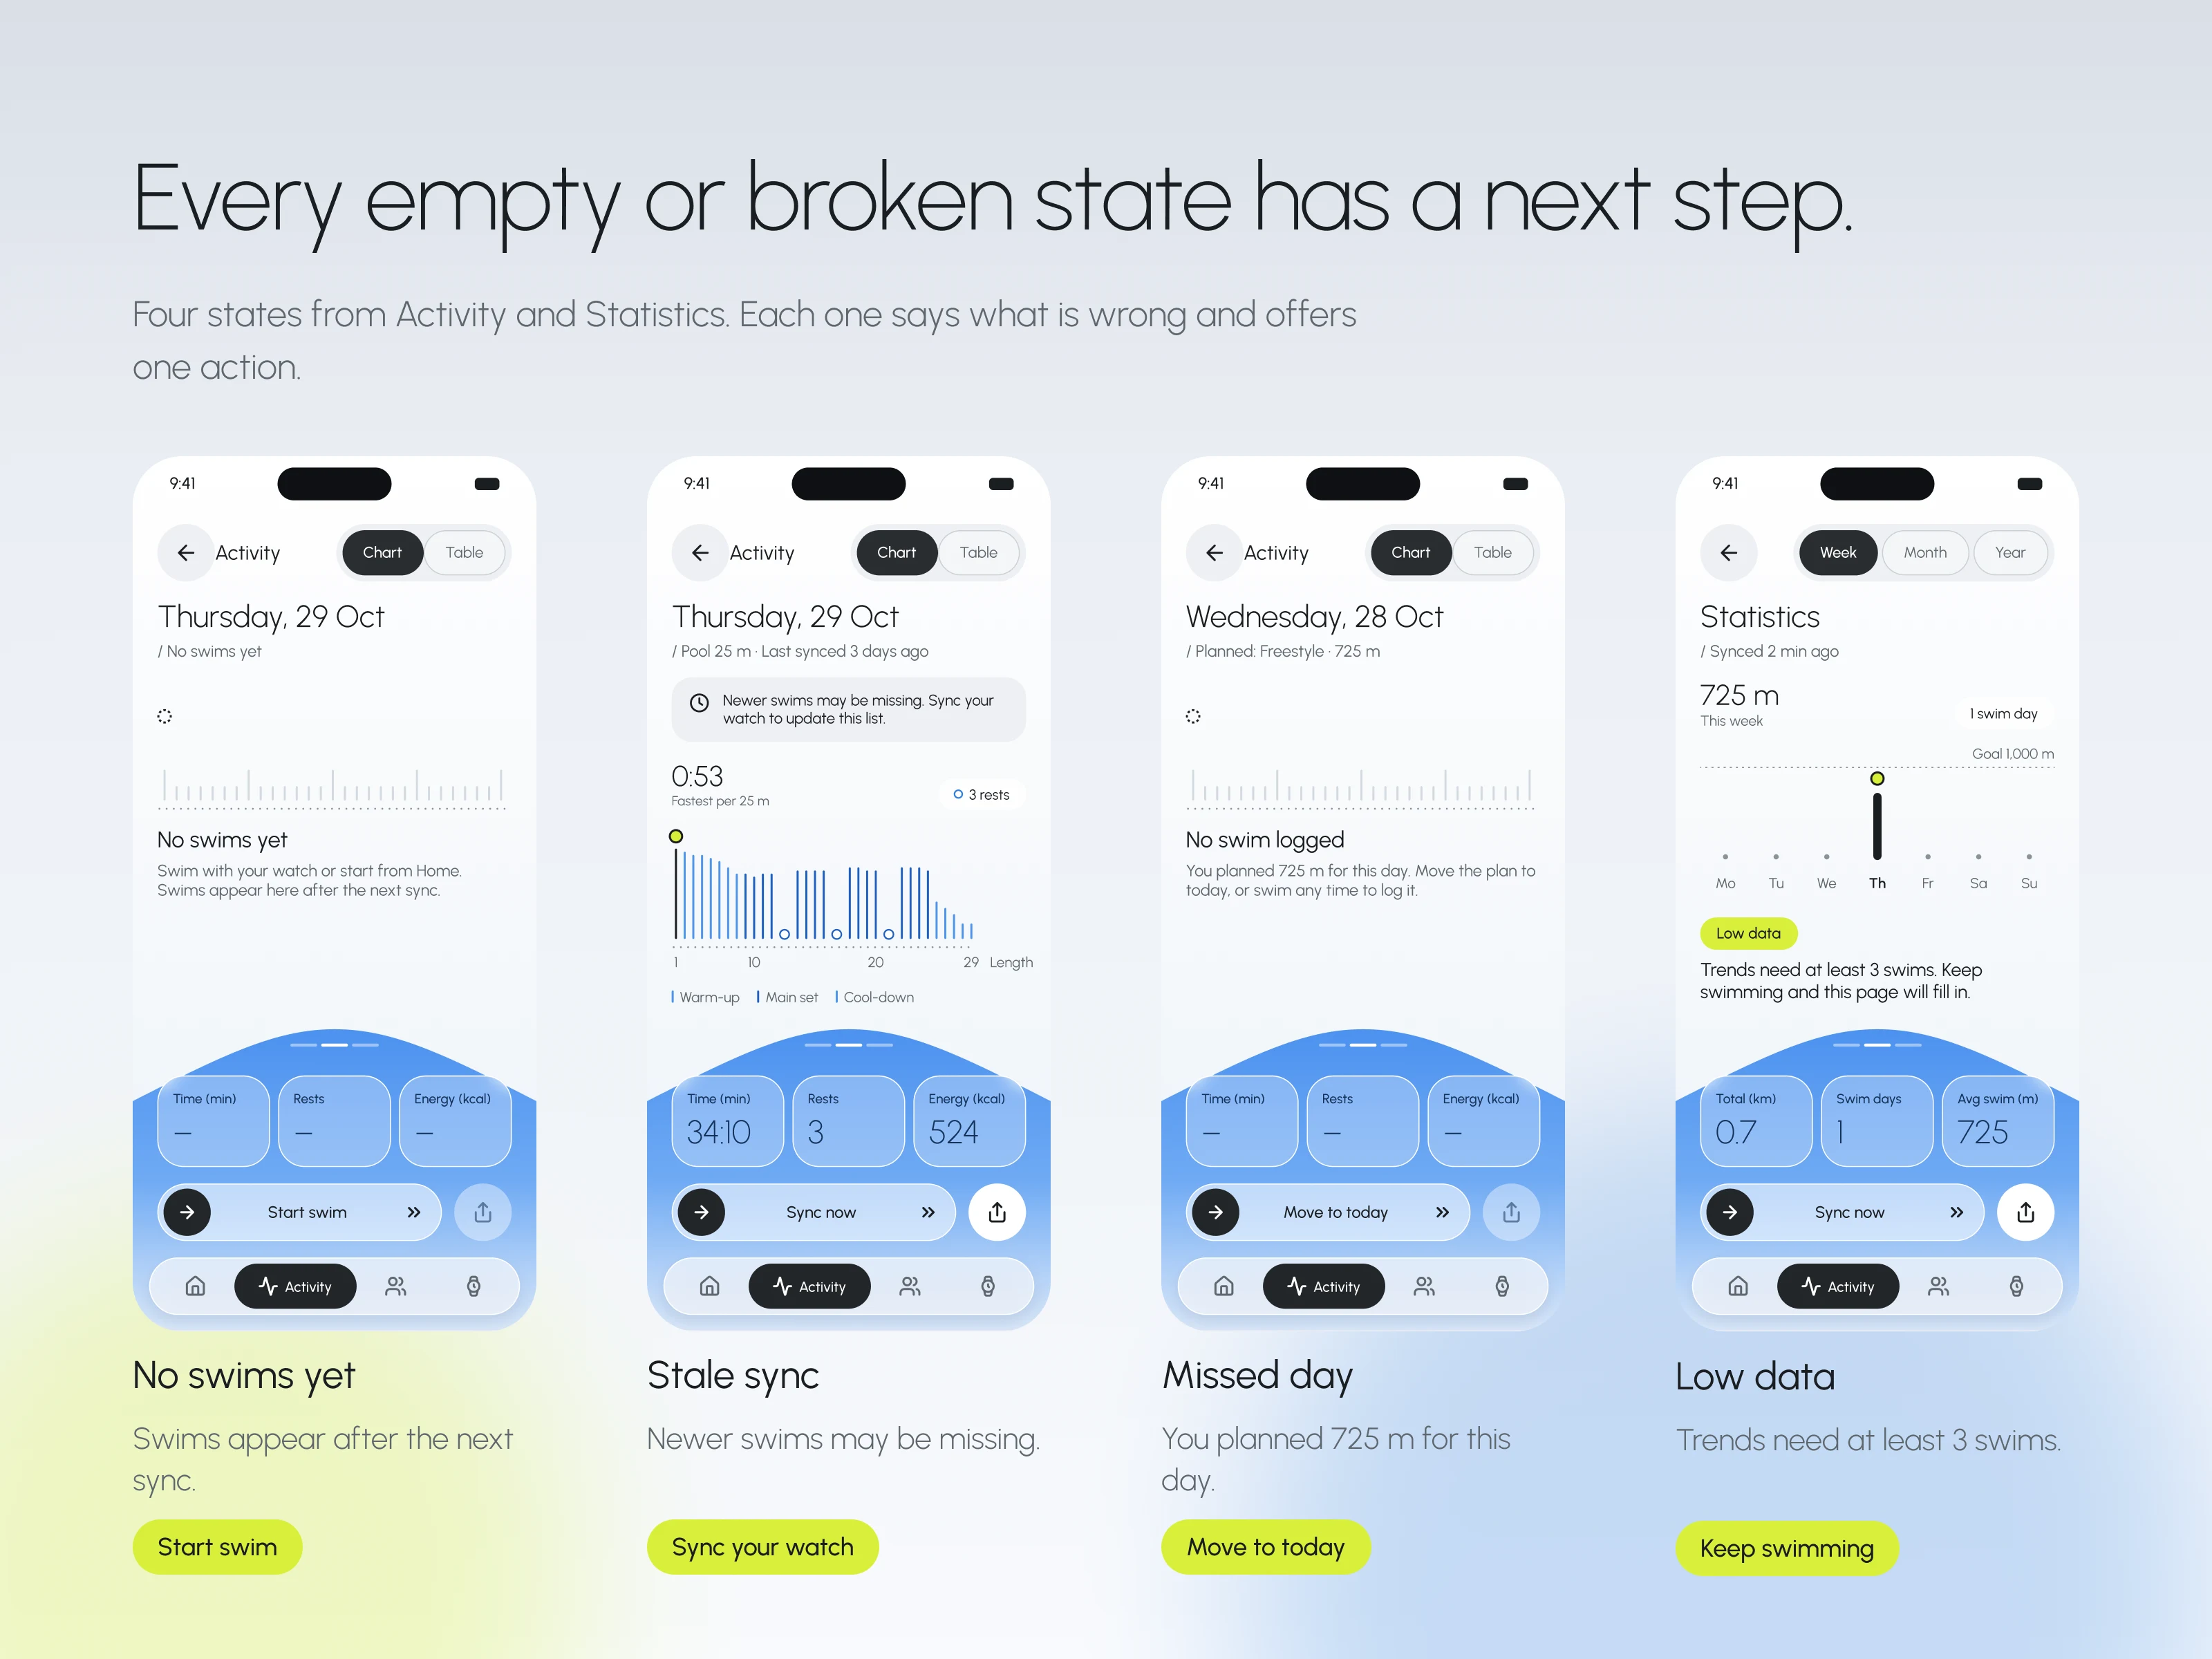
Sync status stays in view. A missing swim looks like a missed workout unless the app says it is not synced. Trade-off: one more line in the header.
Colour never works alone. Sets differ by tint and position, and rests have their own ring shape. Trade-off: a few more symbols to learn.
Statistics wait for three swims. Below that an average is noise, so the screen says trends need three swims. Trade-off: new users see no trend yet.
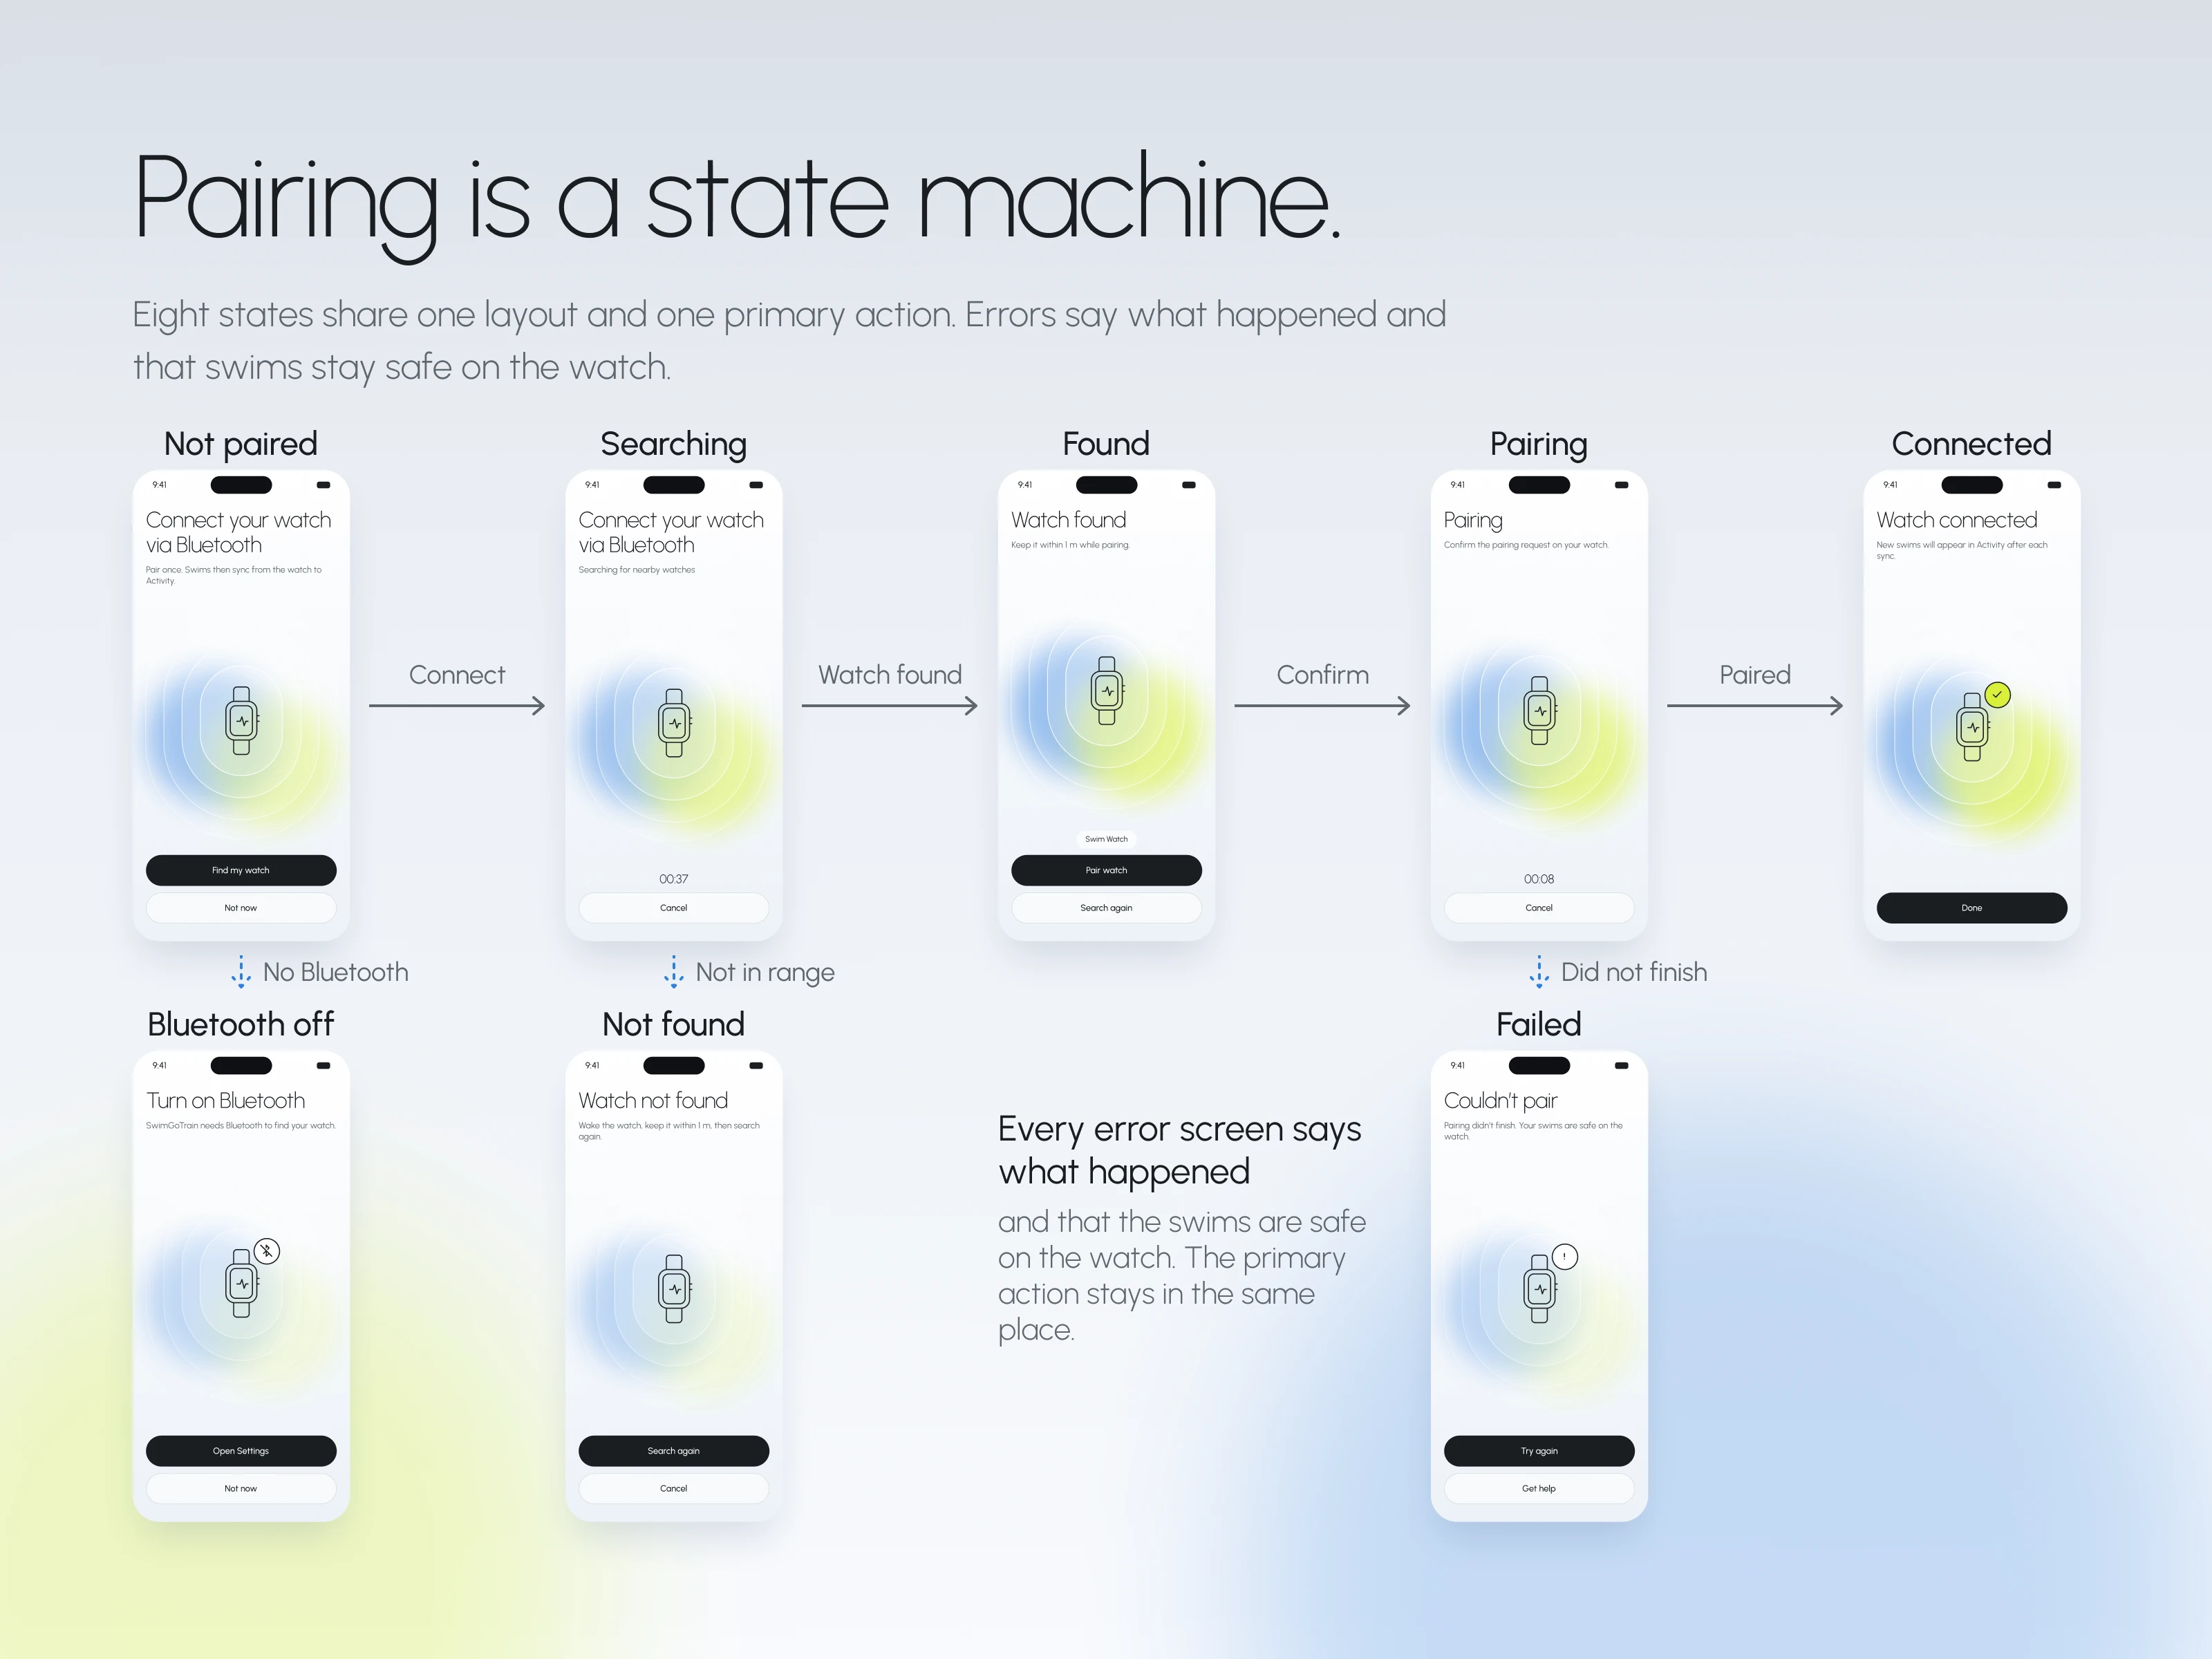
Pairing a watch is treated as a state machine with eight states, one layout and one primary action. Errors say what happened and that swims stay safe on the watch.
What I would measure:
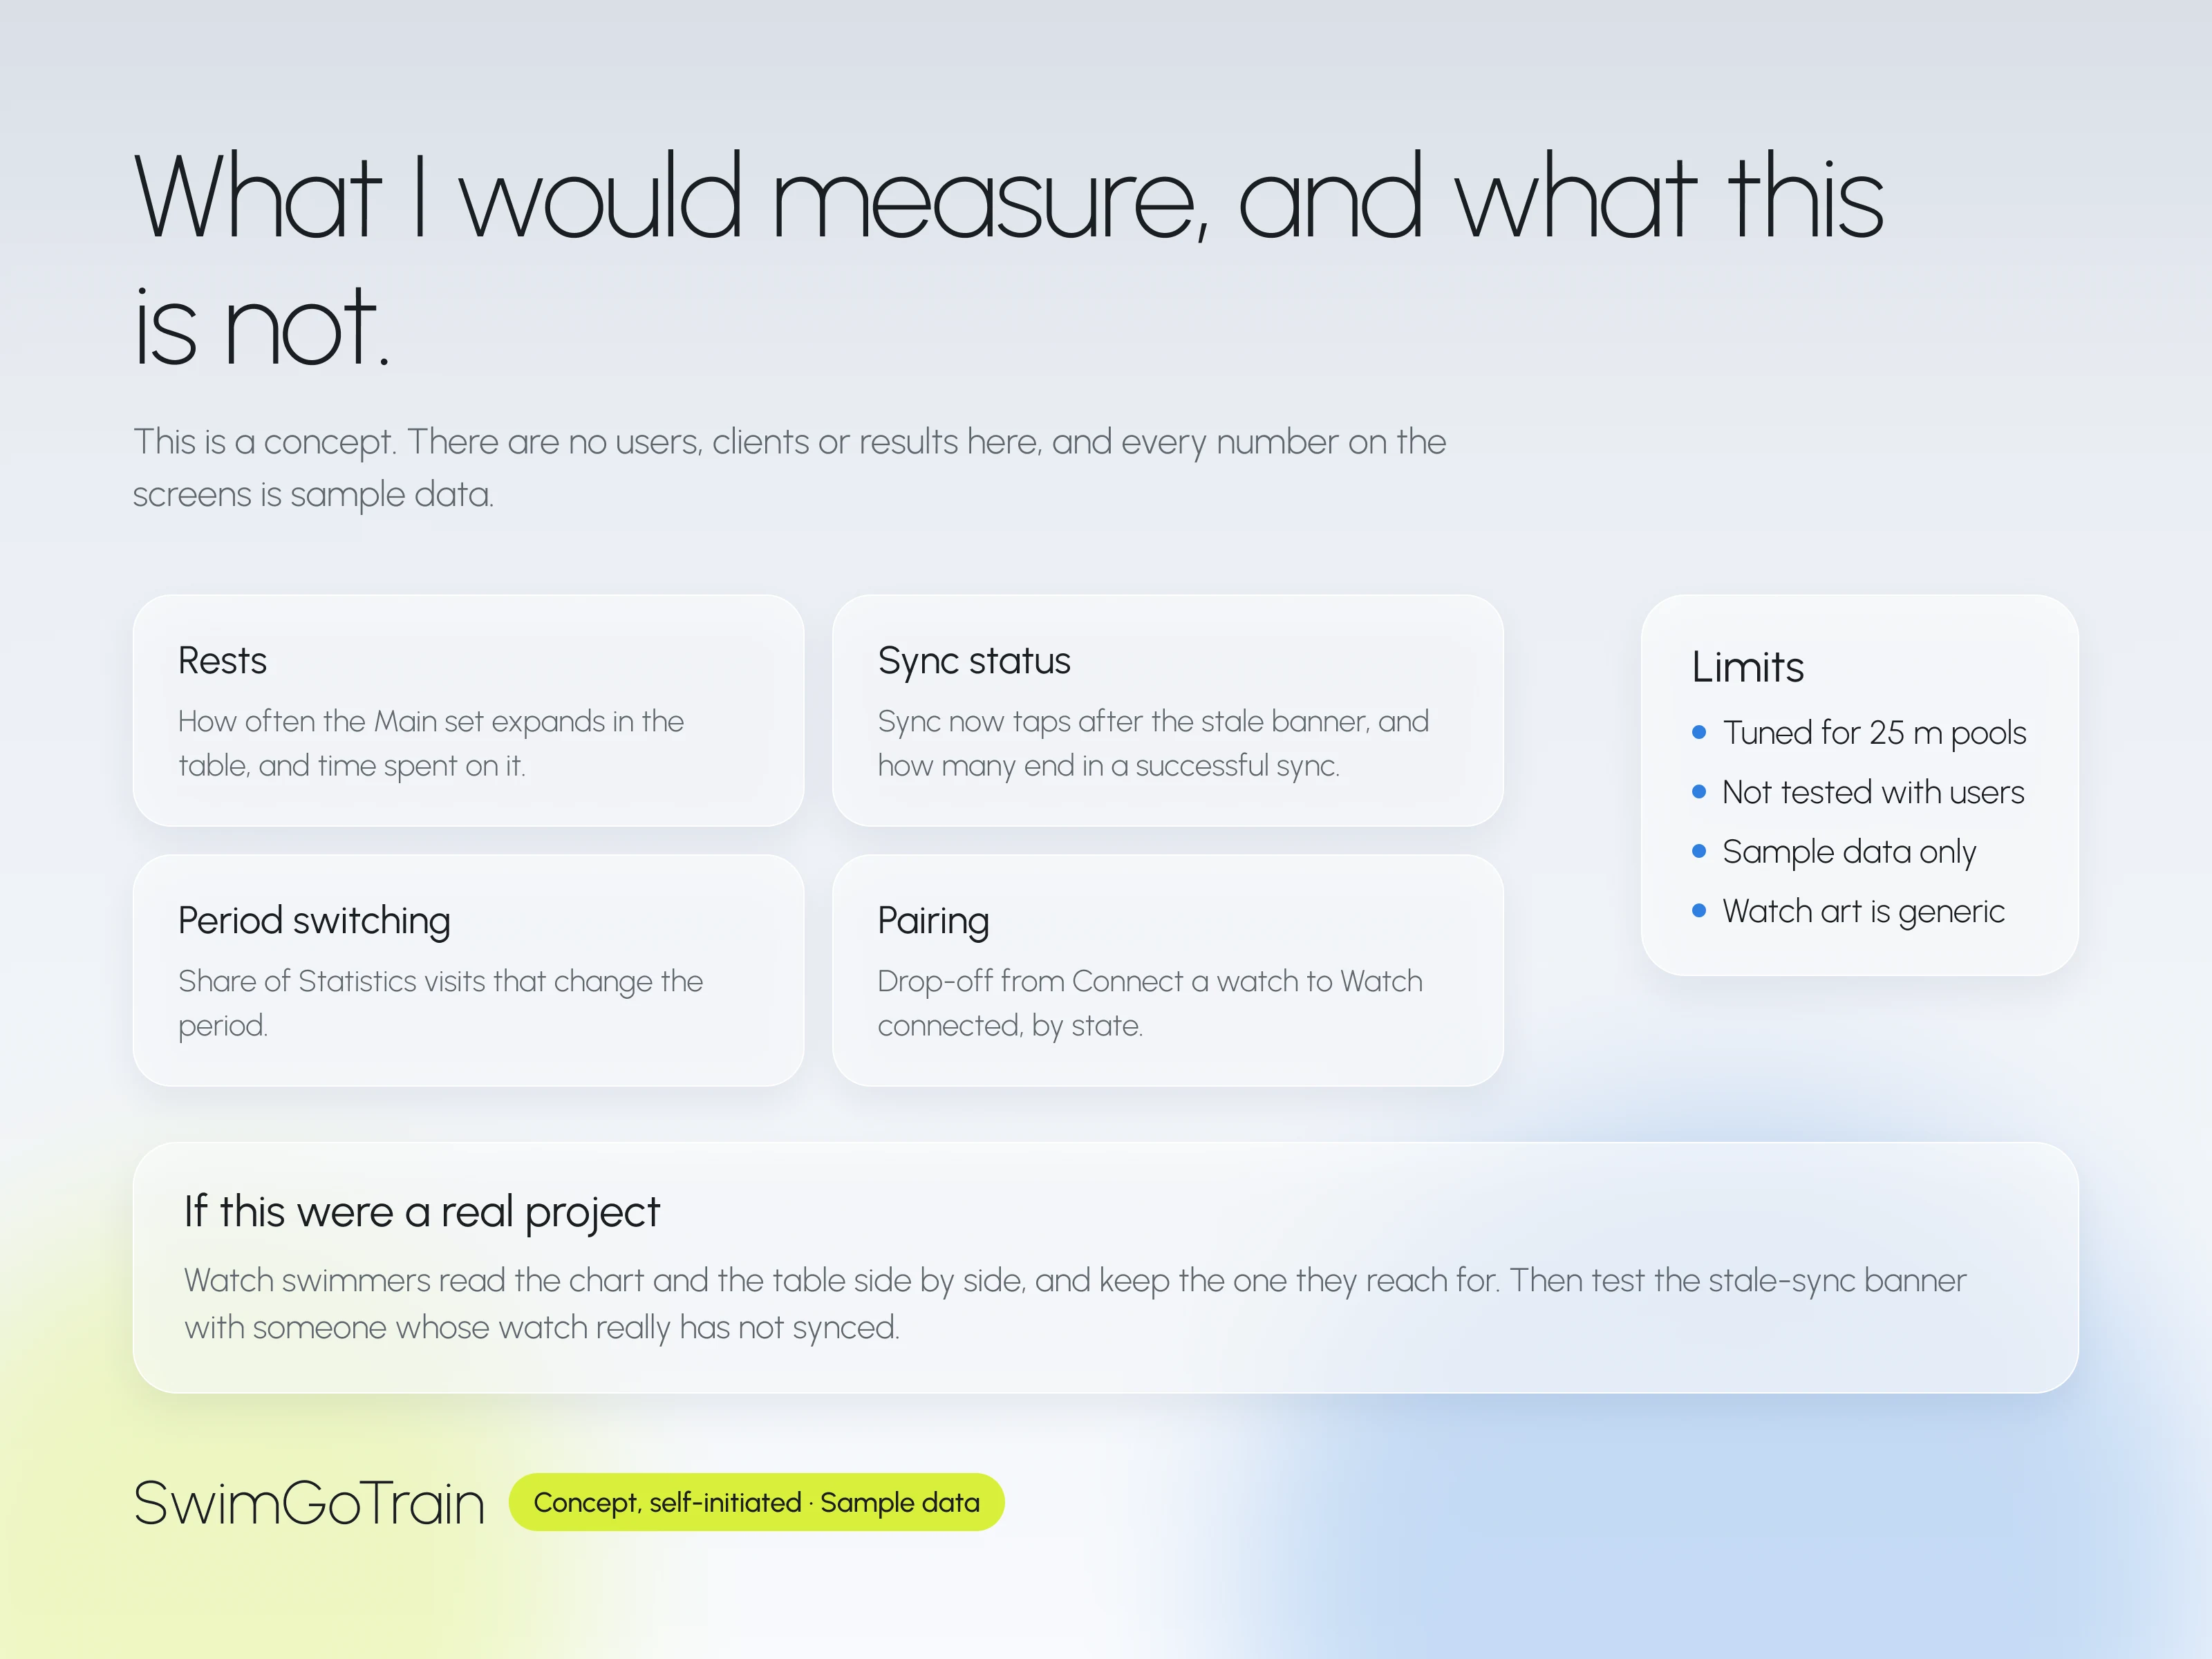
Rests: how often the Main set expands in the table, and time spent on it.
Sync status: Sync now taps after the stale banner, and how many end in a successful sync.
Period switching: share of Statistics visits that change the period.
Pairing: drop-off from Connect a watch to Watch connected, by state.
Limits: tuned for 25 m pools, not tested with users, sample data only, watch art is generic.
Like this project
Posted Nov 4, 2026
An iOS swim app that shows a session as sets and rests, keeps sync status visible, and gives every empty or error state a next step.