
IllustrationBackgroundObjectivesProcessResearch and Planning Wireframing and Prototyping Graphic DesignContent Creation Integration and Alignment Collaboration and Feedback Iterative RefinementResultsIntuitive UI and UX Visually Appealing DesignEngaging ContentInteractive PrototypesUser-Centric DesignConclusion
Illustration
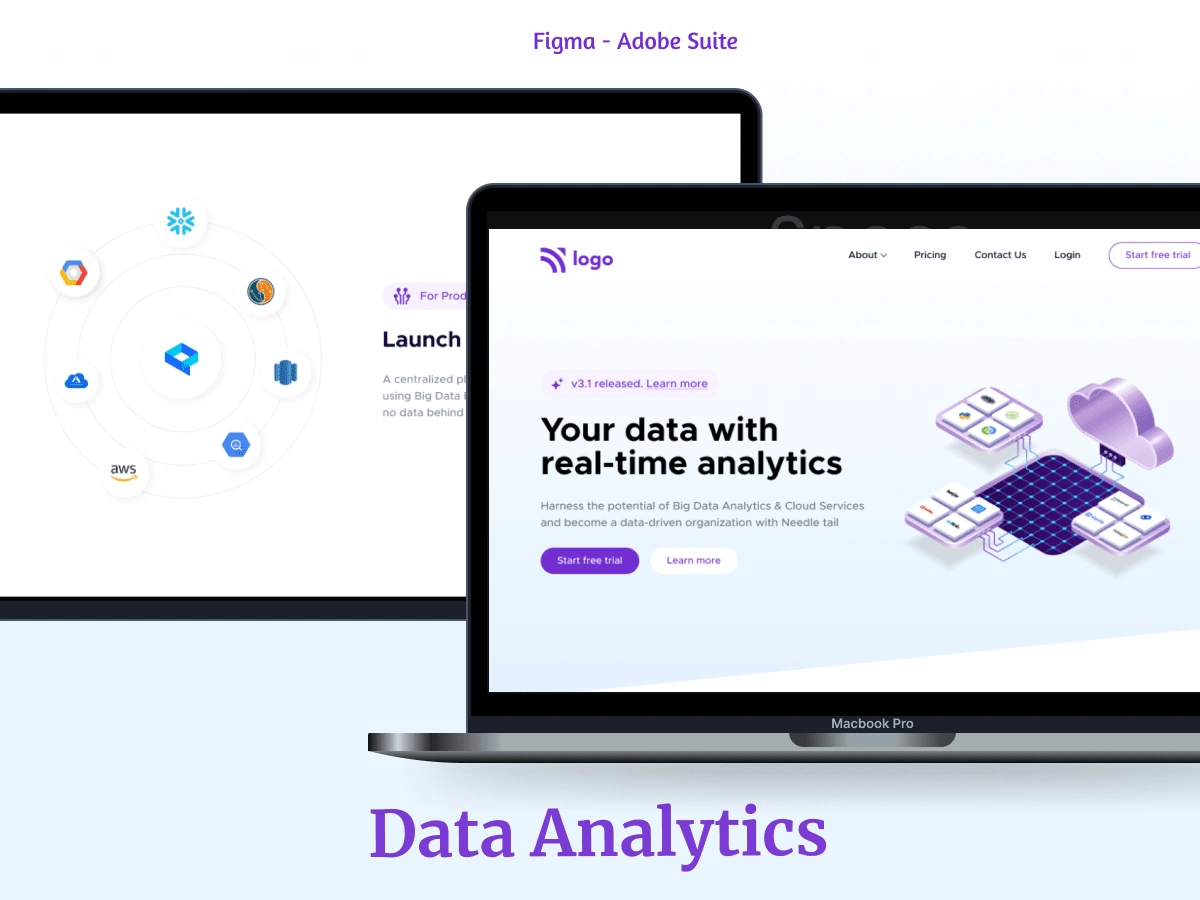
SASS Application
Background
As a user seeking to create a compelling Data Analytics design for your personal product to sell, you turned to a combination of Figma and Adobe Suite for graphics creation and content generation. Leveraging these tools, I collaborated with you to meticulously craft wireframes, prototypes, and visually appealing data visualizations that effectively communicate complex information.
Objectives
Design an intuitive user interface and seamless user experience for the Data Analytics product.
Develop visually appealing data visualizations and illustrations using Adobe Suite.
Create engaging copy that effectively communicates the features and benefits of the product.
Ensure the user journey is informative and persuasive, driving interest and engagement.
Gather and incorporate feedback from stakeholders to refine the design iteratively.
Process
Research and Planning
Conducted research on the target audience, competitors, and industry trends to inform the design strategy.
Wireframing and Prototyping
Collaborated with you in Figma to meticulously craft wireframes and prototypes, ensuring an intuitive user interface and seamless user experience.
Graphic Design
Utilized Adobe Suite's robust graphic design capabilities to develop visually appealing data visualizations and illustrations that effectively communicate complex information.
Content Creation
Harnessed the capabilities of Copy.ai to generate engaging copy tailored to your product's features and benefits, from captivating headlines to informative descriptions.
Integration and Alignment
Integrated compelling messages into the design, ensuring that every aspect of the user journey is informative and persuasive.
Collaboration and Feedback
Utilized InVision to collaborate with stakeholders, gather feedback, and refine the design iteratively. Created interactive mockups that allowed stakeholders to experience the product firsthand and provide valuable insights for further improvements.
Iterative Refinement
Incorporated feedback from users and stakeholders to iteratively refine the design, ensuring it meets the needs and expectations of the target audience.
Results
Intuitive UI and UX
The meticulous design process resulted in an intuitive user interface and seamless user experience.
Visually Appealing Design
Stunning data visualizations and illustrations created with Adobe Suite enhanced the aesthetic appeal and effectively communicated complex information.
Engaging Content
Compelling copy generated with Copy.ai effectively communicated the features and benefits of the Data Analytics product, driving audience engagement and interest.
Interactive Prototypes
Interactive mockups created with InVision provided stakeholders with a hands-on experience, leading to valuable insights and further improvements.
User-Centric Design
The final design, refined through iterative feedback, met the needs and expectations of the target audience, resulting in a product that resonates with users and drives sales.

Conclusion
Overall, the collaboration to create a compelling Data Analytics design was a success. The combination of Figma, Adobe Suite, Copy.ai, and InVision enabled the creation of a product that not only showcases the capabilities of your personal product but also resonates with users and drives sales. With a visually stunning design, compelling content, and seamless user experience, you can confidently enter the competitive market of Data Analytics solutions.
0 likes · 42 views · May 7, 2024
Crafted Data Analytics design using Figma, Adobe Suite, Copy.ai, and InVision for personal product. Compelling visuals, engaging content.


