Survey-insights
Abdelrhman Sadek
Survey-insights
Description
in these surveys the focused on classifying people who are being asked into groups based on a lot of features like gander, nationality,Religion, and more other features even race and zodiac signs then ask them 5 main questions for the survey:
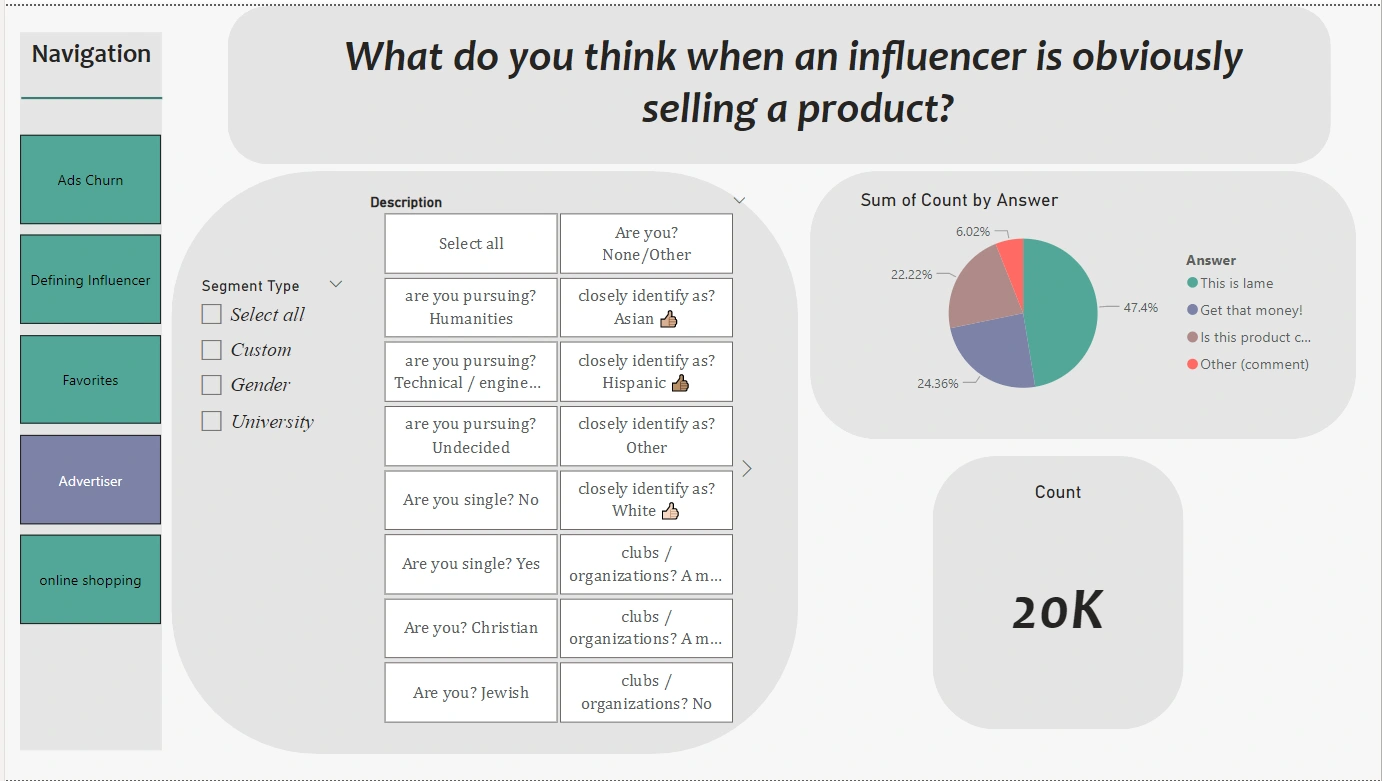
What do you think when an influencer is obviously selling a product?
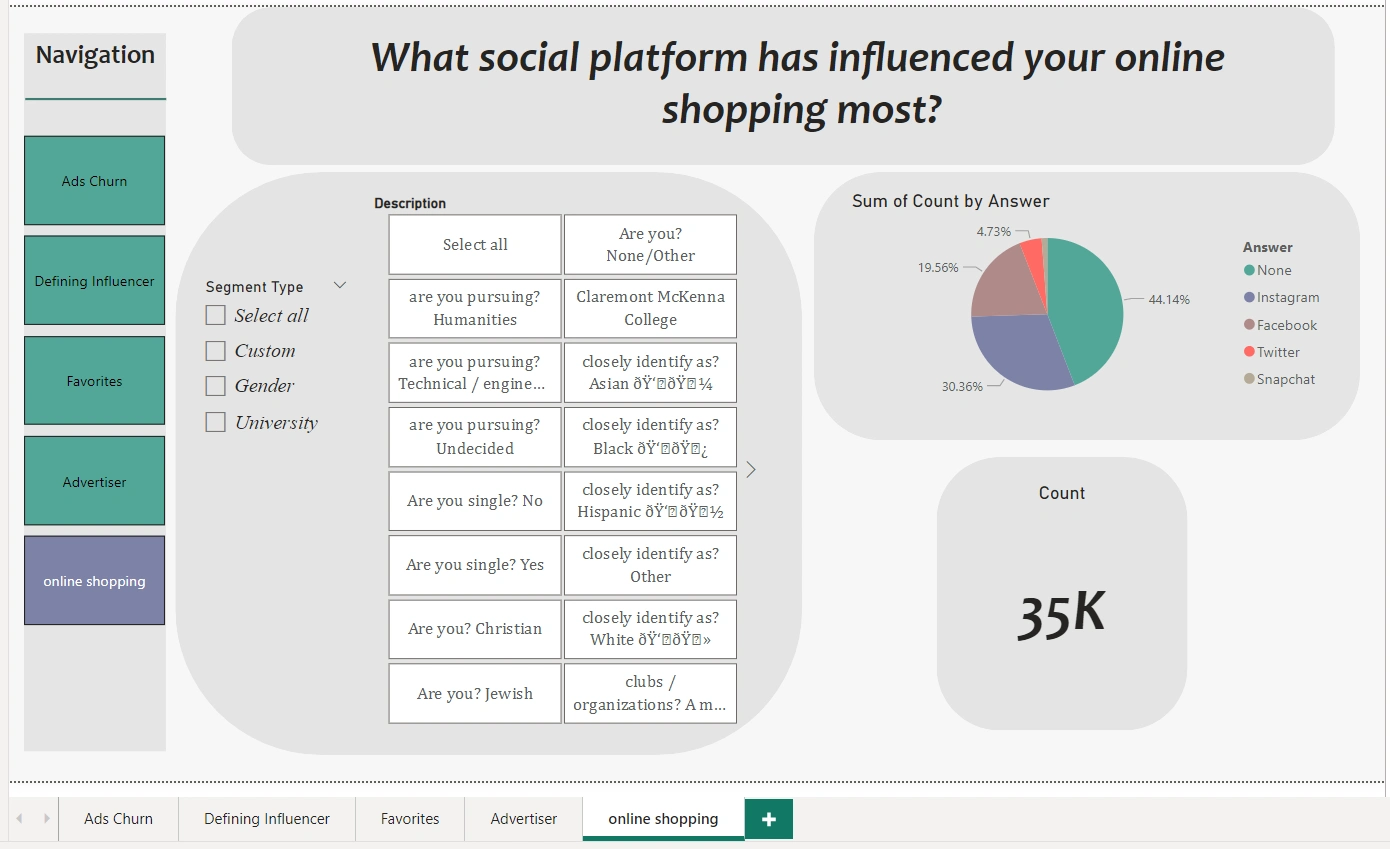
What social platform has influenced your online shopping most?
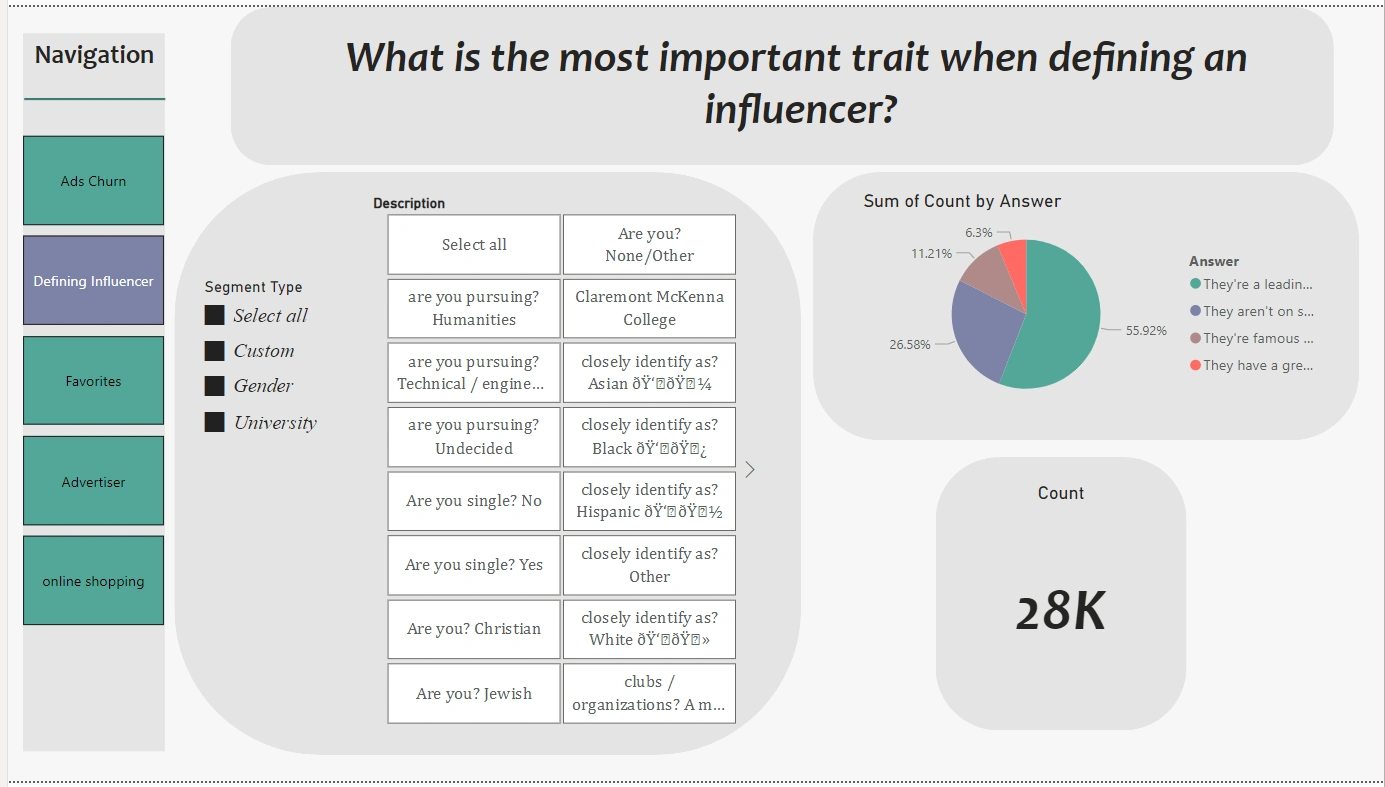
What is the most important trait when defining an influencer?
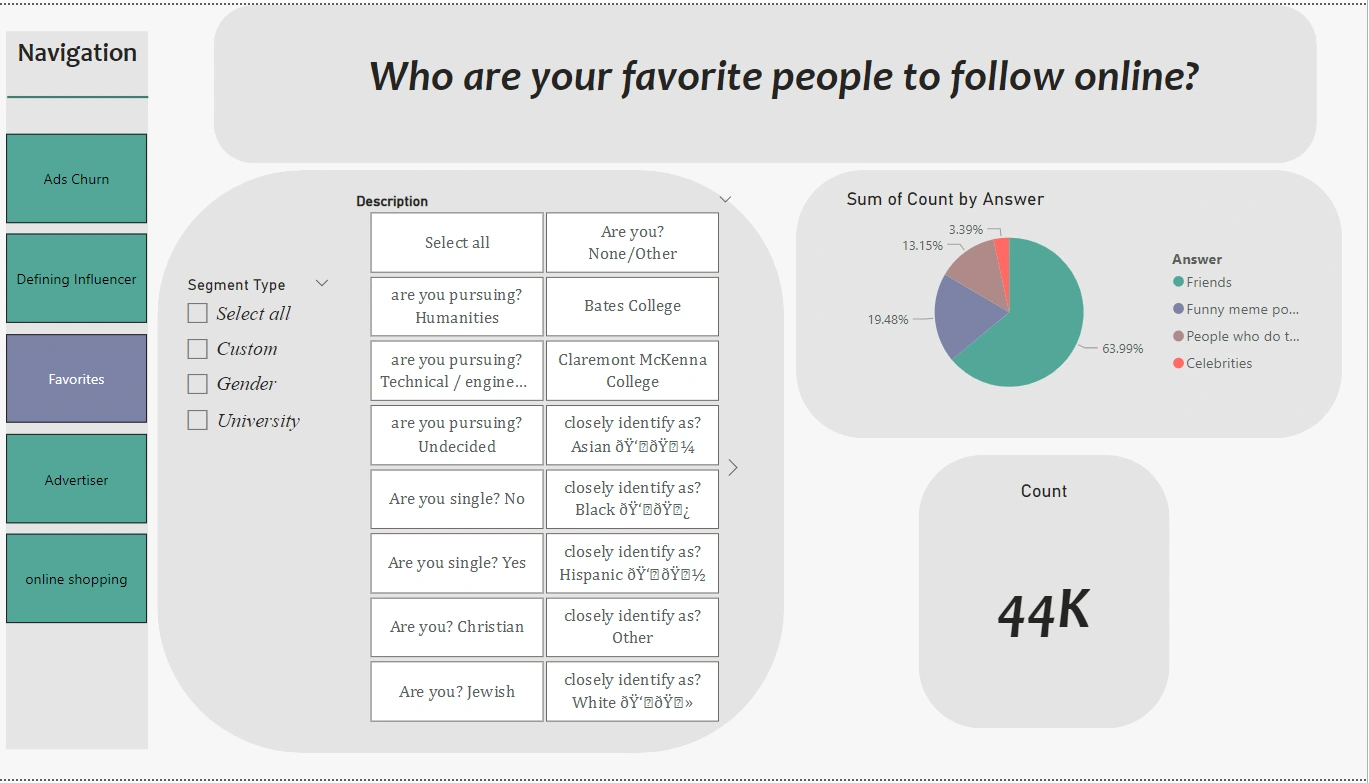
Who are your favorite people to follow online?
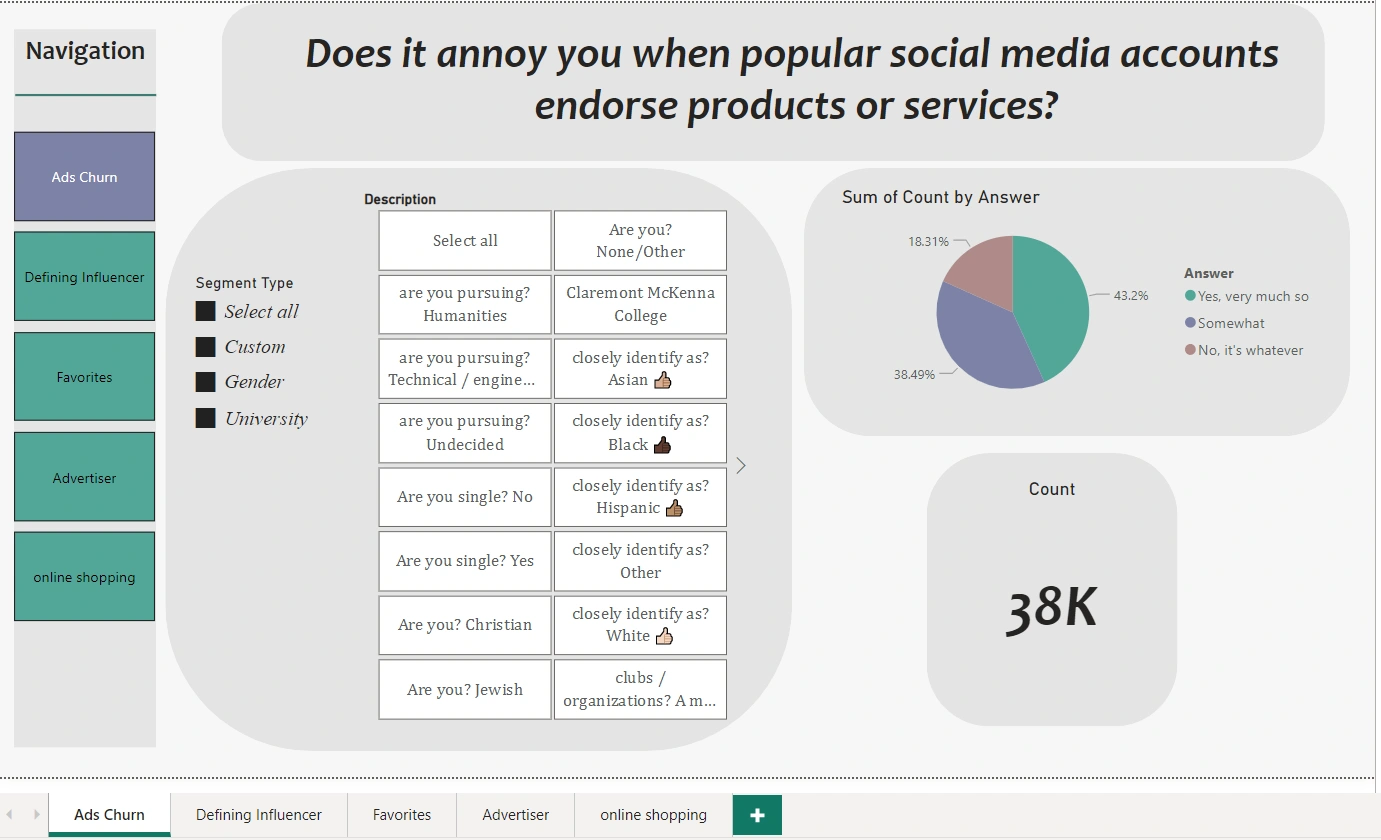
Does it annoy you when popular social media accounts endorse products or services?
What do you consider an influencer?
with this so many groups, it will be hard to access all this information
The goal: is to build an interactive dashboard to access the information and insights of the survey more easily
with a small piece of code with Python split the questions into 5 data frames each one has a question of the survey
Dashboard
Like this project
Posted Jun 13, 2023
An inter-active dashboard to make gathering information more smother and easier