Market Trends Analysis for E-commerce

Akinola Oluwaseyifunmi

Adidas Sales Analysis: Key Insights from Recent Performance Data
Understanding sales data is essential for growth in competitive sports apparel and footwear. This analysis delves into the key metrics from recent Adidas sales data, which provides insights into product categories, regional performance, and retail success.
The dataset used for this project is sourced from Kaggle, a well-known platform for data science and machine learning.
By utilizing this rich dataset, we can explore trends, customer behavior, and sales performance, ultimately aiming to enhance our understanding of the retail landscape.
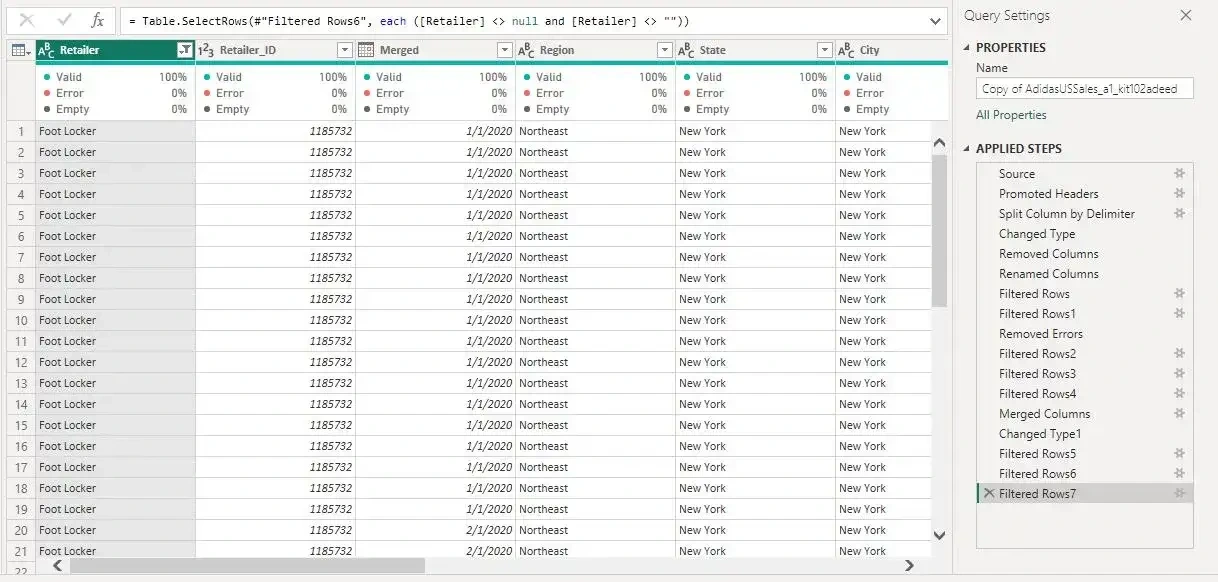
Power Query is utilized for data cleaning and transformation
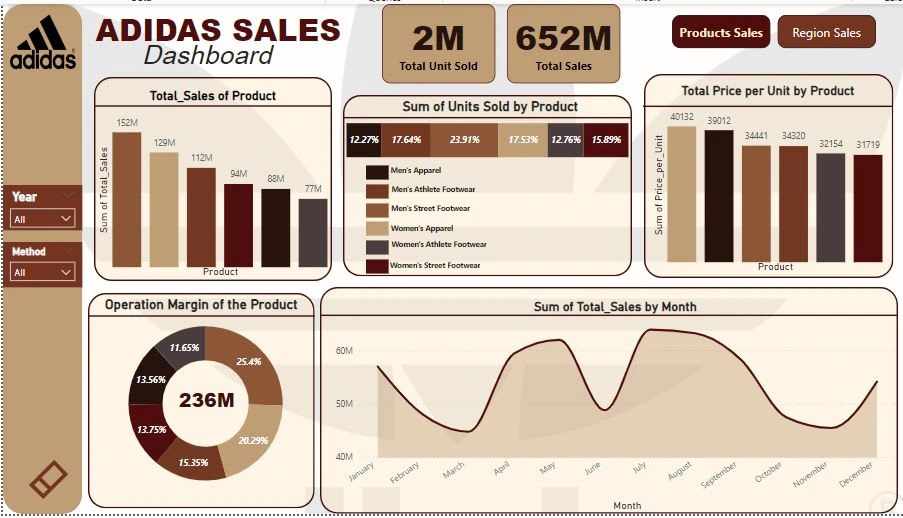
Product Sales Overview
Adidas’ total units sold amount to an impressive 2 million, generating a total sales revenue of $652 million. The top-selling product category is Men’s Apparel, contributing 152M to total sales, followed closely by Men’s Athlete Footwear and Men’s Street Footwear, each showing strong performances.
Unit Sales by Product
Among the product categories, Men’s Apparel leads in unit sales with a market share of 23.91%. This is indicative of the consistent demand for Adidas’ apparel products. Interestingly, Women’s Street Footwear makes up 15.89% of units sold, showcasing the brand’s appeal to a wide consumer base.
Price per Unit Analysis
The price per unit varies significantly across products. Men’s Apparel leads with the highest price per unit at $40,132, suggesting premium pricing strategies in this category. This is in contrast with Women’s Street Footwear, which has the lowest price per unit at $31,719.
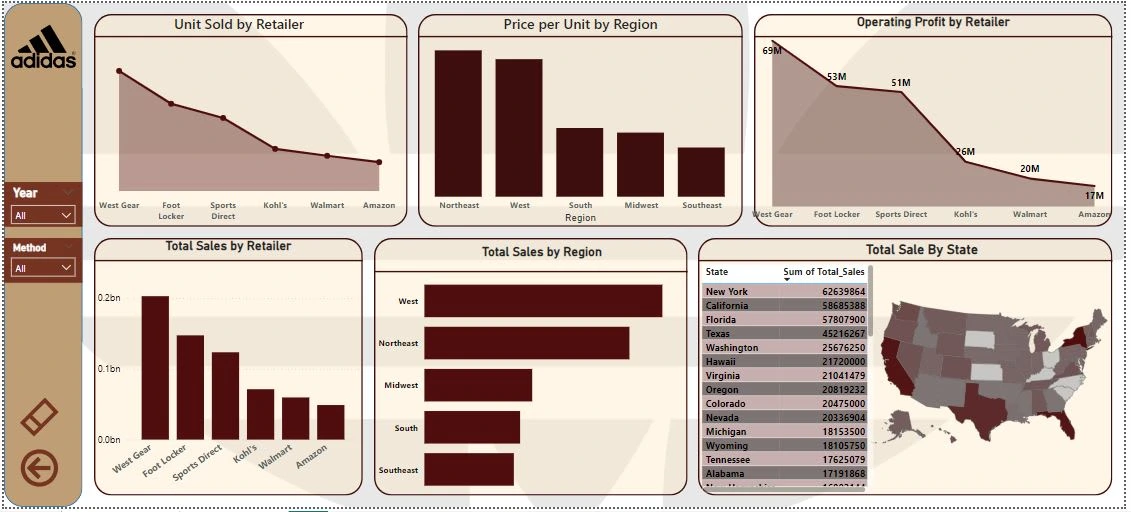
Regional Sales and Retailer Performance
Adidas sales are geographically diverse, with West Gear leading in unit sales among retailers, followed by Foot Locker and Sports Direct. In terms of operating profit, West Gear is the most profitable, generating 69 million in profit, highlighting its importance as a key partner.
From a regional perspective, the West leads in total sales, followed by the Northeast. However, the Northeast commands the highest price per unit, indicating strong pricing power in this region.
State-Level Sales Analysis
Breaking the data down by state, New York leads in total sales, contributing over $62 million. This is followed by California and Florida, two states where Adidas enjoys a significant market presence. Interestingly, smaller states like Hawaii and Wyoming also demonstrate strong per capita sales performance.
Visual Representation of the Data
To better illustrate the performance trends across product categories, regions, and retailers, below is a visual breakdown from the sales dashboard: This image provides a clear overview of sales distribution and performance across multiple dimensions, offering a glance at key insights.
Uncover insights in the Adidas analysis!
r insights in the Adidas analysis!
Conclusion
This Adidas sales data highlights the brand’s strong market position in both apparel and footwear, with notable performance across different regions and retailers. The focus on men’s products, particularly apparel, remains a key driver of sales and profitability, while the strong presence across U.S. states signals robust national demand. As Adidas continues to evolve, leveraging these insights will help in refining product offerings, pricing strategies, and regional focus.
Like this project
Posted Dec 4, 2024
Akinola analyzed sales data for an e-commerce company and visualized trends, leading to a 20% increase in sales.
Likes
0
Views
0