Uncover Netflix Trends: Interactive Dashboard with Tableau 📊

Zain Manna


This project demonstrates my skills in data visualization using Tableau to create an informative and visually appealing dashboard. ⚡
Project Goal:
The objective of building this dashboard is to provide an analytical tool for exploring and understanding Netflix data. The dashboard allows users to visualize various aspects of Netflix content, such as the distribution of movies and TV shows by year, top genres, ratings, and countries. It enables users to analyze trends over time, identify popular genres, understand geographical distribution, and explore individual movie details like ratings, duration, and release year. Overall, the dashboard aims to facilitate insights into Netflix content for informed decision-making or analysis purposes.
Data Acquisition and Preparation:
The project began with the import of a CSV file containing data about Netflix shows and movies. This data included details like show ID, type (movie or TV show), title, director, cast, date added, release year, rating, duration, category, and description.
During the data preparation stage, any null values present in the data, particularly within the years field, were filtered out to ensure accurate visualizations.
Data Visualization with Tableau:
I used Tableau to create several worksheets, each focusing on a specific aspect of the data:
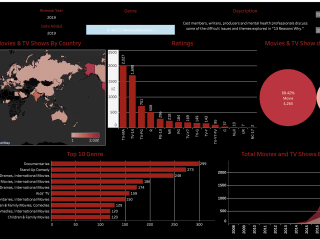
- Total Shows and Movies Over Time: This worksheet utilized an area chart to display the cumulative addition of movies and TV shows to Netflix categorized by date.
- Global Content Distribution: A world map worksheet depicted the distribution of movies and TV shows across different countries.
- Top Content Genres: This worksheet highlighted the top 10 genres amongst the available content, visualized through a stacked bar chart for better comprehension.
- Content Distribution by Type: The distribution of movies and TV shows was showcased in this worksheet, employing a chart format best suited for clear visualization (e.g., packed bubble chart).
- Content Ratings: This worksheet presented the distribution of content ratings using an appropriate chart type with a clear and concise design.
- Detailed Content Exploration: Additional worksheets offered detailed information about individual shows and movies, including descriptions, release dates, durations, ratings, release years, and genres.
Dashboard Design and Layout:
The final stage involved creating a well-organized dashboard in Tableau. The worksheets were arranged for optimal visual flow, and a title, filter options (if applicable), and a Netflix logo were incorporated to enhance the overall presentation. A focus was maintained on a clear and concise design throughout the dashboard, utilizing a consistent color scheme for easy readability and avoiding clutter through effective use of white space.
Here is a link to the dashboard ...