E-Commerce Dashboard for Analyzing Amazon Sales in India 📦

Zain Manna


This project demonstrates my skills in data visualization using Tableau to create an informative and visually appealing dashboard. ⚡
Project Description:
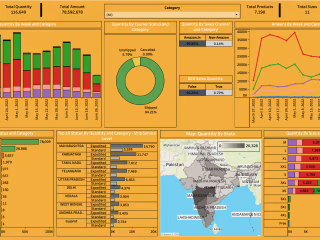
This project entails the creation of an interactive e-commerce dashboard focused on analyzing Amazon sales data within the Indian market. The dashboard is designed to provide users with comprehensive insights into various facets of Amazon sales, including product categories, quantities, amounts, and geographic distribution. By leveraging Tableau, the dashboard offers dynamic filtering and exploration capabilities, enabling users to delve deeper into sales trends and patterns. The objective is to showcase proficient data visualization and analysis skills through the development of an intuitive and informative dashboard tailored for e-commerce analytics.
Project Steps:
- Exploring and understanding the dataset: Review the provided dataset from Kaggle containing Amazon sales data and understand the available fields and their significance.
- Data preparation and import: Import the Amazon sales dataset into Tableau and perform necessary data cleaning and preparation.
- Dashboard design and creation: Design and create interactive visualizations including a stacked bar chart, map, horizontal bar chart, and highlight tables to represent various aspects of Amazon sales.
- Adding interactivity and filters: Implement filters and interactivity features to allow users to dynamically explore the data based on different categories and parameters.
- Customizing visualization aesthetics: Customize the visual elements such as colors, fonts, and layout to enhance the dashboard's aesthetics and usability.
Tools Used:
- Tableau: Utilized for data visualization, interactive dashboard creation, and data exploration.
- Kaggle dataset: Used as the source of Amazon sales data for analysis.