Built using Microsoft Excel, this

Rasamita Barik


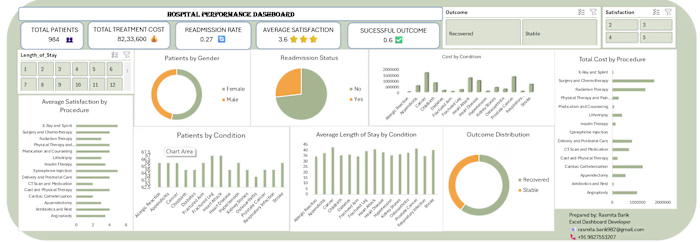
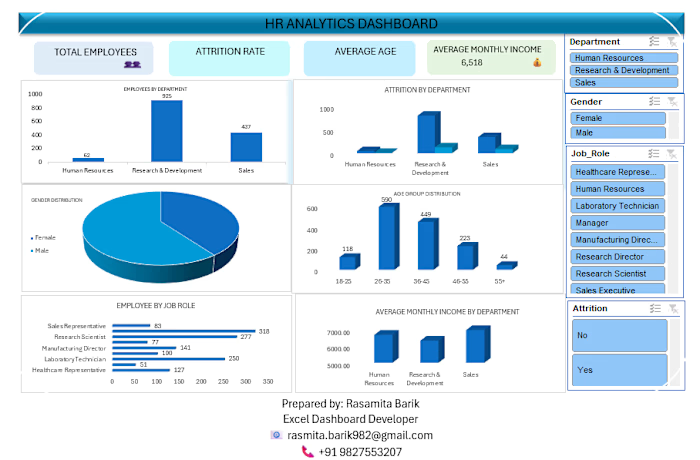
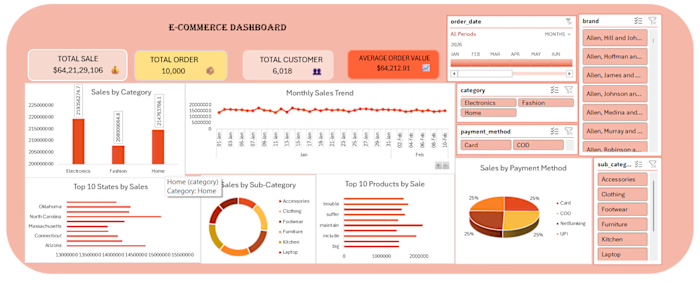
Built using Microsoft Excel, this dashboard transforms raw sales data into an easy-to-understand visual report. It includes KPI cards, charts, slicers, and trend analysis to help businesses monitor performance, identify sales trends, and make informed decisions.
Tools Used
Microsoft Excel
Pivot Tables
Pivot Charts
Slicers
Conditional Formatting
Excel Formulas
Like this project
Posted Jul 18, 2026
Built using Microsoft Excel, this dashboard transforms raw sales data into an easy-to-understand visual report. It includes KPI cards, charts, slicers, and t...
Likes
0
Views
0
Timeline
Jul 1, 2026 - Jul 4, 2026