Climate Dashboard for Adaptive Agriculture Management, Indonesia
Angelin
Here are the process that we've done:
Data Collection:
1. Secondary Data Analysis: Utilizes existing data from various sources, including:
- Meteorology, Climatology, and Geophysics Agency (BMKG) for weather data
- Ministry of Agriculture for agricultural data
- Ministry of Environment and Forestry for environmental data
2. Document Studies: Collects information from:
- Research reports
- Scientific journals
- Policy documents related to climate change and adaptation
3. Literature Review Conducted systematically to identify, review, and analyze relevant information using scientific databases such as:
- Google Scholar
- IEEE Xplore
- Keywords: "climate change," "adaptation," "environmental management," "data visualization," "agriculture," and "Indonesia"
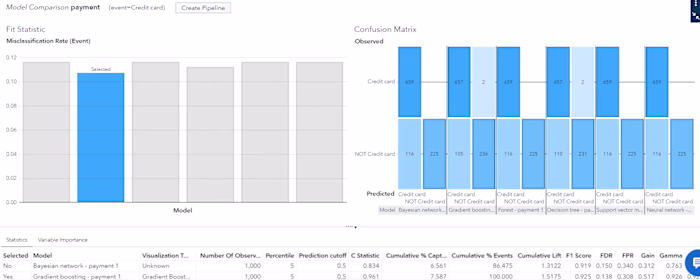
Data Analysis and Visualization Method
1. Statistical Approaches: Applied to identify relationships between climate change, adaptation, and management strategies
2. Data Visualization: Interactive dashboards created using applications like Tableau to visualize analysis results in an engaging and understandable manner
Framework Method Used
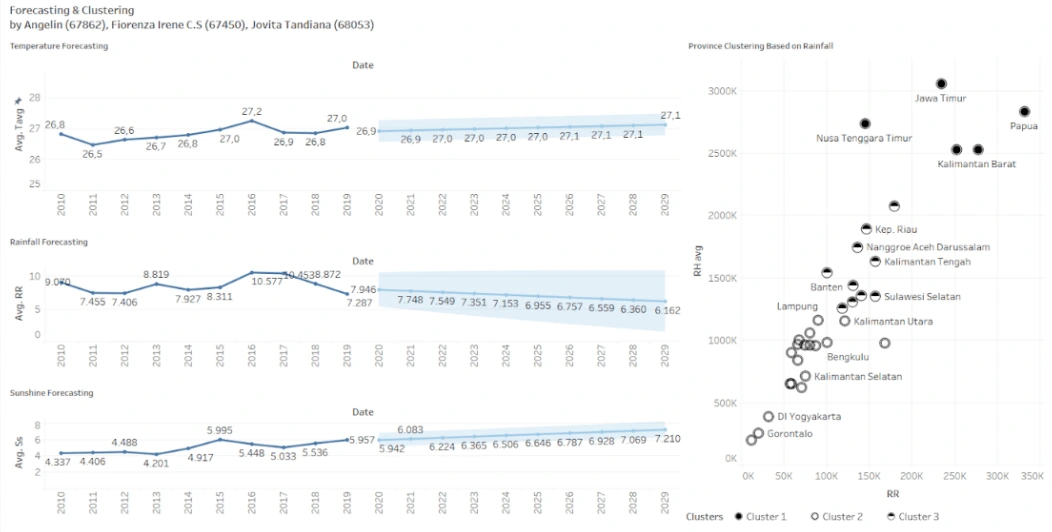
1. Problem Identification: Understands how climate change has affected Indonesia's environmental and agricultural systems from 2010 to 2020
2. Data Mapping and Visual Analysis: Uses information dashboards to analyze and visualize climate change trends, adaptation strategies, and efforts for adaptive environmental and agricultural management in Indonesia
3. Data Processing: Merges three CSV files using the left join method in Tableau, based on 'station_id' and 'province_id' columns, and exports the data to CSV format
4. Data Visualization: Conducted post data processing using Tableau to facilitate easier comprehension of the data through various visualization types, including:
- Line Charts
- Pie Charts
- Graphs
- Gauges
- Histograms
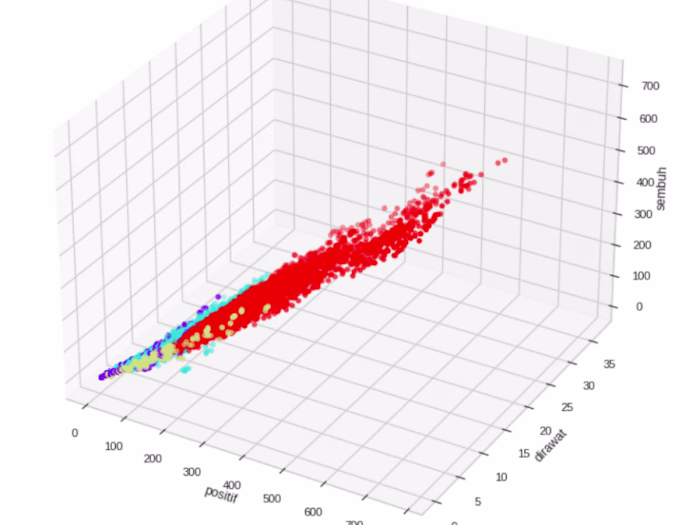
- Scatter Plots
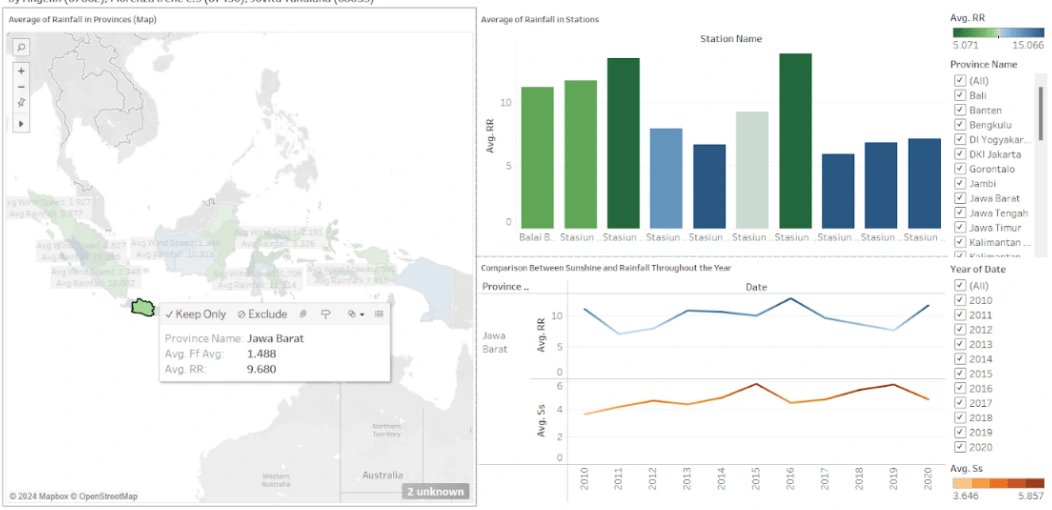
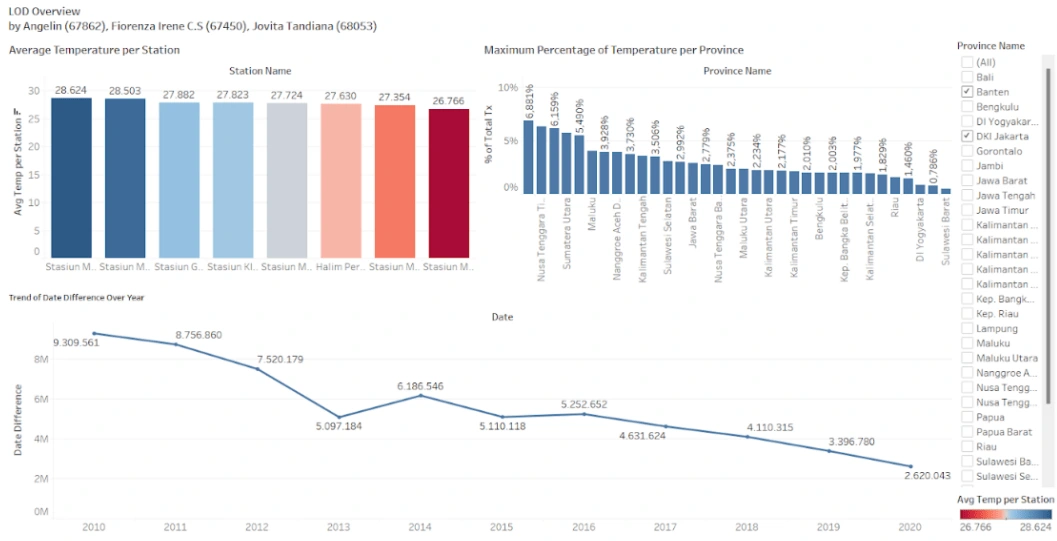
Here are the interactive dashboards:
Like this project
Posted Jun 3, 2024
Climate Dashboard for Adaptive Agriculture in Indonesia: Analyzing Climate Change Trends and Strategies for Environmental and Agricultural Management, 2010-2020
Likes
0
Views
70