Electric Vehicle Market Analysis Project
Syeda Ramima Rafsana Nadia
Electric Vehicle Market Analysis Project
Overview
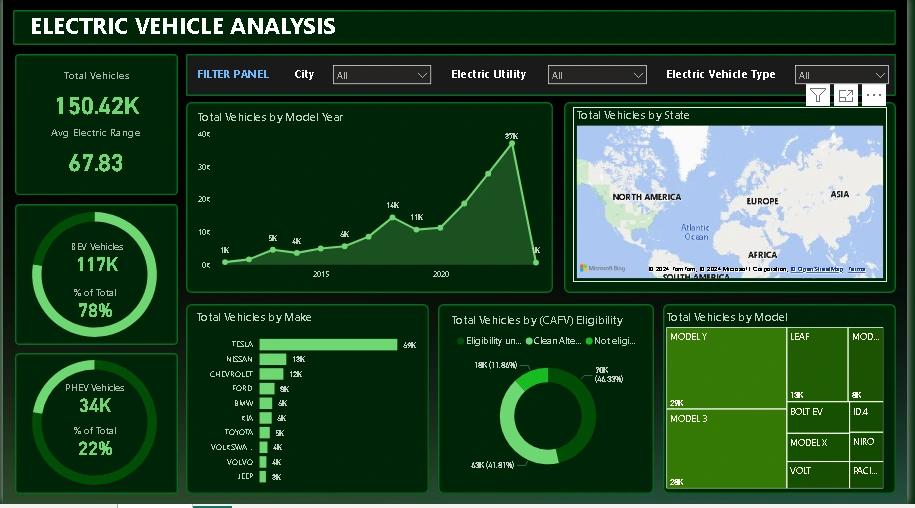
This project provides an in-depth analysis of the electric vehicle (EV) market, focusing on the distribution, growth trends, technological advancements, and the impact of Clean Alternative Fuel Vehicle (CAFV) incentives. The analysis covers both Battery Electric Vehicles (BEVs) and Plug-in Hybrid Electric Vehicles (PHEVs), offering valuable insights for strategic decision-making.
Tools Used
SQL (MySQL Workbench): Used for data cleaning and preparation, ensuring the accuracy and consistency of the dataset.
Microsoft Excel: Utilized for initial data exploration and creating basic visualizations.
Power BI: Employed to create detailed, interactive dashboards and visualizations for deeper analysis.
Key Metrics Analyzed
Total Vehicles: Assessed the overall landscape of EVs, including BEVs and PHEVs, to understand market size and growth trends.
Average Electric Range: Evaluated the average electric range of EVs to gauge technological progress and efficiency.
Total BEV Vehicles & % of Total BEV Vehicles: Analyzed the total number of BEVs and calculated their percentage relative to the total EV market.
Total PHEV Vehicles & % of Total PHEV Vehicles: Analyzed the total number of PHEVs and their market share within the overall EV landscape.
Visualizations Created
Total Vehicles by Model Year (From 2010 Onwards): Line/Area Chart illustrating EV distribution by year, showing growth patterns and adoption trends.
Total Vehicles by State: Map Chart showcasing the geographical distribution of EVs across different states.
Top 10 Total Vehicles by Make: Bar Chart highlighting the top 10 EV manufacturers based on the total number of vehicles.
Total Vehicles by CAFV Eligibility: Pie/Donut Chart illustrating the proportion of EVs eligible for CAFV incentives.
Top 10 Total Vehicles by Model: Tree Map highlighting the top 10 EV models based on the total number of vehicles.
DashBoard
Business Impact
The analysis provides valuable insights into the EV market's growth, regional adoption rates, and consumer preferences. This information can aid companies in making informed decisions regarding product development, marketing strategies, and the strategic use of incentives to enhance market share.
How to Use
Download the
.pbix file and open it in Power BI to explore the interactive dashboards.Refer to the
.pdf file for a summary of key findings and visualizations.Contact
For any questions or further discussion, feel free to contact me at ramima19rs@gmail.com. You can also connect with me on www.linkedin.com/in/syeda-ramima-rafsana-nadia-5704681b5
Like this project
Posted Sep 6, 2024
This project provides an in-depth analysis of the electric vehicle (EV) market, focusing on the distribution, growth trends, technological advancements.
Likes
0
Views
9
Clients
Personal Project