Built with Rive
Geoint - Interactive infographic
Bartek Radziejewski
End-to-end Data Infrastructure - interactive infographic
The task was to create multi-level animated infographic to illustrate Geospatial Intelligence in action - extracting deep, micro-level insights
Animations consists of 3 different levels with variety of unique animations.
Some of the animations are only visible while zoomed in adding another factor for the user to explore the infographic.
I was responsible for design and animations on that project
Micro-animations done for the website
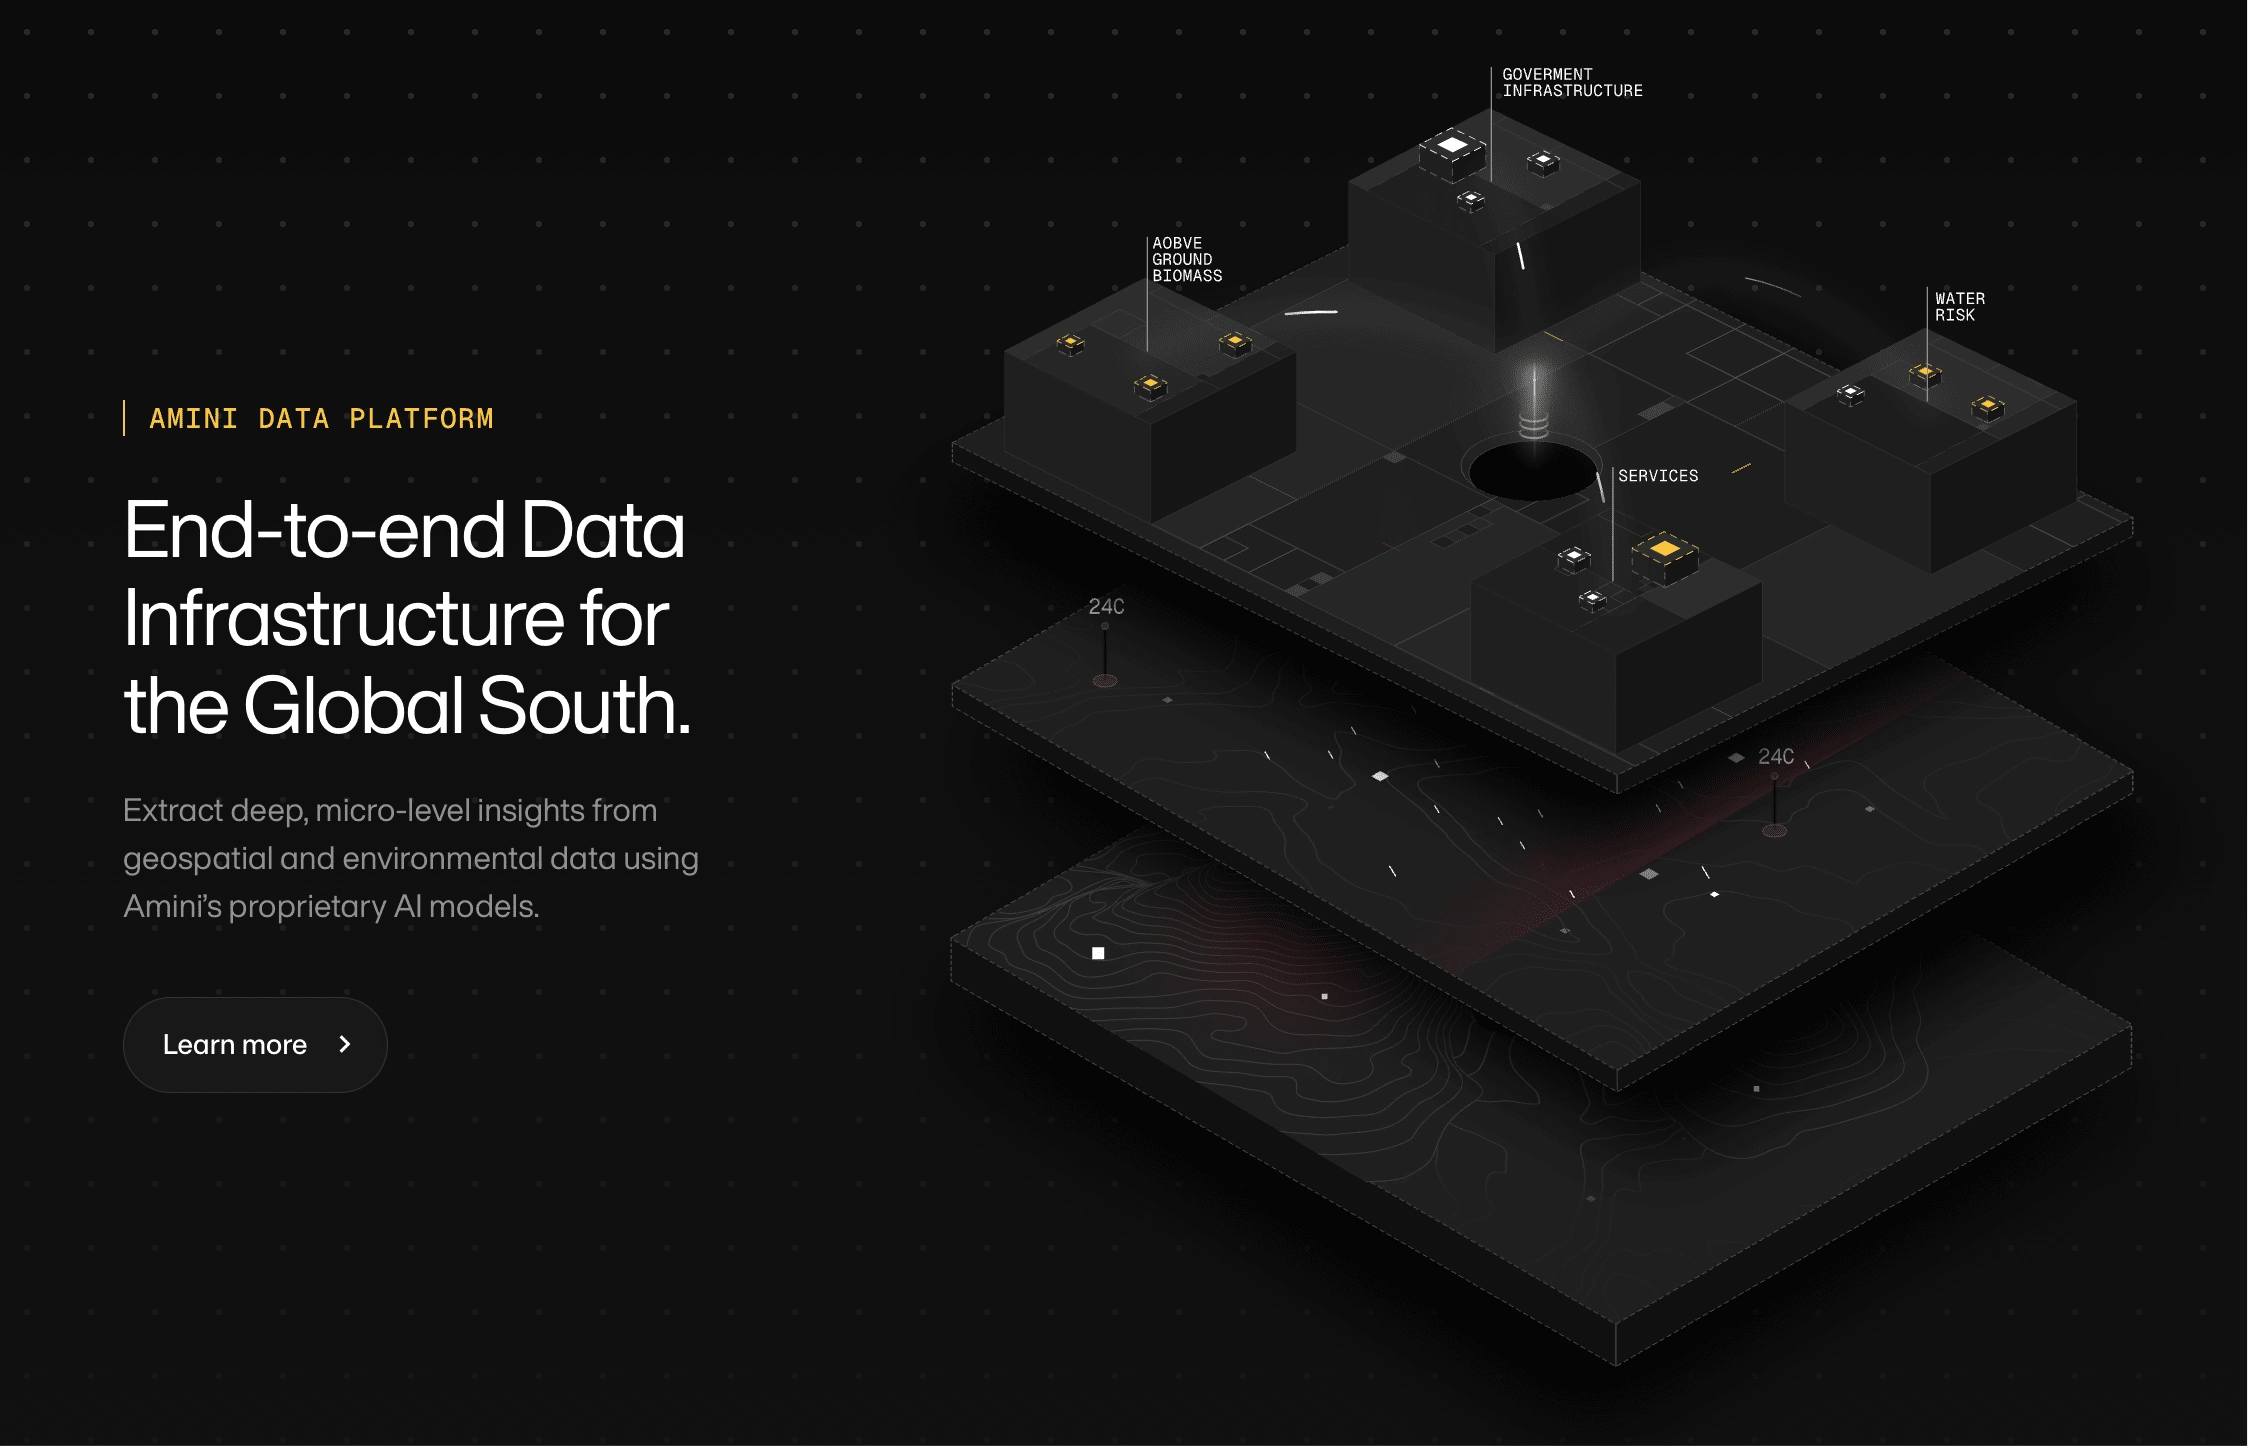
Illustration sits on the website
Like this project
Posted Mar 27, 2025
The task was to create multi-level animated infographic to illustrate Geospatial Intelligence in action - extracting deep, micro-level insights
Likes
120
Views
1.8K
Timeline
Jan 1, 2025 - Jan 31, 2025