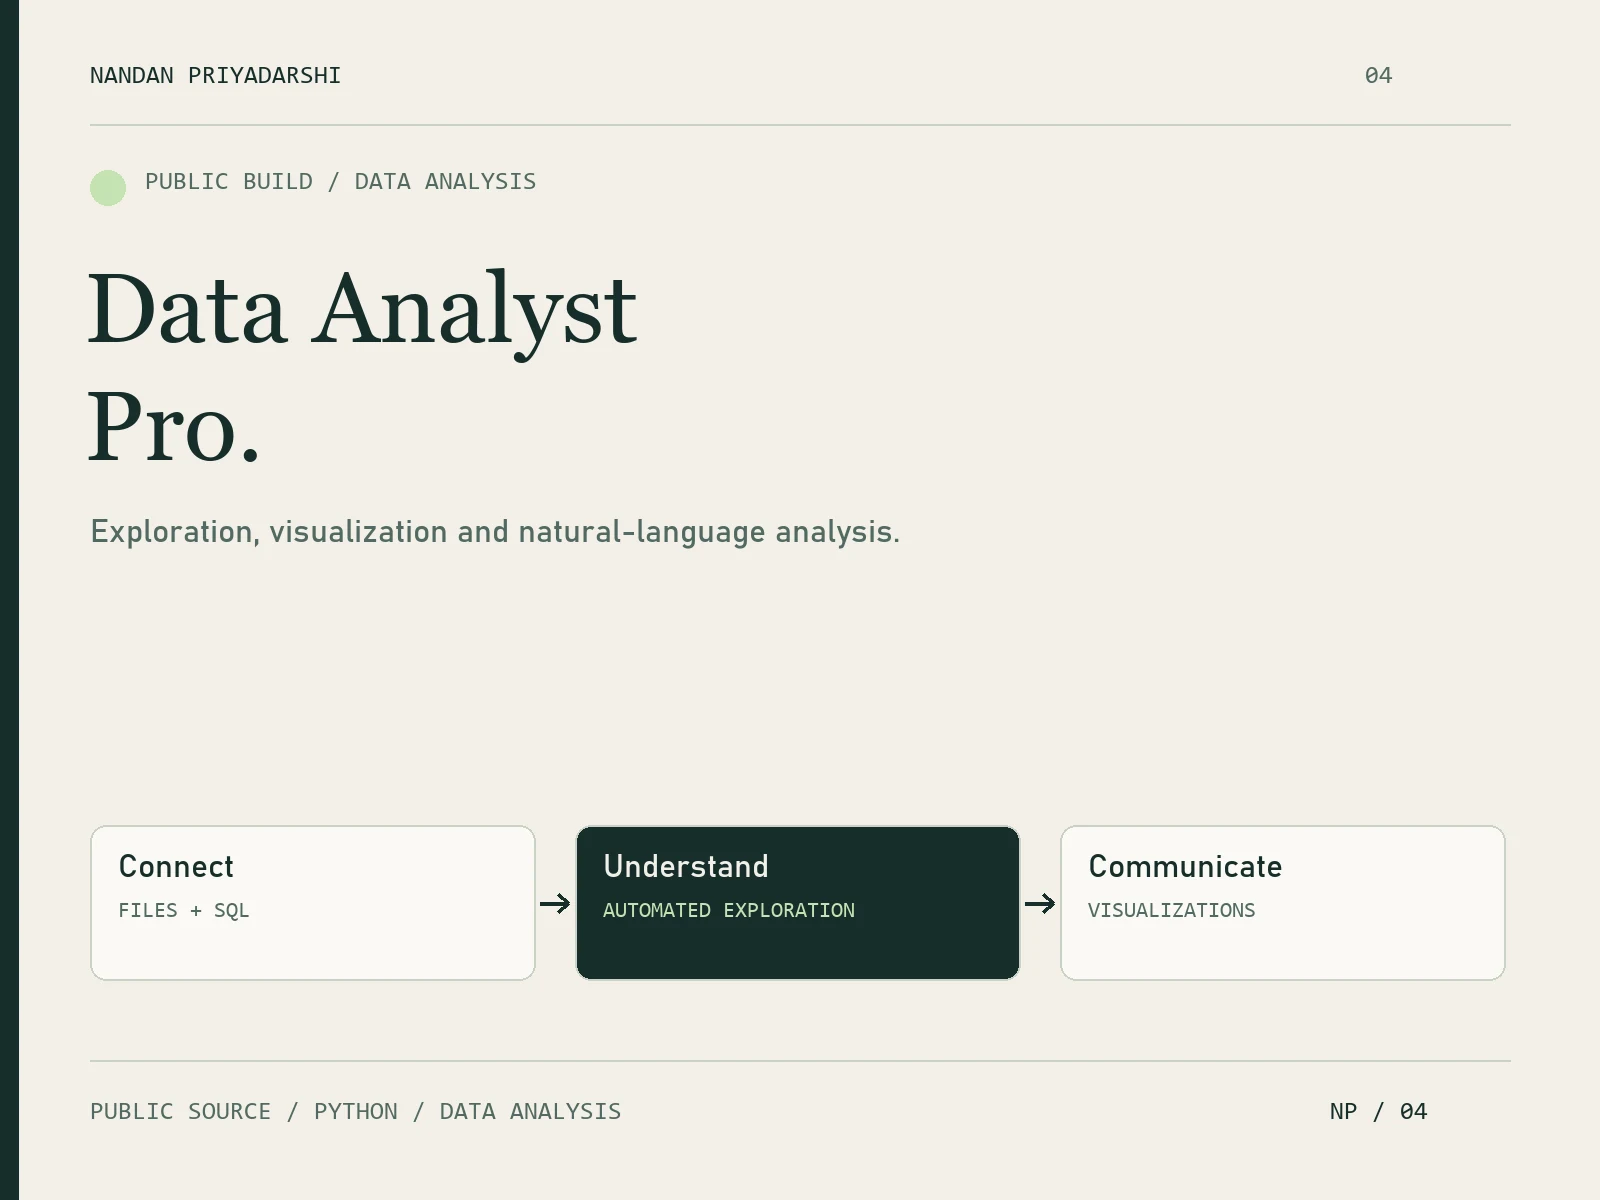
Data Analyst Pro: Reusable AI Analysis Workflows

Nandan Priyadarshi


The problem
Recurring CSV, Excel and SQL analysis often starts with rebuilding the same checks, charts and reporting steps. I created Data Analyst Pro to package those steps into a reusable workflow an analyst or AI coding agent can inspect and rerun.
What I built
My role: Python analytics toolkit and agent-workflow development. The package brings together instructions, runnable analysis scripts, chart templates and report templates, with examples to show how the pieces fit.
The workflow
A typical flow is to profile a dataset, review missing values and outliers, clean agreed issues, generate charts and build a Markdown report. Separate scripts handle analysis, visualization, cleaning and reporting; the package also includes a SQL query runner.
Why it matters
The output is a repeatable path from raw tables to a reviewable analysis: statistics, quality findings, visualizations and a written report. Keeping the steps in scripts makes the workflow adaptable to recurring business questions and future datasets.
Project context
Independent public project. The linked GitHub repository provides source code, dependencies, command examples, sample data and an example analysis. These artifacts show the implementation and help a team evaluate how it would fit its own reporting process.
Need to standardize a recurring analysis? Send the business question, file format or database, and the report your team needs. I can scope a first milestone around one dataset, an agreed set of checks and a reviewable output.
Sample output — generated from the repository’s included 99-row sample dataset. The chart below shows mean order amount by category; it is demonstration data.
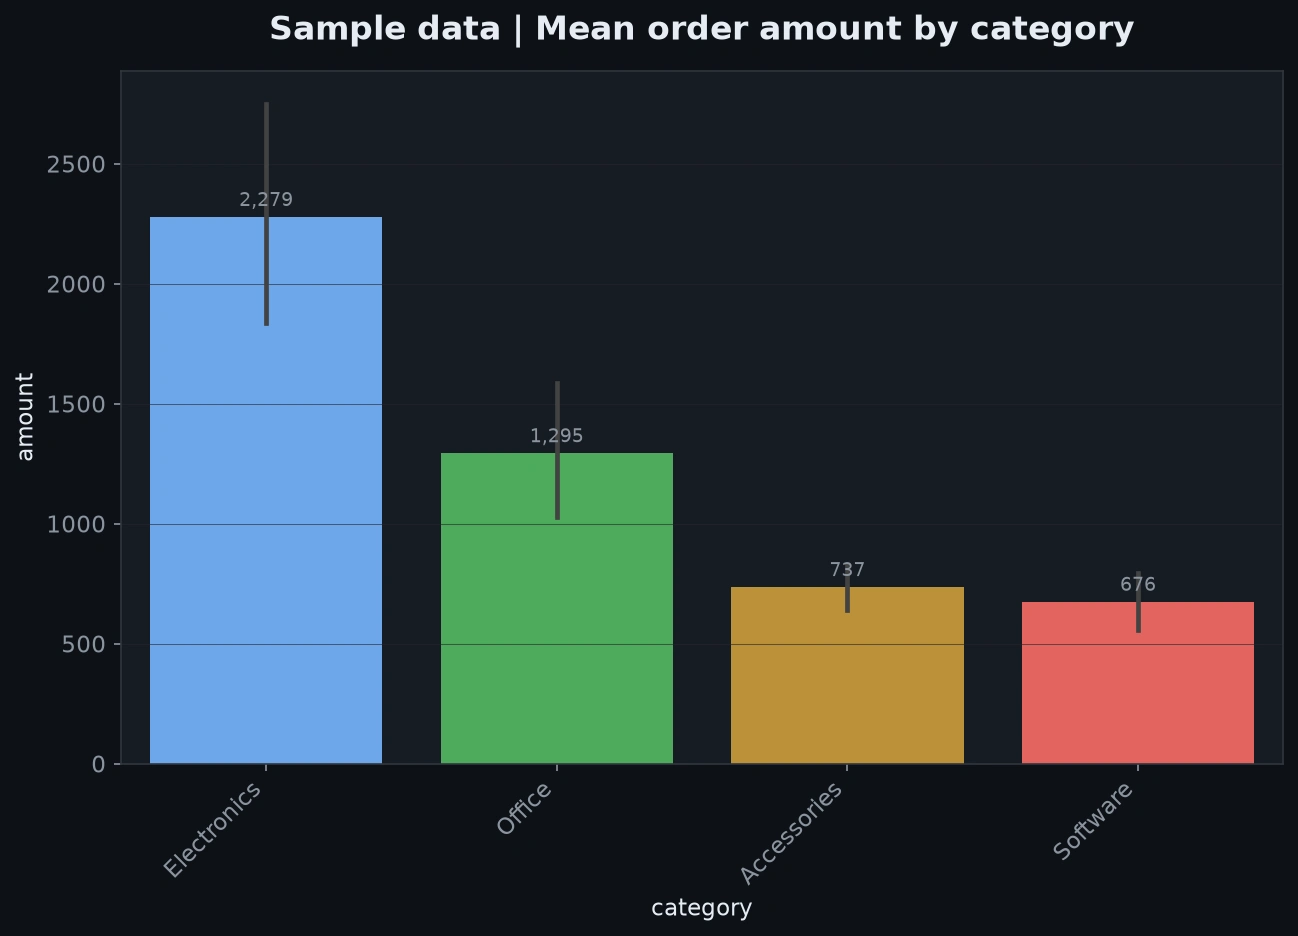
Actual output from Data Analyst Pro visualize.py using the repository’s 99-row sample dataset. Demonstration data; error bars are the chart generator’s default interval.
Like this project
Posted Oct 22, 2026
Reusable Python analytics workflow: data profiling, quality checks, charts, SQL queries and Markdown reports, with public source and sample outputs.
Likes
0
Views
1