
Overview
An independent educational sample using synthetic prices. It is not a real portfolio, a forecast or investment advice, and it is not a client project.
Objective
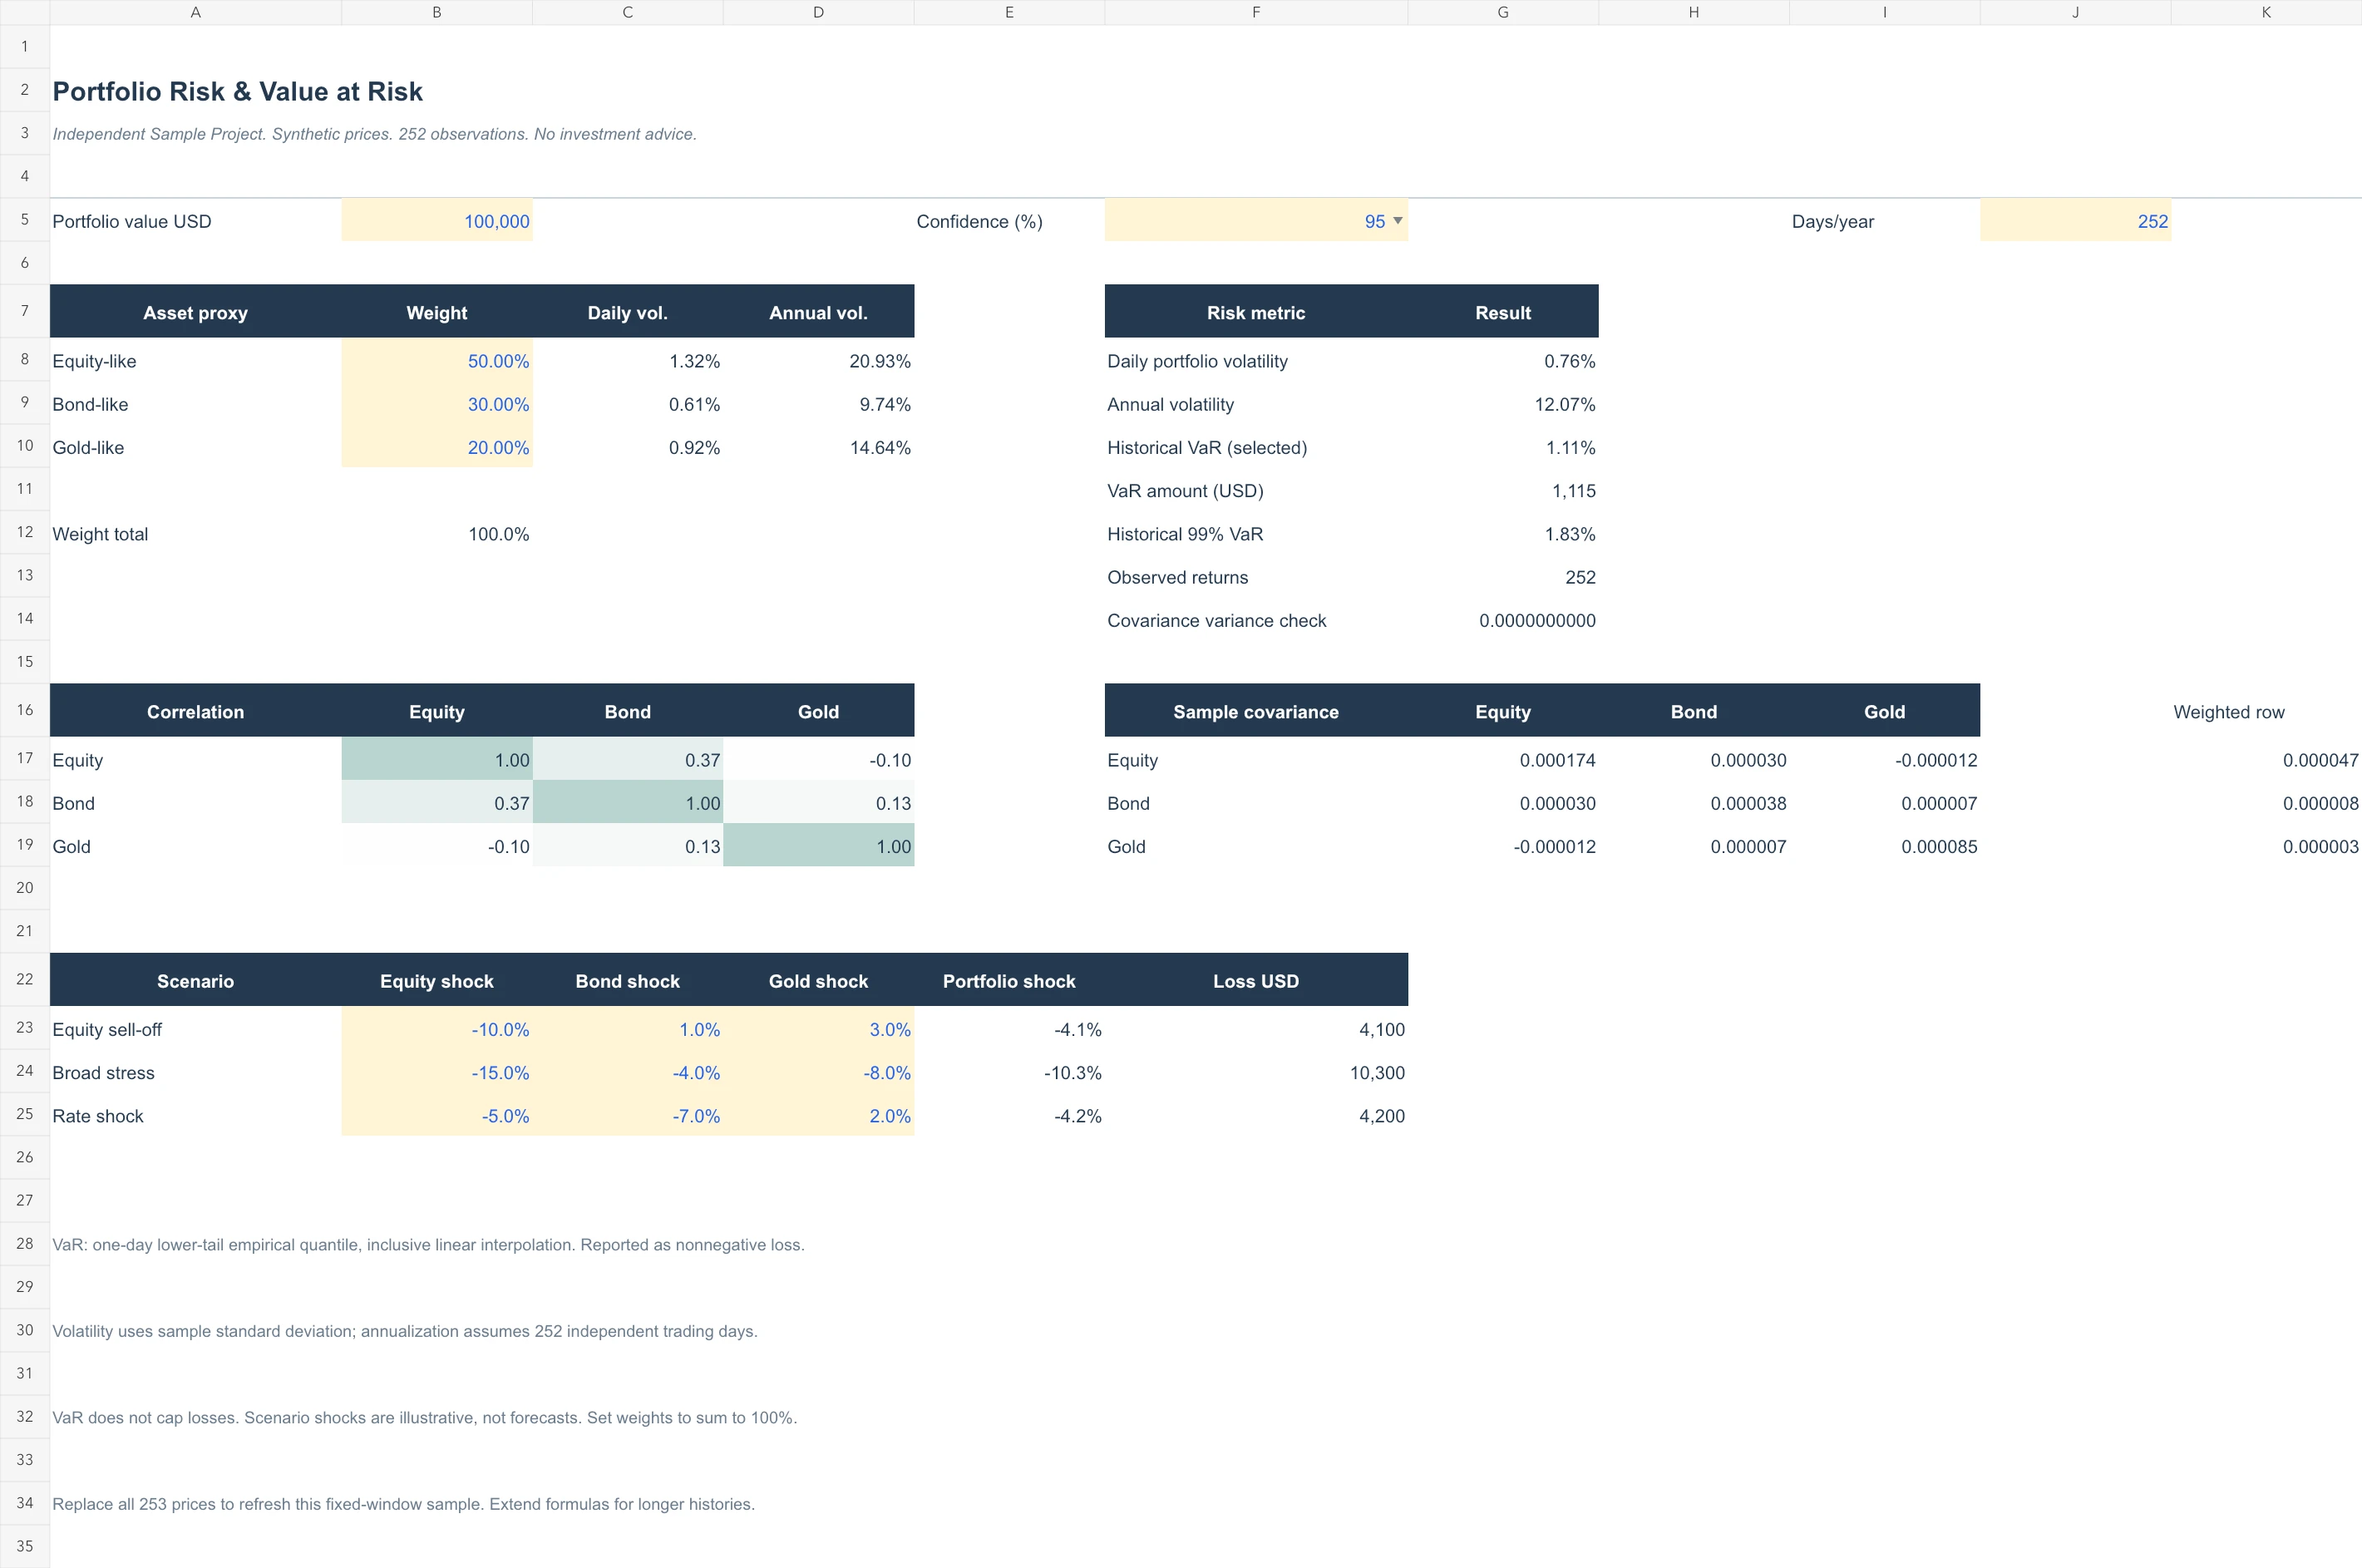
Calculate portfolio risk measures in a spreadsheet where the weights, confidence level and portfolio value can be changed.
My role
I defined the model scope and the method, built the workbook and methodology note with AI-assisted tooling, and reviewed the results. The calculations were cross-checked with an AI-assisted Python script.
Approach
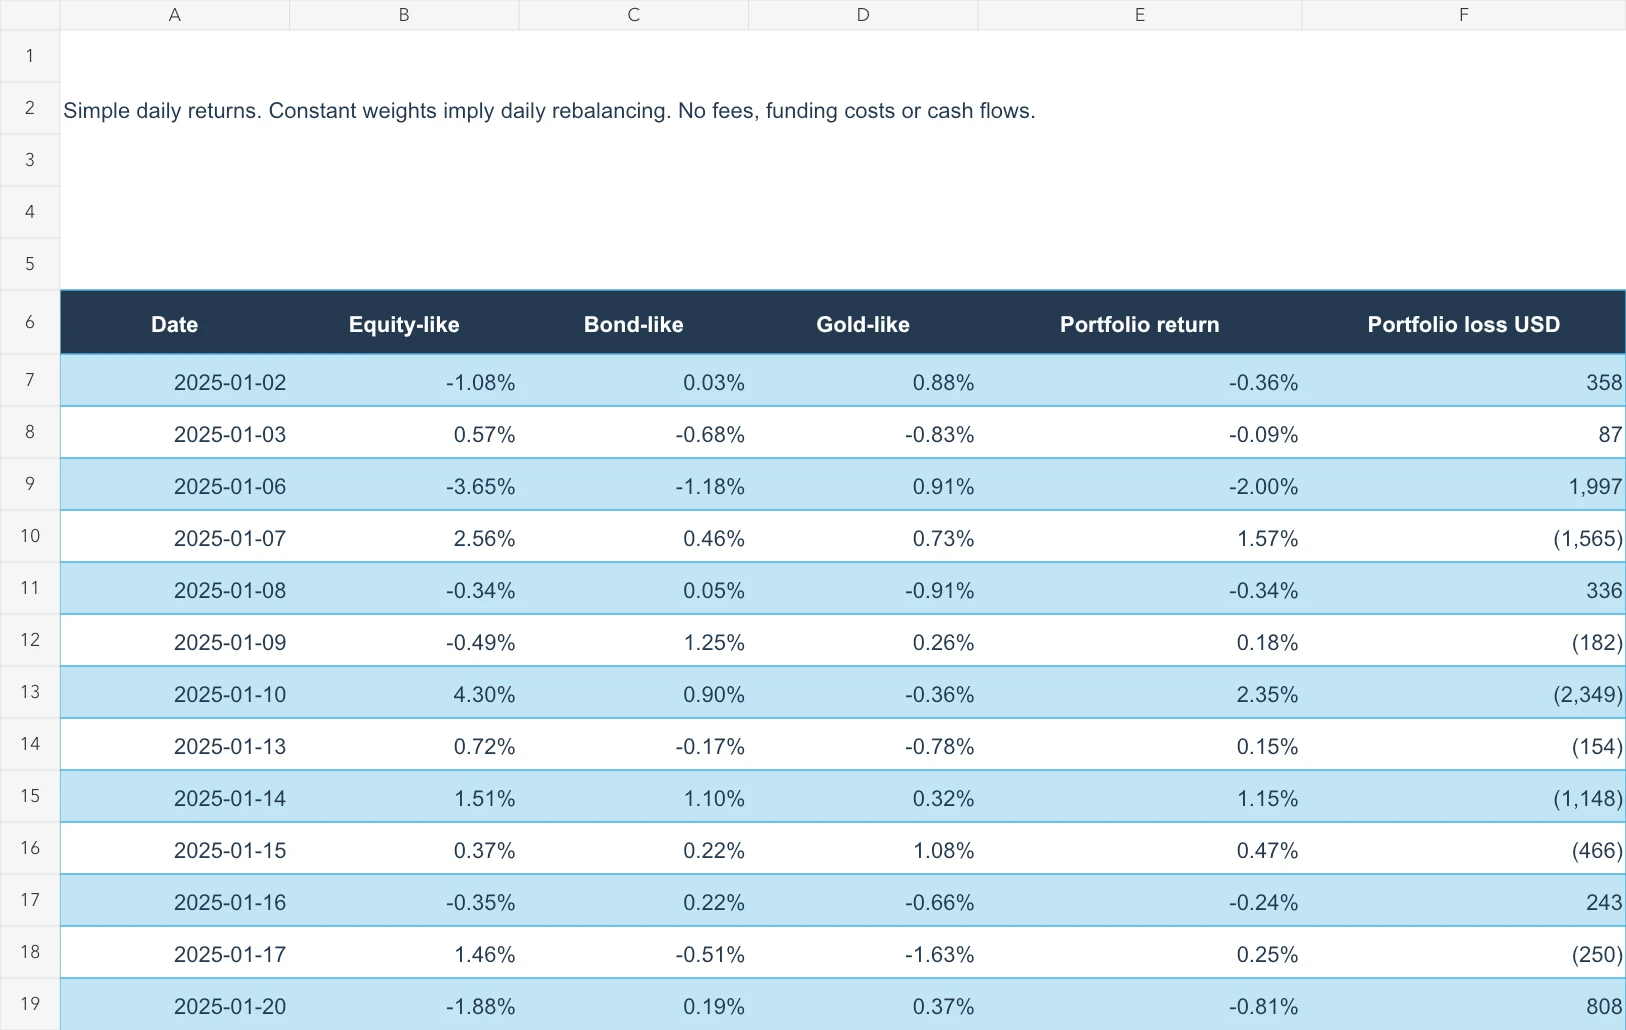
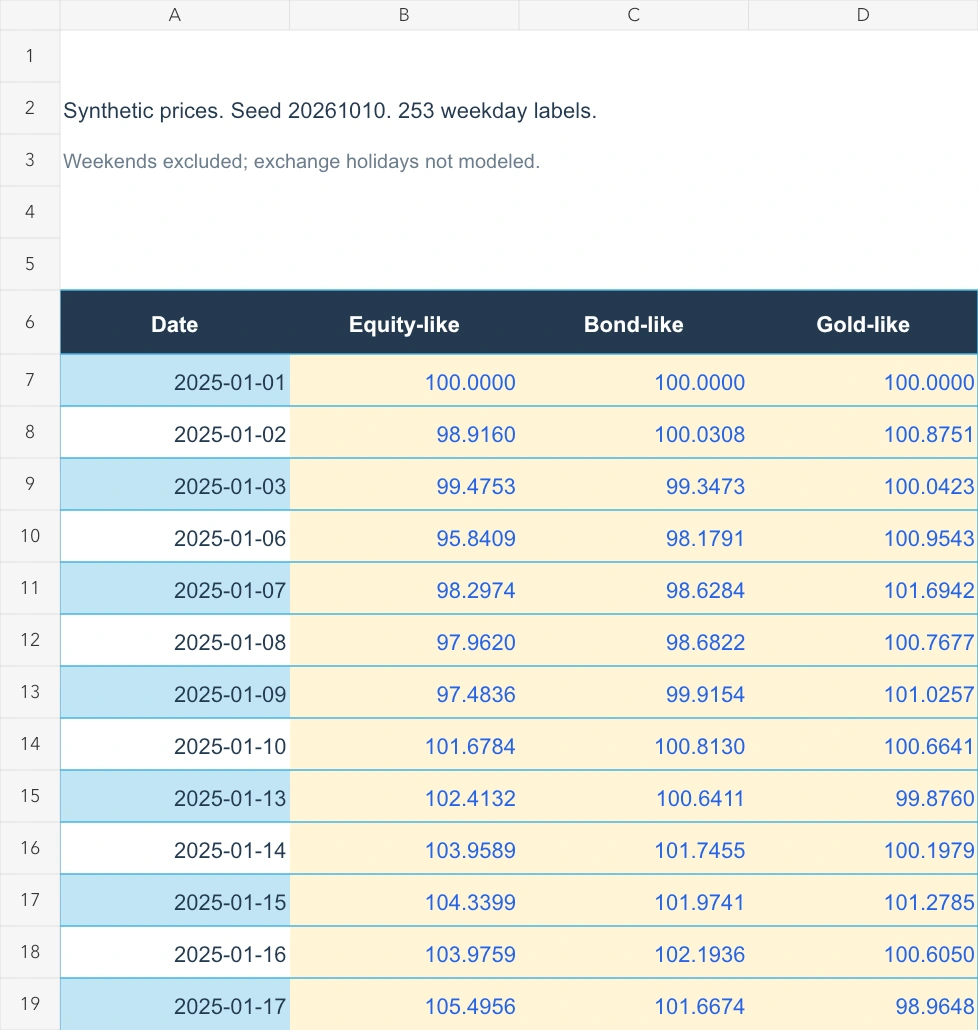
252 daily returns for three asset proxies (equity-like, bond-like, gold-like) feed calculations of sample volatility, correlation, covariance, one-day historical 95% and 99% VaR and three illustrative stress scenarios.
Tools
Microsoft Excel; PDF methodology note; AI-assisted build and checks.
Deliverables
One workbook with prices, returns and analysis sheets, and a PDF explaining the quantile method, the annualization assumption and the limits of the model.
Results
Volatility, correlation, covariance and VaR matched the independent check, and input changes recalculated correctly. VaR does not cap losses, and the scenario shocks are illustrative rather than forecasts.
0 likes · 0 views · Oct 11, 2026
Independent sample: three-asset Excel risk model with volatility, correlation and historical 95%/99% VaR. Synthetic prices.
