B2B SaaS Writing Samples | Product Analytics

Danil Molodkin

Product analytics, explained clearly
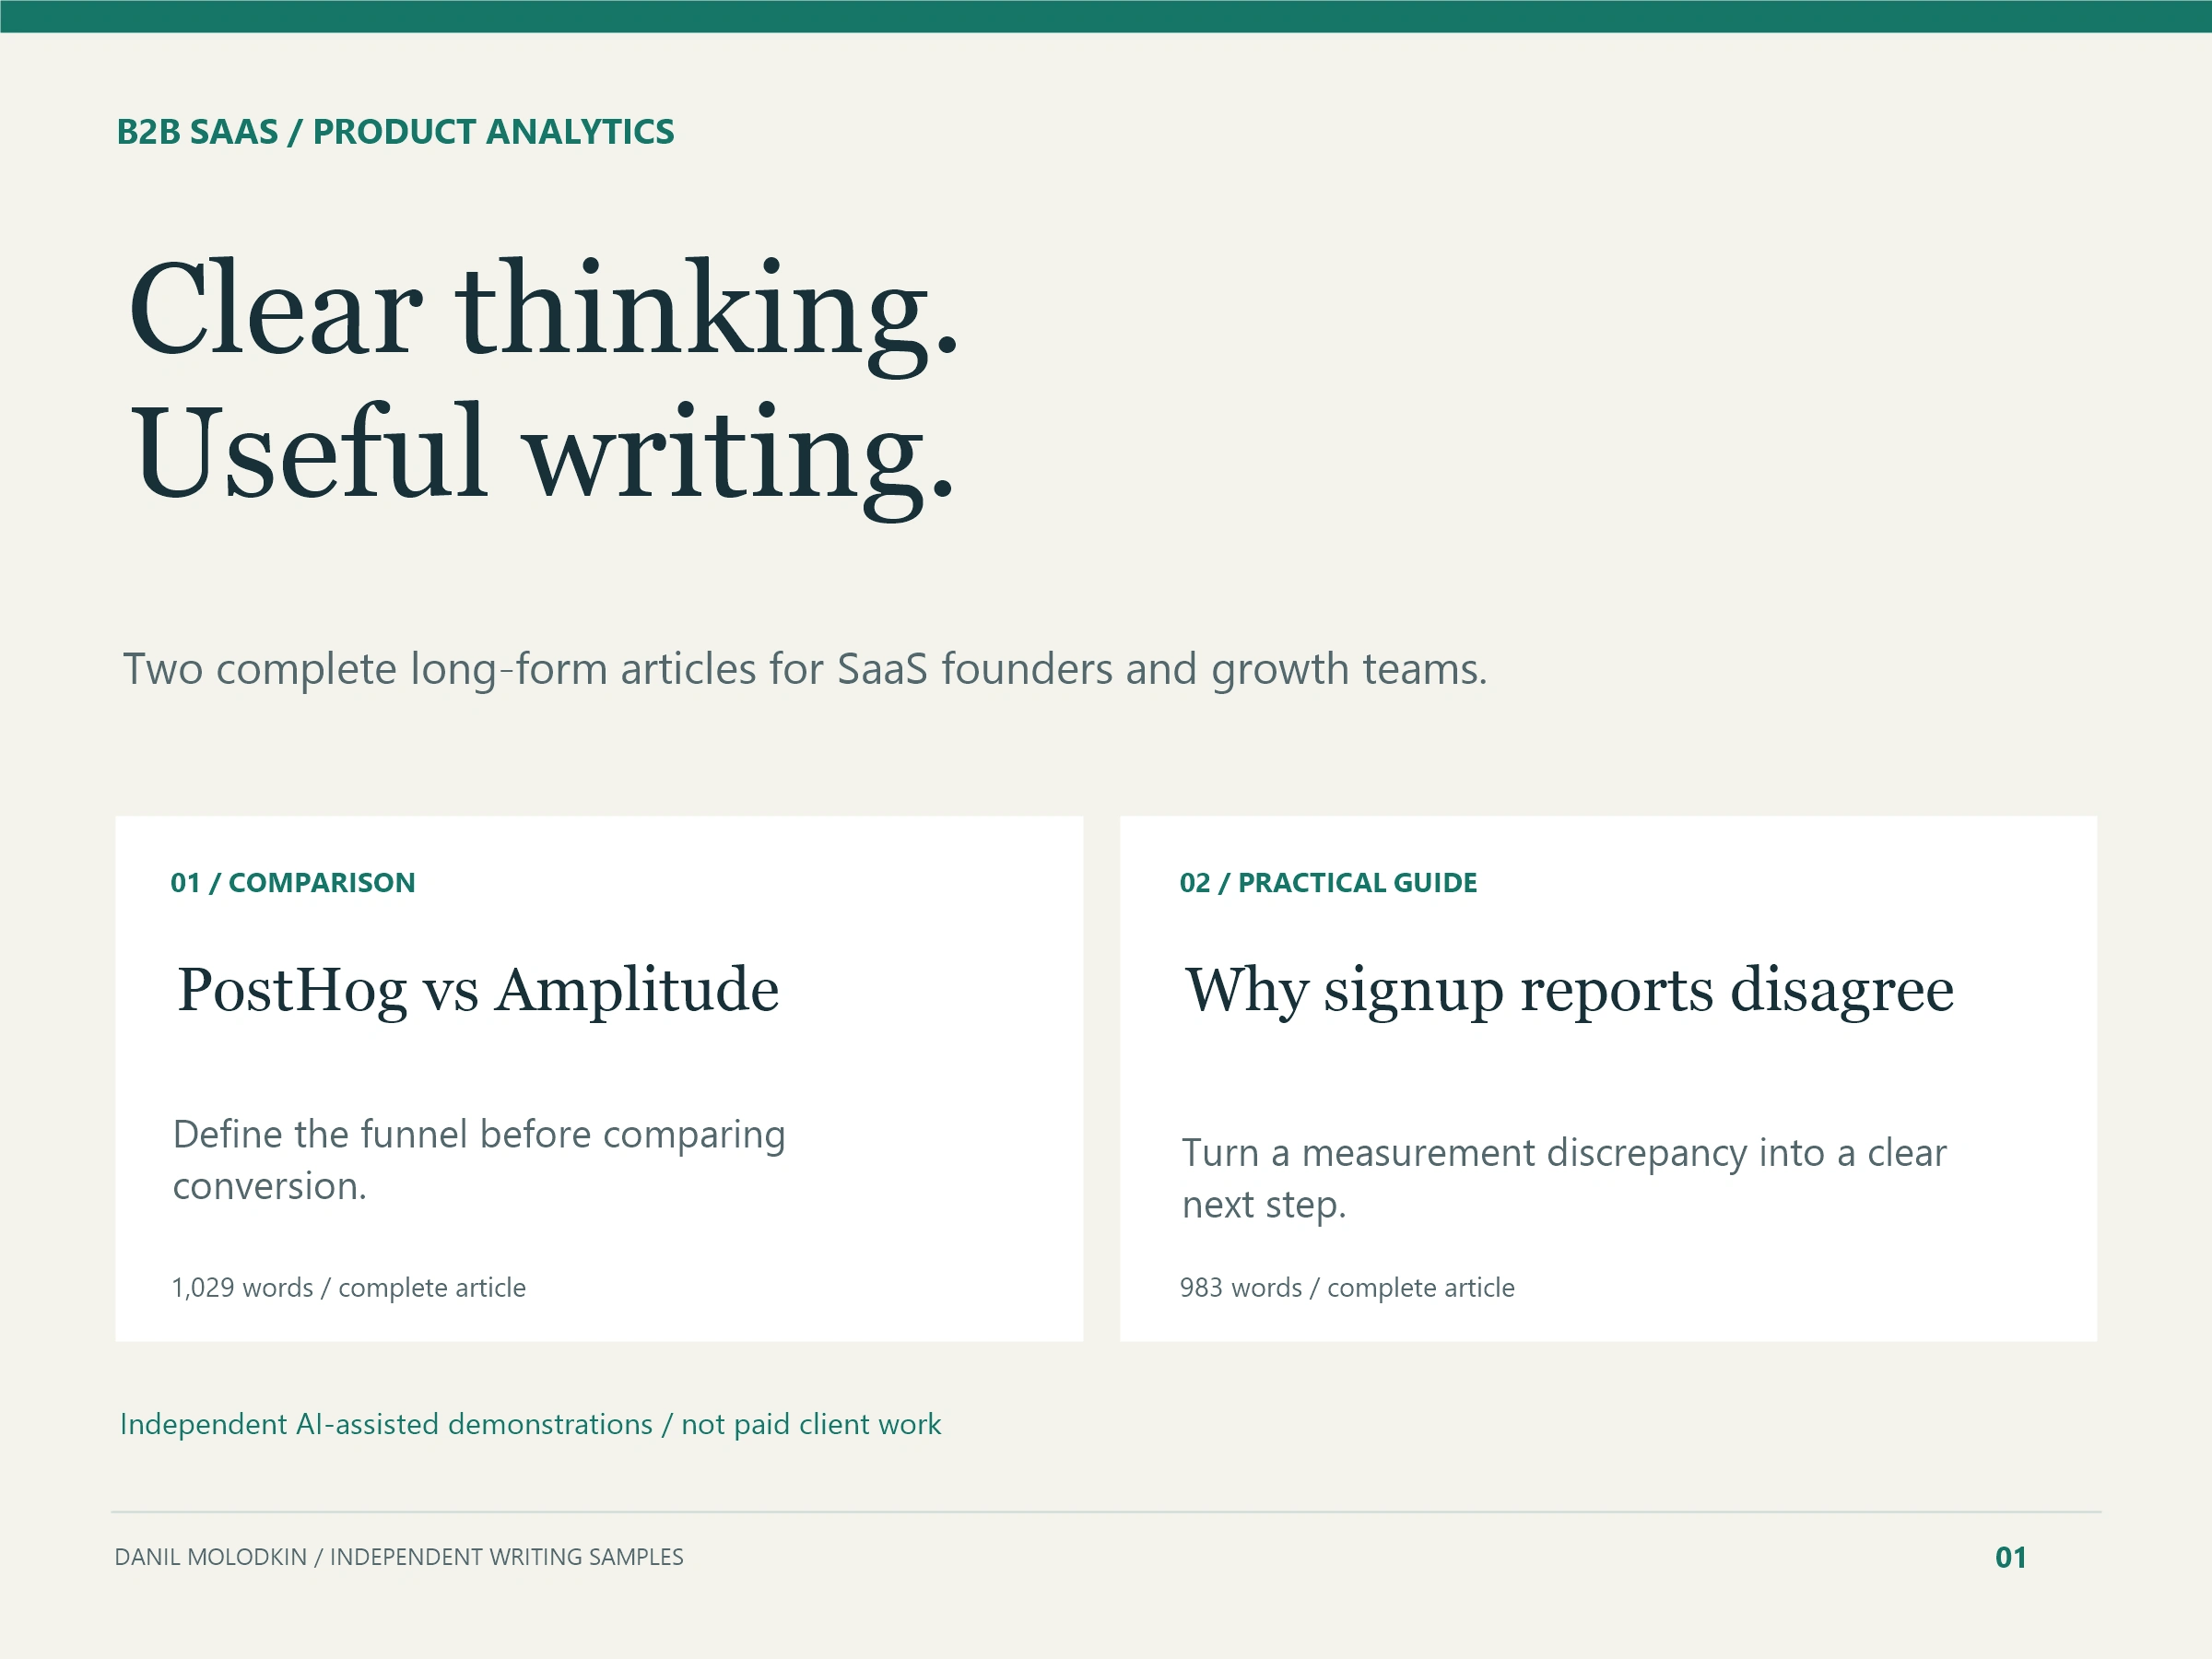
Two complete long-form articles for B2B SaaS founders and growth teams. The brief was to explain funnel measurement, compare relevant product concepts, and give readers practical next steps.
Deliverables: a 1,029-word PostHog and Amplitude comparison and a 983-word guide to reconciling signup reports. Both complete articles, including their source links, appear below.
Approach: define the reader's problem, distinguish documented product facts from recommendations, and organize the explanation around concrete decisions.
Independent AI-assisted demonstrations created for synthetic briefs and checked on 18 October 2026. These are not paid client projects.
Complete articles
PostHog vs Amplitude: Define Your SaaS Funnel Before Comparing Conversion
Demonstration sample. AI-assisted writing; independently checked. No client commission or results are claimed.
Choosing between PostHog and Amplitude becomes harder when your signup reports disagree. A founder sees one conversion rate, a growth lead sees another, and the discussion turns into a tooling debate before anyone has established what each report counts.
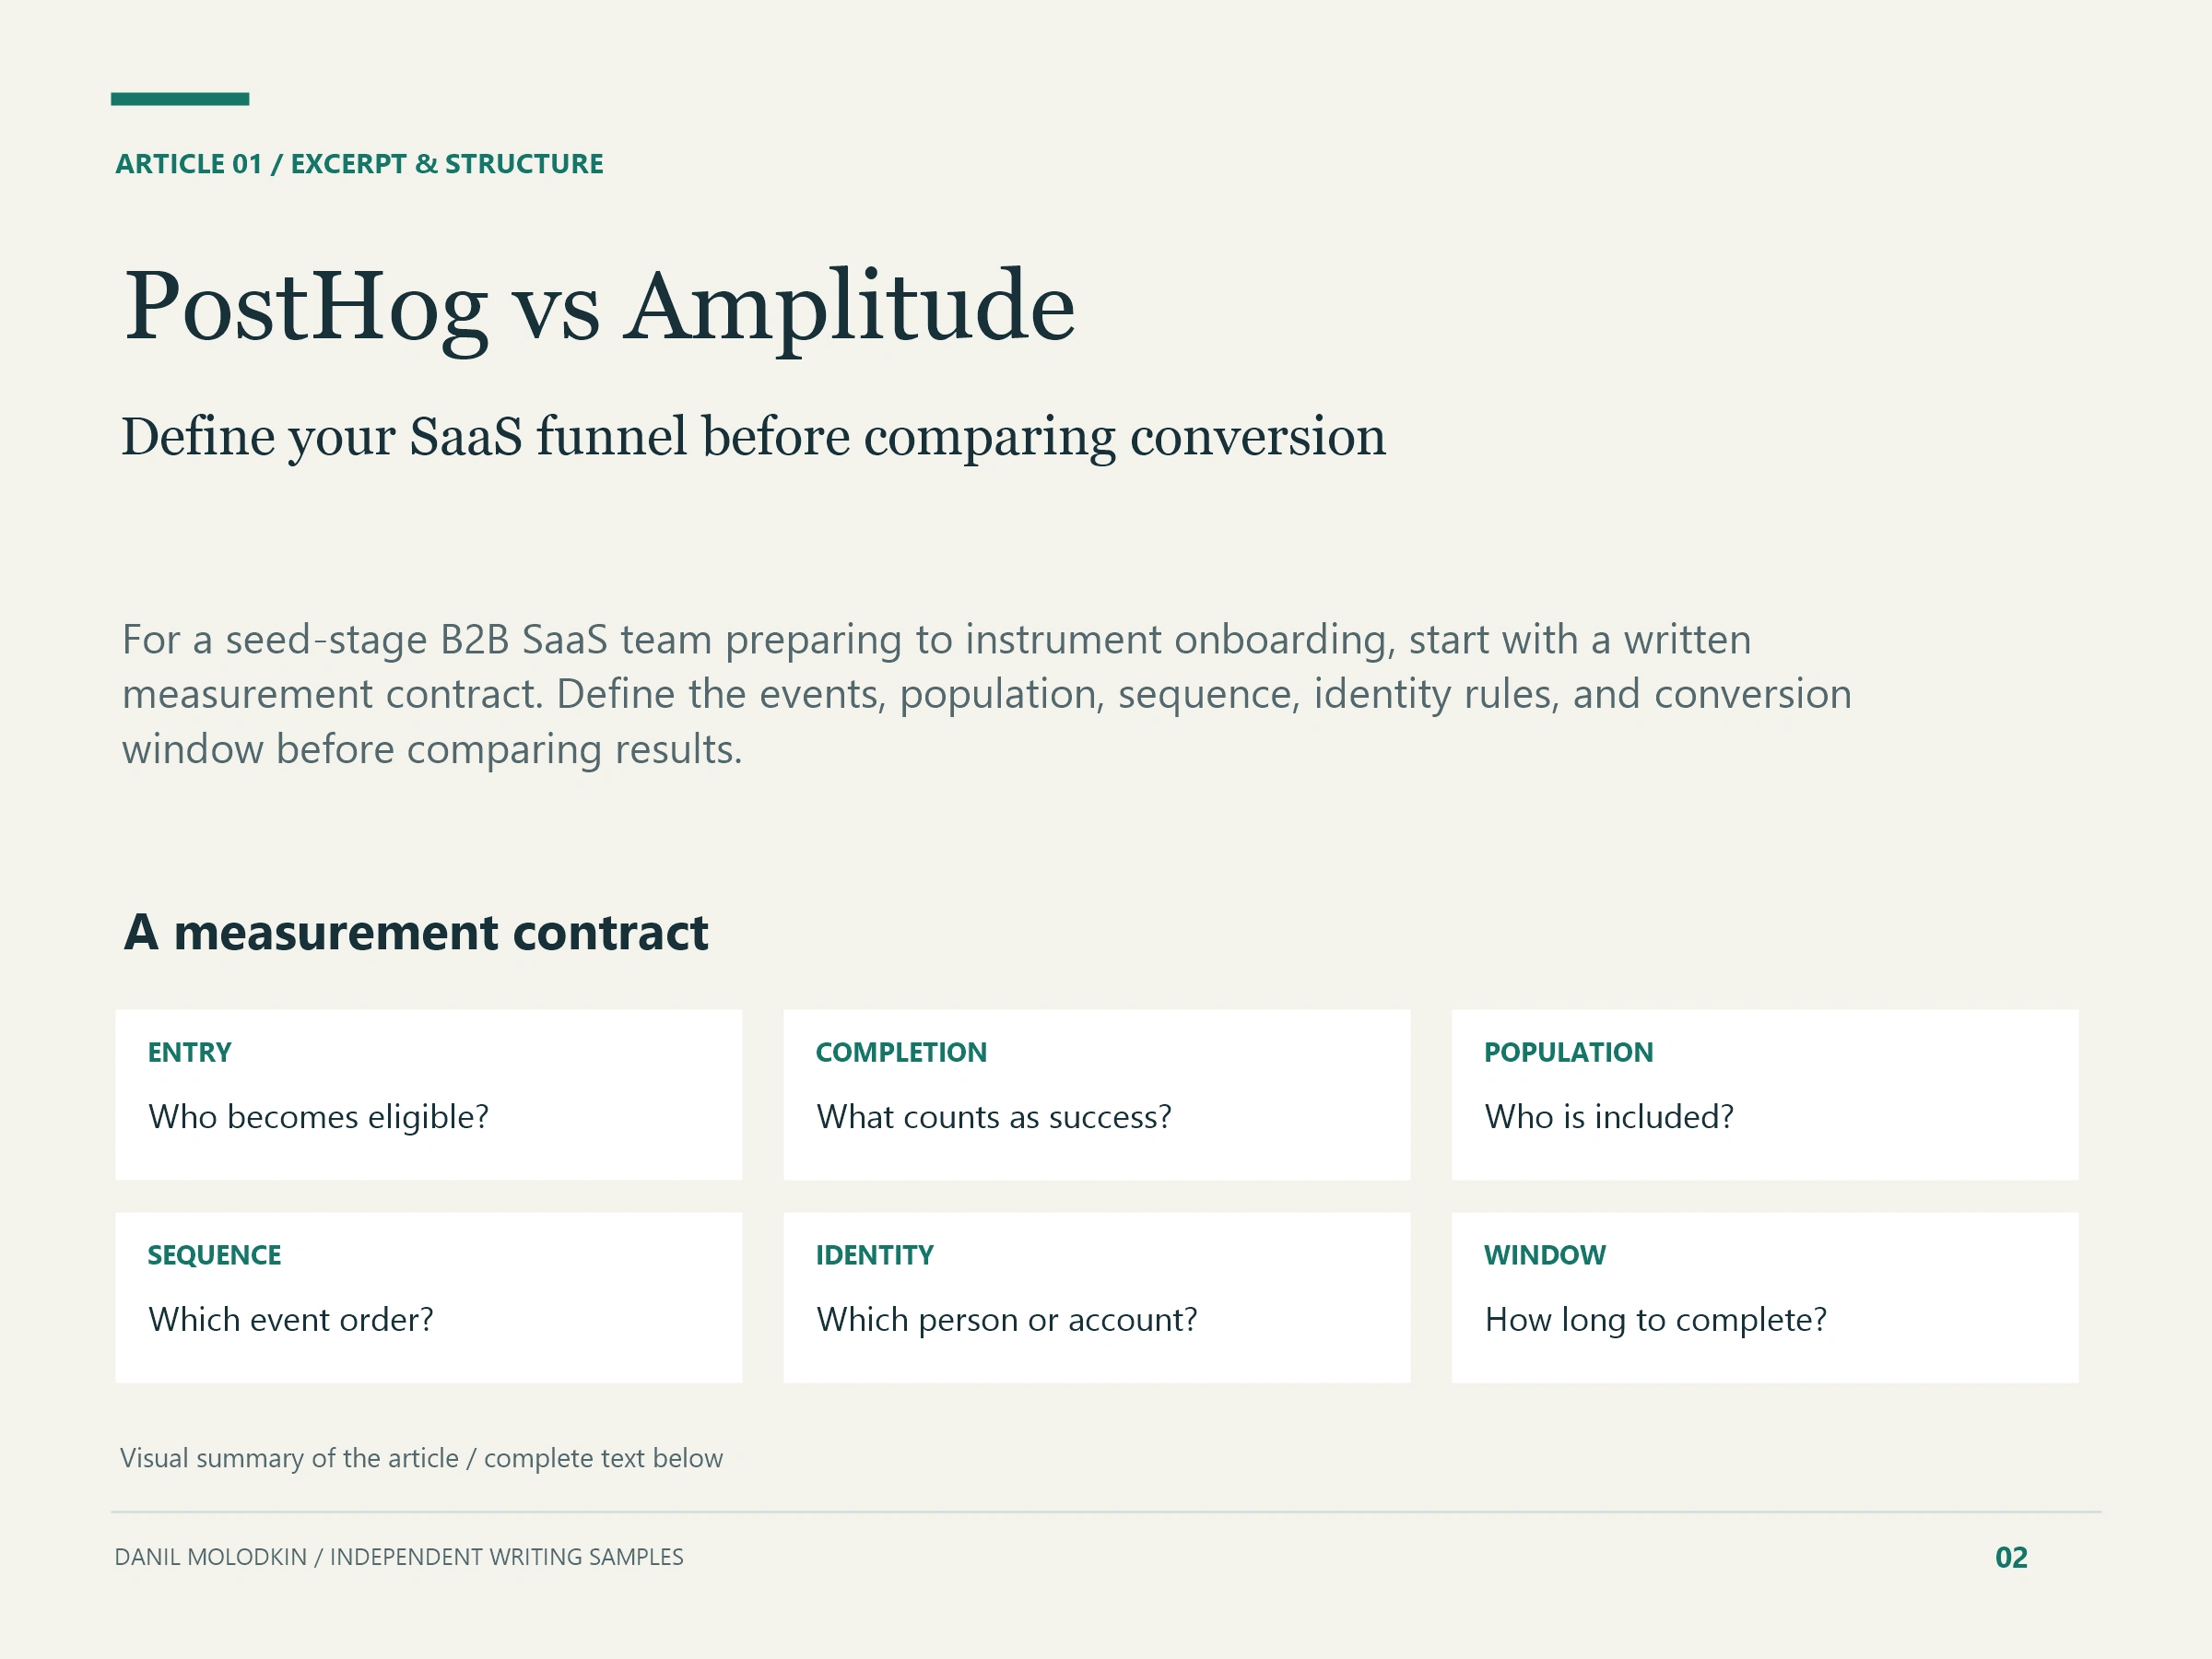
For a seed-stage B2B SaaS team preparing to instrument onboarding, start with a written measurement contract. Define the events, population, sequence, identity rules, and conversion window before comparing results. Otherwise, you risk evaluating two different questions under the same dashboard label.
The product comparisons below use the supplied documentation facts. The implementation recommendations are general analytics advice, not claims about either vendor's undocumented capabilities.
Write the funnel contract before adding events
Start with a decision: what onboarding behavior would justify changing the experience? A hypothetical team might want to understand whether new signups reach their first meaningful setup milestone. That is more actionable than asking whether onboarding is performing well.
Write down a short contract before implementation:
Entry: the precise action that makes someone eligible for the funnel.
Completion: an observable action with an agreed business meaning.
Population: which users belong in the analysis, including exclusions.
Sequence: whether completion must follow entry and which interruptions are acceptable.
Identity: how anonymous activity and authenticated activity should relate.
Window: how long an entrant has to complete the sequence.
Treat event names as labels, not definitions. Specify what causes an event to fire, which properties it carries, and what should happen on retries. This makes the contract useful to both the person implementing tracking and the person interpreting the chart.
PostHog: inspect completion, timing, and trends
PostHog funnels analyze progression through a defined set of events, making completion and drop-off the relevant questions. Its documented views include conversion steps, time to convert, and historical trends. Those perspectives can support different parts of an onboarding investigation.
Use the step view to locate the transition you want to investigate. Examine time to convert when the question concerns how long completion takes. Review historical trends when comparing periods, while keeping the underlying definition consistent. These are investigative starting points; a chart alone does not establish why users stopped.
Before building a comparison, review the funnel documentation and record the settings used. A screenshot without the measurement contract leaves the next reviewer guessing about the denominator and timing.
PostHog also distinguishes trends, funnels, and paths as forms of insight. Use the guide to choose an insight when deciding whether your question concerns activity, progression, or navigation. Agree on the question before selecting the report.
Amplitude: make ordering an explicit decision
Amplitude's documented ordering modes illustrate why similarly named funnels can answer different questions. Any order checks for the listed events without requiring their sequence. This order preserves the specified sequence while permitting other events between steps. Exact order excludes intervening events.
Consider a hypothetical journey: signup, settings visit, setup completion. If your selected steps are signup and setup completion, permitting intervening events fits a question about eventual progression. Excluding them fits a narrower question about an uninterrupted sequence. Neither interpretation should be chosen simply because it produces a more encouraging number.
Amplitude funnel charts also support counting unique users or event totals. A repeated action can matter differently under those units. Before comparing outputs, write the counting unit beside the chart title and verify that everyone interprets it the same way.
These documented options establish useful evaluation questions. They do not, by themselves, establish that either product is more accurate or better suited to your implementation.
Reconcile populations and identity before judging conversion
A segmentation chart and a funnel can disagree without either being broken. Amplitude's documentation explicitly notes that these reports can select different populations. Investigate who qualifies for each report before treating a mismatch as evidence of missing tracking.
As general practice, inspect a small set of example journeys. Include a straightforward completion, a repeat signup attempt, and a journey that starts anonymously before authentication. These are proposed test cases, not observed customer behavior. Check whether each example belongs in the numerator and denominator under your contract.
If you use Amplitude's option to hold a property constant, its documentation requires that property on every funnel event. Check the instrumentation against that requirement before relying on the resulting analysis. A property present at signup should not be assumed to exist later.
For either evaluation, ask the implementer to explain the identity rules using concrete event traces. The supplied facts do not establish vendor-specific identity behavior, so verify that separately before making a purchasing decision.
Give every cohort its full conversion window
A signup from this morning has had less opportunity to finish onboarding than one from last week. As a general measurement principle, comparing those groups without accounting for observation time can distort your interpretation of recent performance.
PostHog documents a Hide incomplete periods option that removes recent periods whose conversion window has not finished. Decide whether that treatment matches your reporting question, and make the choice visible when sharing results.
Separately document the entry-date range and the allowed time to complete. They describe different boundaries. When investigating a discrepancy, align both before discussing whether conversion improved. If an early read is necessary, label it as incomplete and avoid presenting it as a settled outcome.
Choose through a controlled onboarding evaluation
Evaluate PostHog and Amplitude using the same written contract and a small, deliberately constructed set of journeys. Work through the expected inclusion and completion decisions manually, then compare those expectations with the configured reports. Investigate disagreements at the event level before drawing a vendor conclusion.
For broader investigation, keep the resource to explore user paths alongside your funnel notes. An observed route can suggest a follow-up question; test that question before treating the route as an explanation.
Choose based on how confidently your team can implement, explain, and maintain its intended analysis. The supplied facts support specific workflow comparisons, not a universal winner. Before purchasing or expanding instrumentation, have an engineer and a growth lead independently review the same contract and example journeys. A defensible conversion number begins with a shared definition.
Why Your SaaS Signup Funnel Disagrees With Your Event Dashboard
Demonstration sample. AI-assisted writing; independently checked. No client commission or results are claimed.
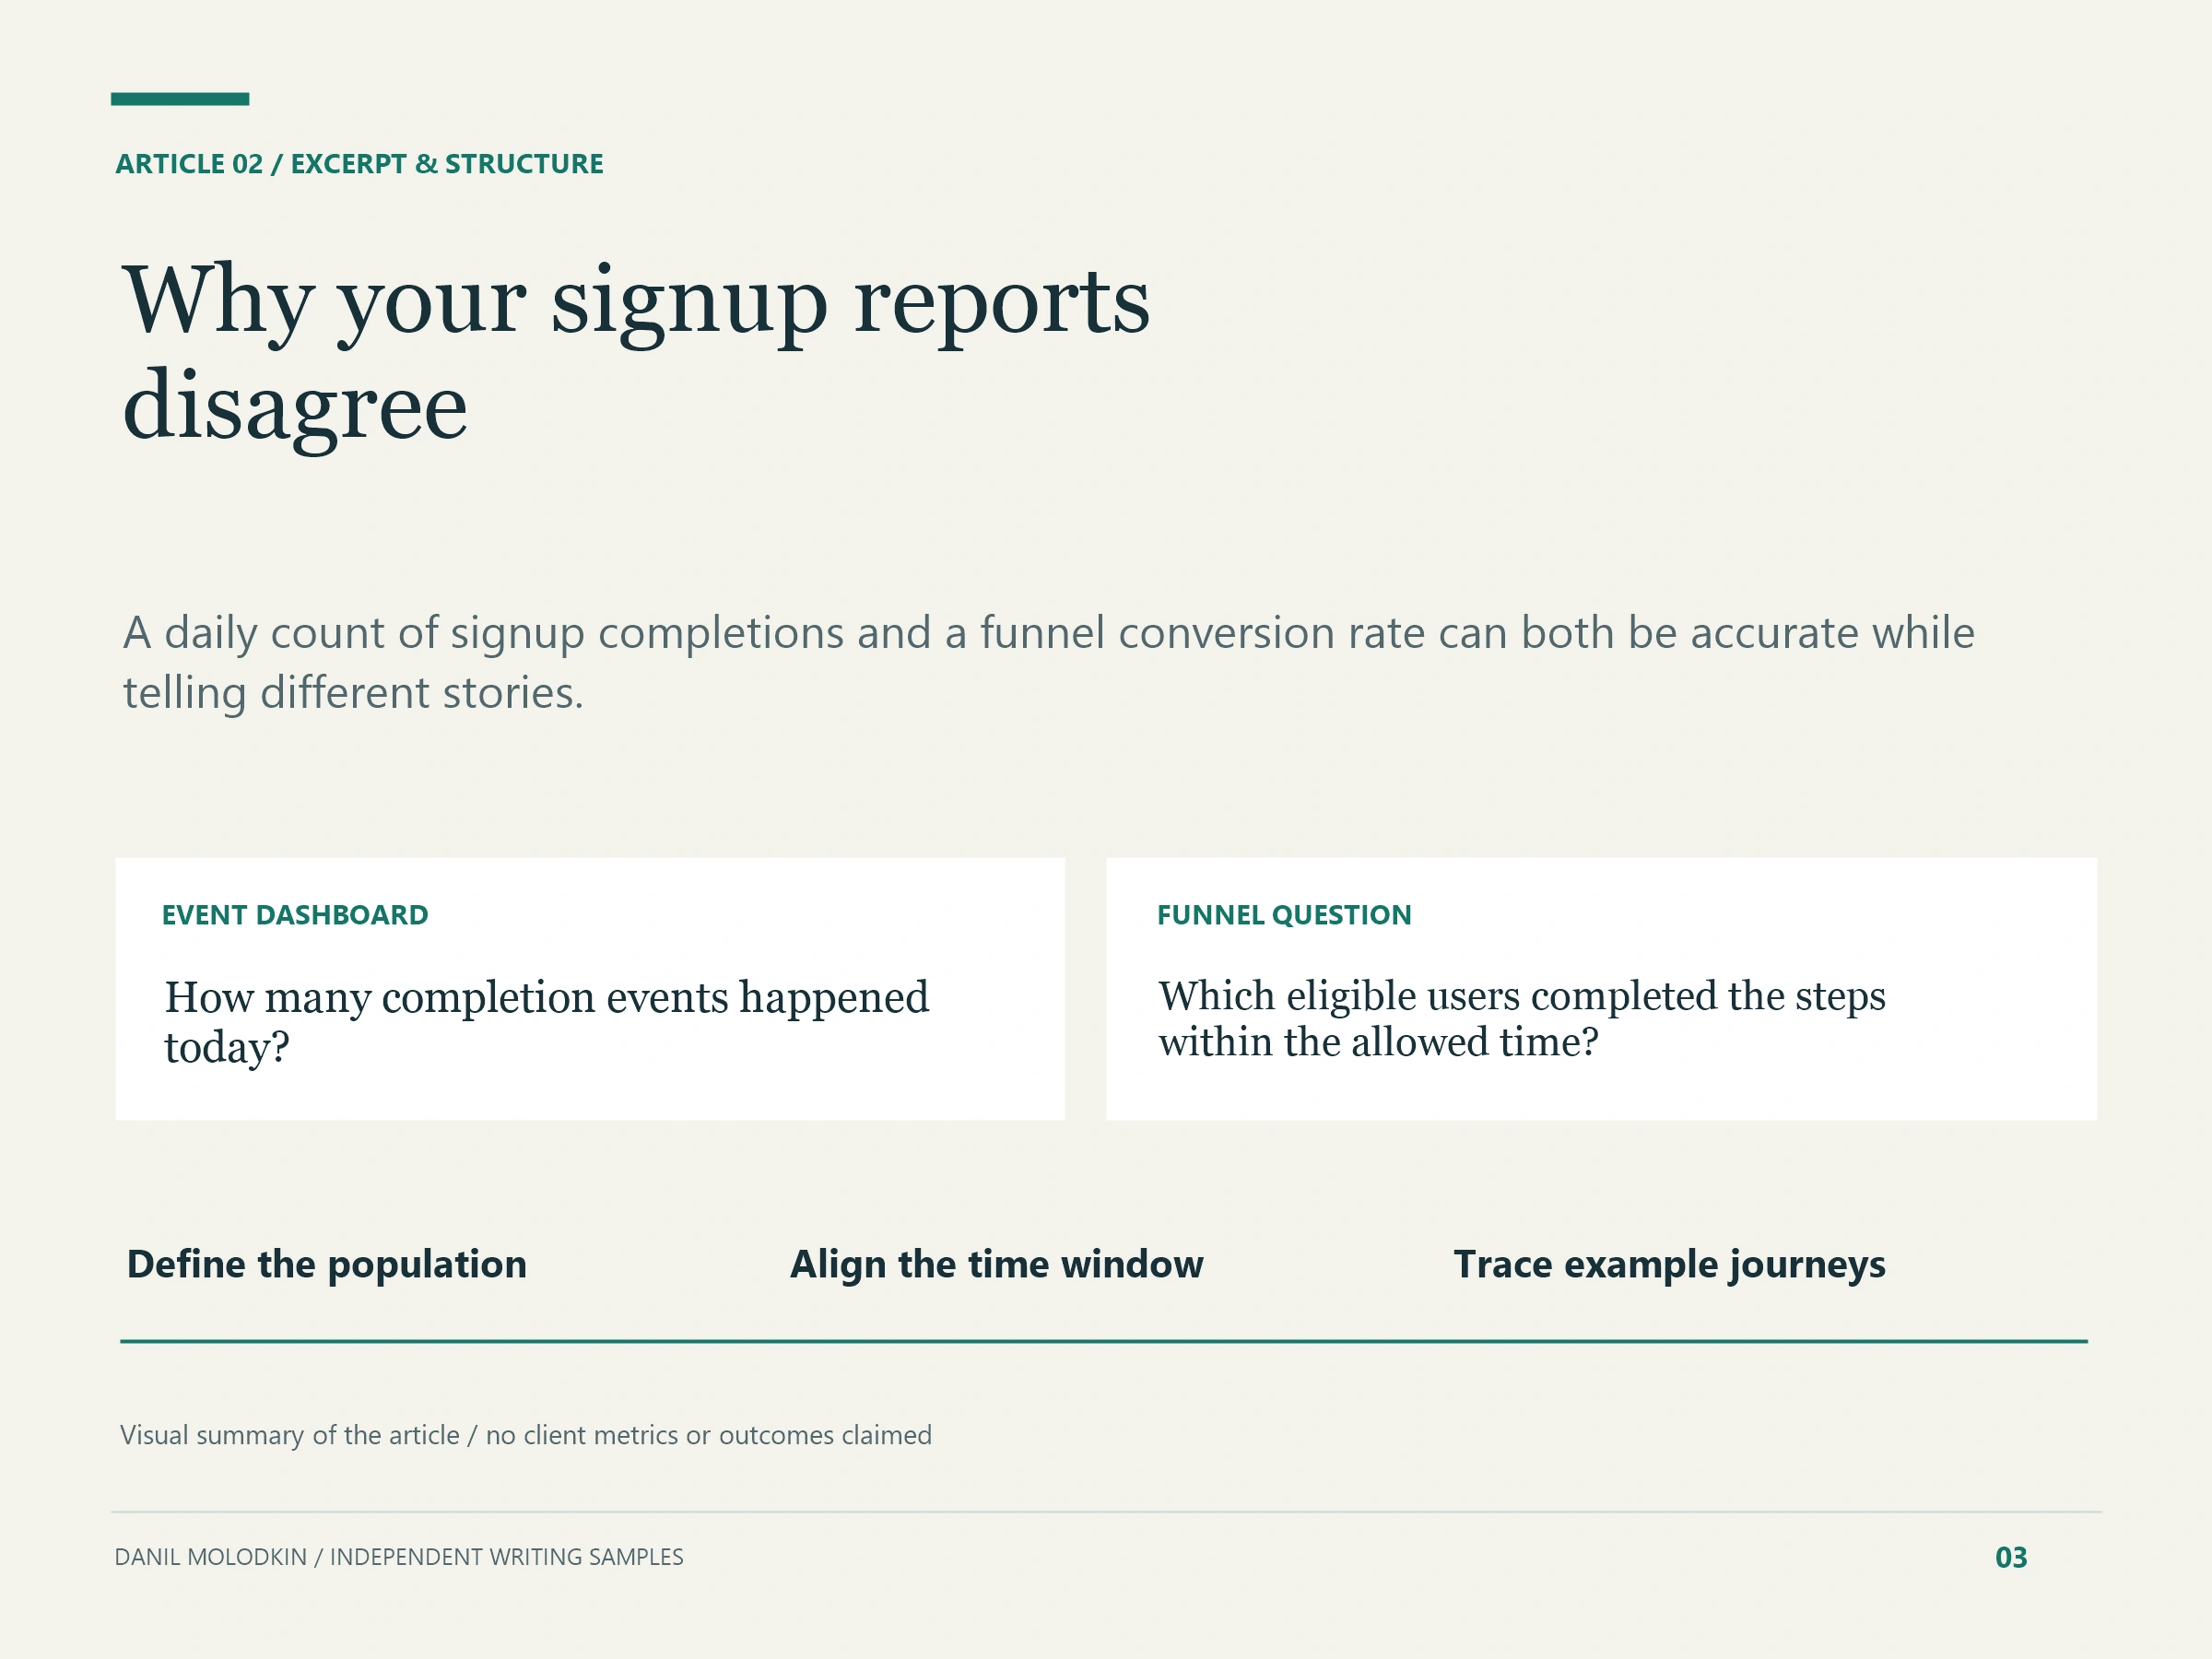
Your signup funnel reports a conversion drop, but the daily event dashboard looks steady. Before changing onboarding or reallocating acquisition spend, establish whether those charts answer the same question. A daily count of signup completions and a funnel conversion rate can both be accurate while telling different stories.
For a B2B SaaS growth lead, the immediate decision is practical: investigate user behavior, repair measurement, or wait for a cohort to mature. The workflow below helps separate those possibilities. Product descriptions follow the supplied documentation facts; the reconciliation steps are general analytical advice.
Start with the denominator, not the headline
Write each chart's question in one sentence. A daily event chart might ask, “How many signup completion events happened today?” A funnel might ask, “Which eligible users completed the defined signup steps within the allowed time?” Event volume alone cannot establish the answer to the second question.
As a hypothetical example, more people could begin signup while completed signup events remain steady. Conversion could fall without a fall in completion volume. Alternatively, repeated completion events could keep an event total elevated even when fewer distinct people finish. These are diagnostic possibilities, not findings about your data.
Record the numerator, denominator, counting unit, and eligibility rules beside each chart. If those definitions differ, stop treating the displayed values as interchangeable. First decide which definition supports the business decision you need to make.
Build a shared counting contract
Before comparing results, create a short specification that another analyst could reproduce:
The entry and completion events, including their precise names.
Whether the measure counts people or event occurrences.
The eligible population and every filter applied to it.
The required event sequence and treatment of intervening activity.
The reporting dates, timezone, and conversion window.
Any property that must remain constant across steps.
Treat this as a reconciliation worksheet, not a claim that every product exposes identical controls. Verify how each setting applies in the chart you actually use.
Pay particular attention to a completion event filtered by plan, channel, or workspace. As a general instrumentation check, inspect whether the intended properties are present where the analysis needs them. A filter with a familiar label can still select a different population when applied at a different step.
Compare PostHog and Amplitude on the relevant rules
PostHog funnels analyze completion and drop-off across defined events. Its documented views include conversion steps, time to convert, and historical trends. Use the funnel documentation to ground the funnel definition before interpreting a change in the headline rate.
Amplitude's supplied documentation makes order semantics explicit. “Any order” requires the listed events without requiring their sequence. “This order” requires the specified sequence while allowing intervening events. “Exact order” excludes intervening events. A person who browses another screen between signup steps could therefore qualify under one rule and fail another.
Amplitude also documents funnel counting by unique users or event totals. Its event segmentation and funnel charts can select different populations, producing different results. When holding a property constant, that property must exist on every funnel event.
These facts support a configuration comparison, not a ranking of vendors. The supplied material does not establish matching defaults or feature parity. If you compare PostHog with Amplitude, record the actual definitions on each side; similar chart names are insufficient evidence that the calculations match.
Separate event dates from conversion windows
As a general analytical distinction, a daily completion count groups activity by when completion happens. A cohort-based funnel question may instead follow people from their entry into a sequence. Someone who starts on one day and finishes later can contribute to different dates under those approaches. Verify which convention each chart uses.
Recent funnel periods deserve separate attention. PostHog's Hide incomplete periods option excludes recent periods whose conversion window has not elapsed. Without accounting for that window, you risk interpreting unfinished opportunities to convert as evidence of worsening behavior.
Compare mature periods first. Record the date boundaries and allow the full conversion window before judging a recent cohort. If the apparent drop disappears under that comparison, investigate reporting maturity before concluding that onboarding changed. A mature comparison strengthens the diagnosis; it does not establish the cause on its own.
Reconcile a small set of event histories
Choose a manageable sample of eligible entrants and trace the relevant events. Use records you are authorized to inspect, and keep unnecessary personal details out of the worksheet.
For each example, record entry time, completion time, event order, repeated events, and relevant property values. Then apply the written counting contract manually. Would this example count in the daily chart? Would it qualify for the funnel? Which specific rule explains any difference?
Include completed and incomplete journeys. Looking only at successful signups can conceal the missing event or unexpected sequence that matters. If you need a broader view of intervening behavior, explore user paths as a follow-up investigation. Treat observed patterns as leads to examine, rather than proof of why someone abandoned signup.
Turn the discrepancy into a decision
Classify what you find. A population mismatch calls for aligned filters. A timing mismatch calls for comparable reporting periods. Missing or duplicated events call for an instrumentation investigation. A conversion decline that remains after reconciliation calls for a closer look at user behavior.
PostHog documents trends, funnels, and paths as different insight types. To choose an insight, start with the decision: activity volume, completion between defined steps, or the routes people take through a journey. Keep the chart's purpose explicit when presenting results to stakeholders.
Before changing your signup experience, attach the counting contract and a few reconciled examples to the analysis. State what the evidence explains and what remains unresolved. That gives your team a concrete next action without turning a disagreement between charts into an unsupported story about customers.
Like this project
Posted Oct 28, 2026
Two complete, source-linked articles explaining SaaS funnel measurement. Includes visual summaries and full text. Independent AI-assisted writing samples.
Likes
0
Views
0
Timeline
Oct 18, 2026 - Oct 18, 2026