Expense Tracker Project.
DARYL ALLOO
I did an expense up for my project. The main aim was to understand my spending habits are crucial for making informed financial decisions. My Expense Tracker database can be a goldmine of information, but I needed the right SQL queries to unlock its potential. Here are some questions I was able to answer using SQL queries in my Expense Tracker:
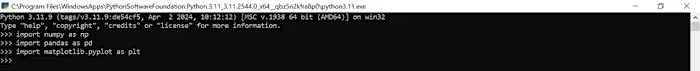
I had to import my file as a CSV on my SQL workbench before starting to work. https://drive.google.com/file/d/1E1MbY4E8H6RZvEdiKJUG728Z5WuFKpaG/view?usp=sharing

Figure 1
Part 1: Retrieving Expenses
1.1 Retrieving All Expenses:
Question: How can I view all my expense data in the Expense Tracker database?
SELECT *
FROM Expenses;
Explanation:
SELECT * instructs the database to retrieve all columns from the table.
FROM Expenses specifies the table from which you want to retrieve data (assuming your table is named “Expenses”).
; terminates the SQL statement.
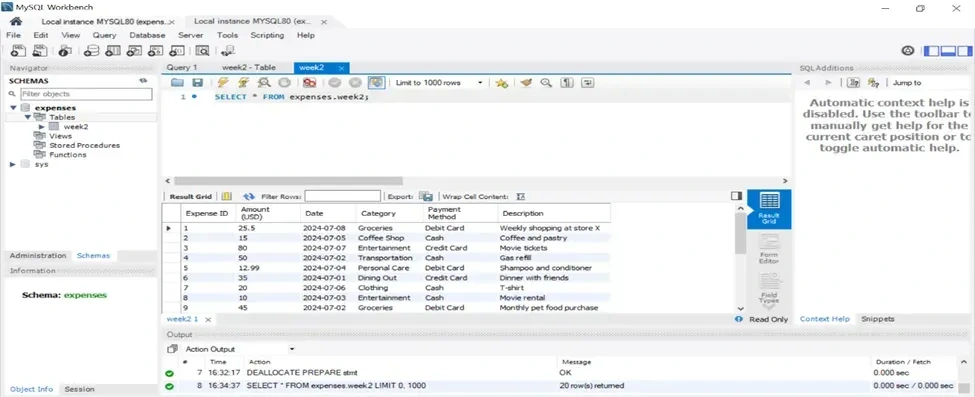
Figure 2
1.2 Specific Columns:
Question: I want to analyse spending patterns by category and date. Which columns should I select?
SQL Query:
SQL
SELECT date, category, amount
FROM Expenses;
Explanation:
This query retrieves only the “date,” “category,” and “amount” columns from the “Expenses” table. You can modify this further to include or exclude columns based on your specific analysis needs.
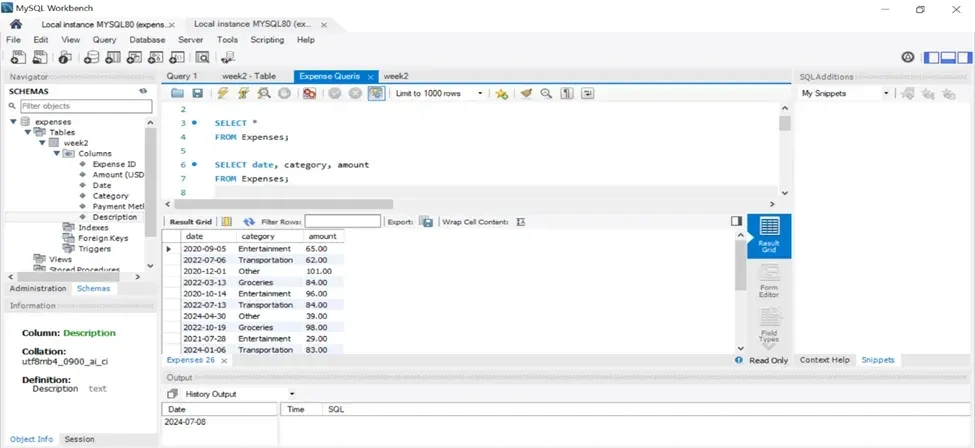
Figure 3
1.3 Filtering by Date Range:
Question: How can I see expenses charged between specific dates? (e.g., January 1, 2021, to December 15, 2024)
SQL Query:
SQL
SELECT date, category, amount
FROM Expenses
WHERE date >= ‘2024–01–01’ AND date <= ‘2024–12–15’;
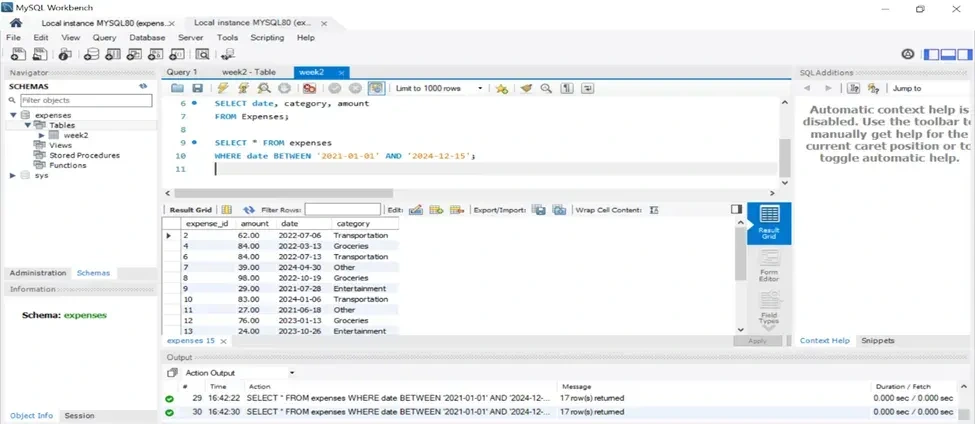
Figure 4
Part 2: Filtering with WHERE Clause
2.1 Filtering by Category:
Question: How can I find all expenses related to entertainment?
SQL Query:
SQL
SELECT date, category, amount
FROM Expenses
WHERE category = ‘Entertainment’;
Explanation:
This query focuses on a specific spending category. The WHERE clause filters the results to include only expenses where the “category” equals ‘Entertainment’. This helps you understand how much you spend on entertainment compared to other categories.

Figure 5
2.2 Filtering with Comparison Operators:
Question: I want to see expenses exceeding a certain amount (e.g., $50).
SQL Query:
SQL
SELECT date, category, amount
FROM Expenses
WHERE amount > 50;
Explanation:
This query filters expenses based on their amount. The WHERE clause uses the > operator to find the costs where the “amount” exceeds $50. You can adjust the value to suit your needs.
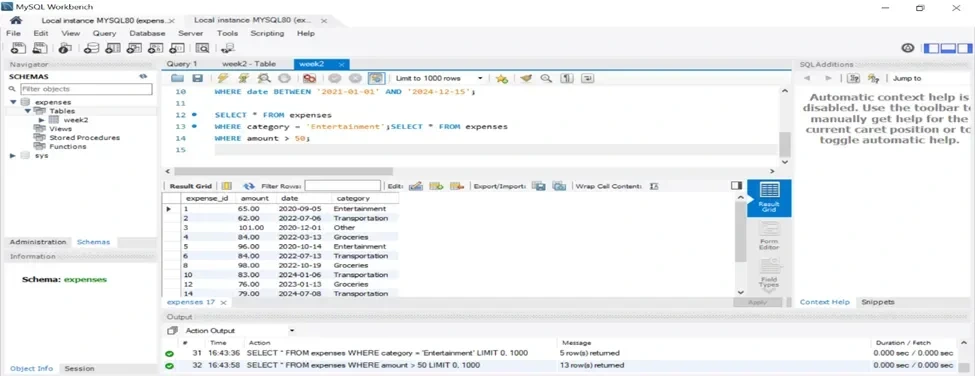
Figure 6
2.3 Combining Filters (OR):
Question: How do I find expenses related to either “Transportation” or “Groceries”?
SQL Query:
SQL
SELECT date, category, amount
FROM Expenses
WHERE category = ‘Transportation’ OR category = ‘Groceries’;
Explanation:
This query uses the OR operator in the WHERE clause to filter for expenses belonging to either category. It retrieves expenses where the “category” is equal to ‘Transportation’ or ‘Groceries’. This helps you compare spending between these two categories.
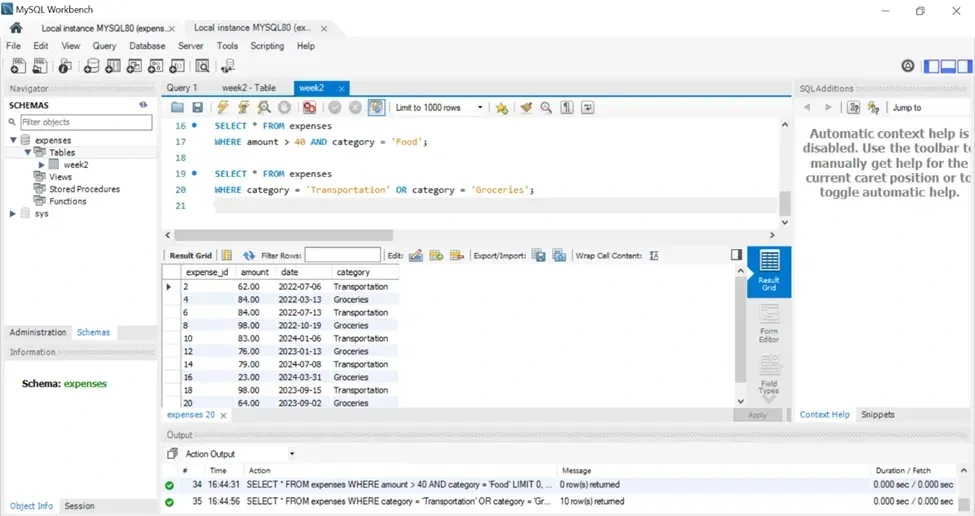
Figure 7
2.4 Filtering with NOT:
Question: What expenses are not categorised as “Rent”?
SQL Query:
SQL
SELECT date, category, amount
FROM Expenses
WHERE category <> ‘Rent’;
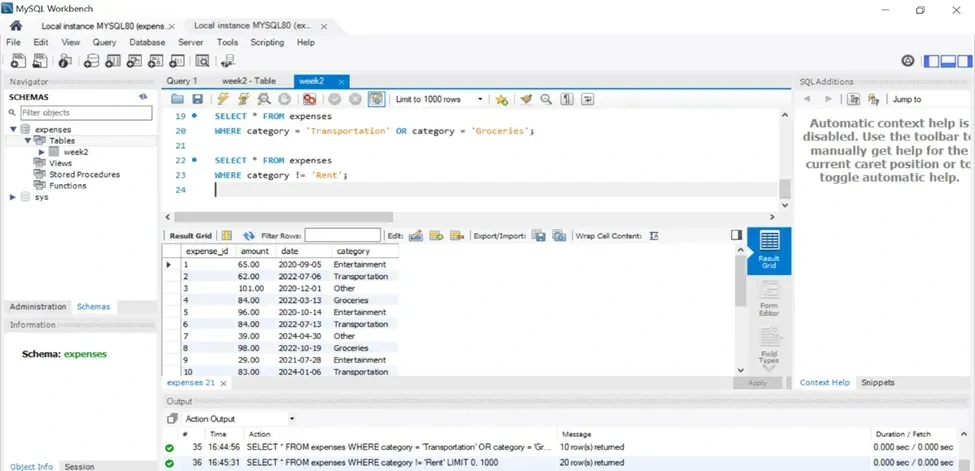
Figure 8
Part 3: Sorting Retrieved Data
3.1 Sorting by Amount:
Question: How can I sort my expenses by the amount spent, from highest to lowest?
SQL Query:
SQL
SELECT date, category, amount
FROM Expenses
ORDER BY amount DESC;
Explanation:
We use the same SELECT clause to choose the desired columns.
ORDER BY amount DESC sorts the results based on the “amount” column in descending order (DESC).
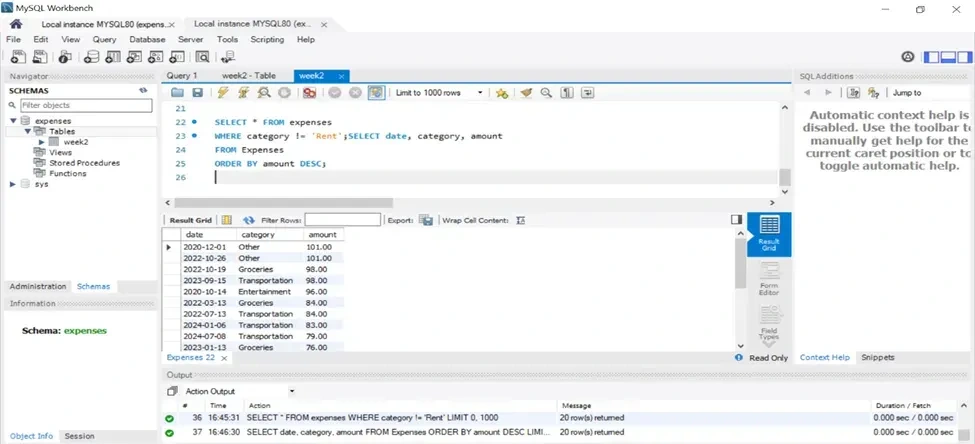
Figure 9
3.2 Sorting by Date and Category:
Question: Can I sort expenses first by date (recent to past) and then by category (alphabetical)?
SQL Query:
SQL
SELECT date, category, amount
FROM Expenses
ORDER BY date DESC, category ASC;
Explanation:
We maintain the same SELECT clause.
ORDER BY date DESC, category ASC sorts the results first by “date” in descending order (DESC), and then within each date, sorts by “category” in ascending order (ASC). You can adjust the order (ASC or DESC) for each column as needed.
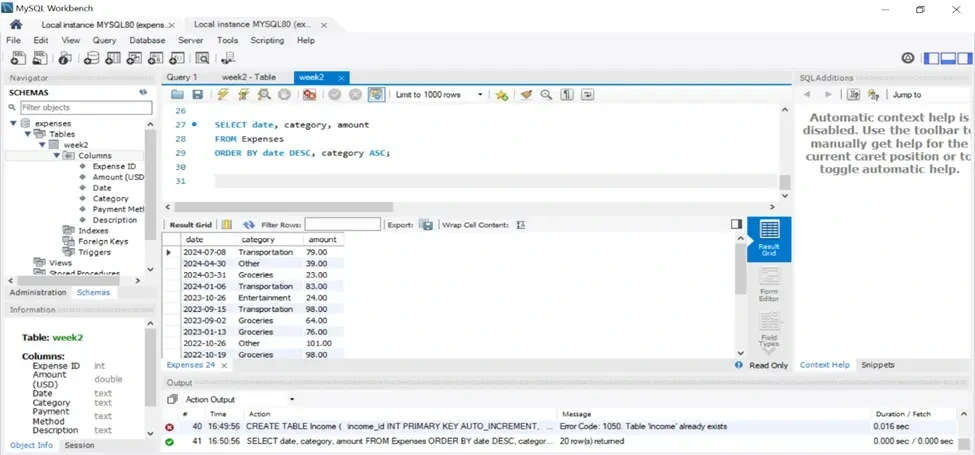
Figure 10
What are the benefits of Analyzing data?
Understanding Spending Habits: By querying my data, I can gain valuable insights into how I spend my money. I can see which categories consume the most funds and identify areas where I can cut back and track my progress towards financial goals.
Identifying Trends: Analyzing expenses over time can reveal spending patterns. You might identify seasonal fluctuations, track progress towards saving targets, or spot areas where your spending is unexpectedly high.
Informed Budgeting: Expense analysis helps create a realistic and practical budget. By understanding my spending habits, I can allocate funds appropriately and make informed decisions about where my money goes.
Better Financial Decisions: The knowledge gained from expense analysis empowers you to make smarter financial choices. I can prioritize spending in essential categories, identify unnecessary expenses, and potentially save more money.
Here’s a breakdown of how analysing my data with the provided queries can enhance your understanding:
Retrieving All Expenses (Query 1.1): This provides a complete picture of your recorded expenses. You can see the entire dataset and identify any outliers or areas requiring further investigation.
Specific Columns (Query 1.2): Focusing on relevant columns like date, category, and amount allows you to analyze spending patterns by category and date. You can see how much you spend in each category over time, helping you identify areas where you might be overspending.
Filtering by Date Range (Query 1.3): This allows you to zoom in on specific periods (e.g., a month or a year) and analyze spending trends within that timeframe. You might identify seasonal spending variations or track progress towards saving goals for a particular period.
Filtering by Category (Query 2.1): Focusing on a specific category (e.g., entertainment) reveals details about how much you spend on that category compared to others. This can help you determine if adjustments are necessary.
Filtering with Comparison Operators (Query 2.2): This helps you identify high-value expenses. You can see which transactions exceed a certain amount (e.g., $50) and analyze their necessity or potential for reduction.
Combining Filters (Query 2.3 & 2.4): These queries allow you to get very specific about your spending. You can find expenses exceeding a certain amount and belonging to a particular category (e.g., food over $75) or see expenses in multiple categories (e.g., transportation or groceries). This helps you understand your spending habits in granular detail.
Filtering with NOT (Query 2.5): This helps you identify expenses outside a specific category (e.g., not rent). This can be useful for catching uncategorized expenses or analyzing particular spending patterns.
Sorting Retrieved Data (Query 3.1 & 3.2): Sorting expenses by amount (highest to lowest) or by date and category allows you to prioritize areas for review. You can quickly see your most significant expenses or identify recent spending trends within categories.
By running these queries and analyzing the results, you gain a deeper understanding of your spending habits. You can see where your money goes, identify areas for improvement, and make informed financial decisions based on your spending pattern.
Like this project
Posted Jul 25, 2024
I did an expense up for my project. The main aim was to understand my spending habits are crucial for making informed financial decisions.
Likes
0
Views
24