Masterclass Marketing Success with Passive E-Commerce
Bilal Saeed
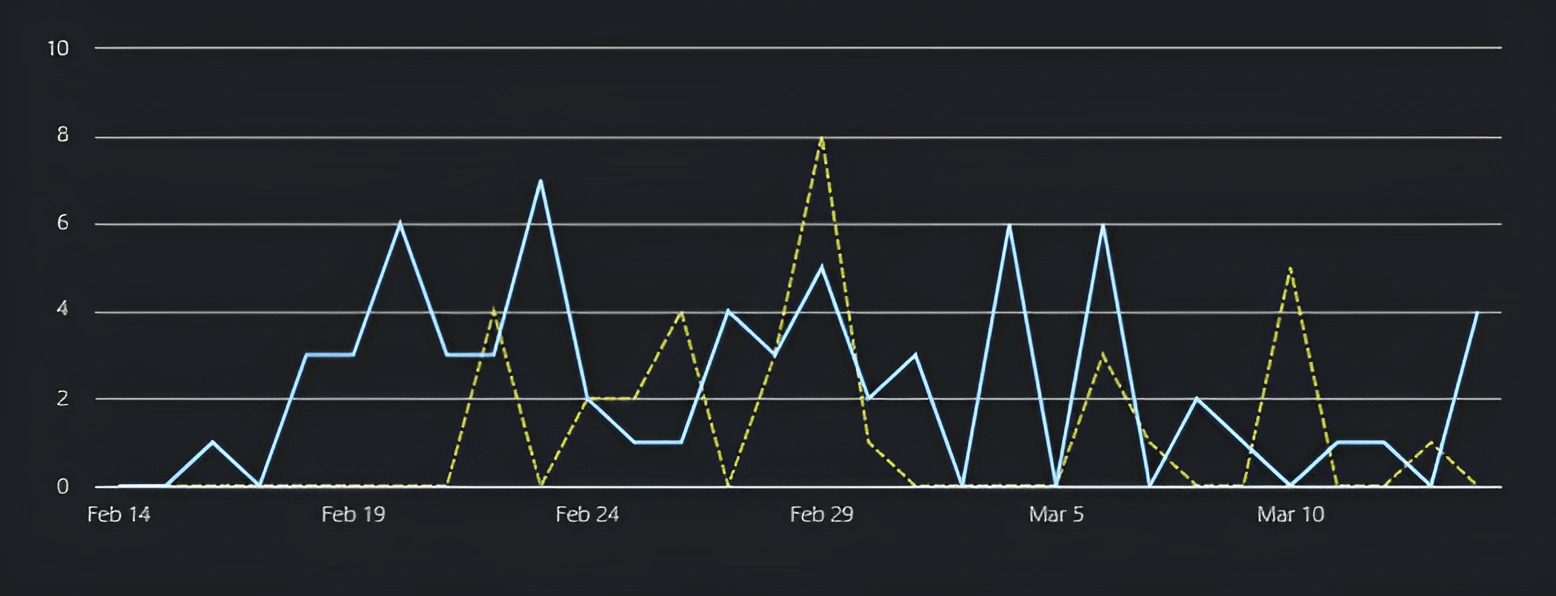
Traffic and Sales Analysis:
This chart visualizes the performance metrics of a passive e-commerce campaign over a period from mid-February to mid-March. The solid blue line represents daily sales, while the yellow dashed line indicates daily social media engagement.
Key trends highlighted include:
Sales Peaks: Noticeable spikes in sales occurred on February 21, February 26, and March 7.
Engagement Variations: Social media engagement showed significant fluctuations, with peaks aligning with or slightly preceding the sales peaks, indicating a correlation between social media activity and sales increases.
Linkedin Ads Insights
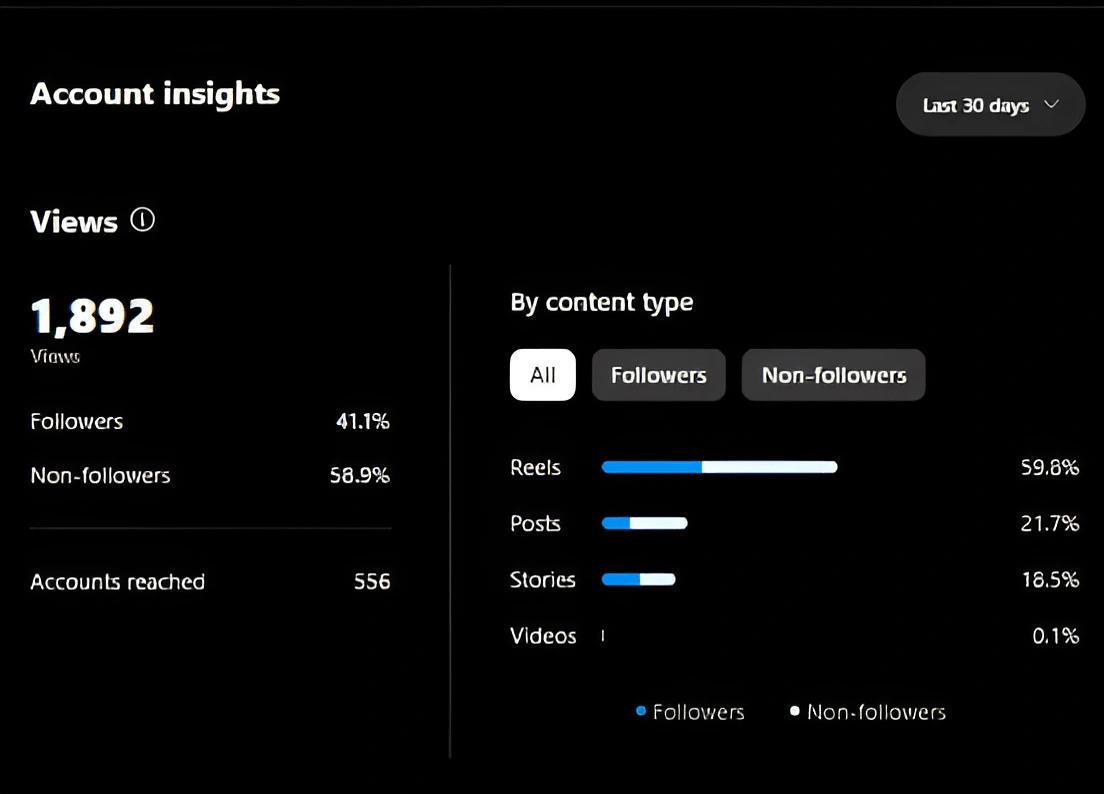
Instagram accounts Reached
Like this project
Posted Sep 7, 2024
I crafted and executed targeted campaigns for their online masterclasses, focusing on increasing course enrollments through a mix of paid ads,& organic content.