How do you turn cold,
Keitoto Studio
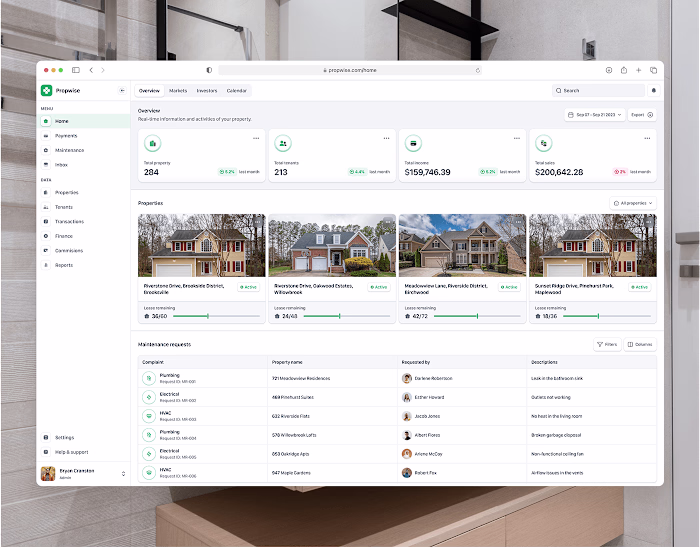
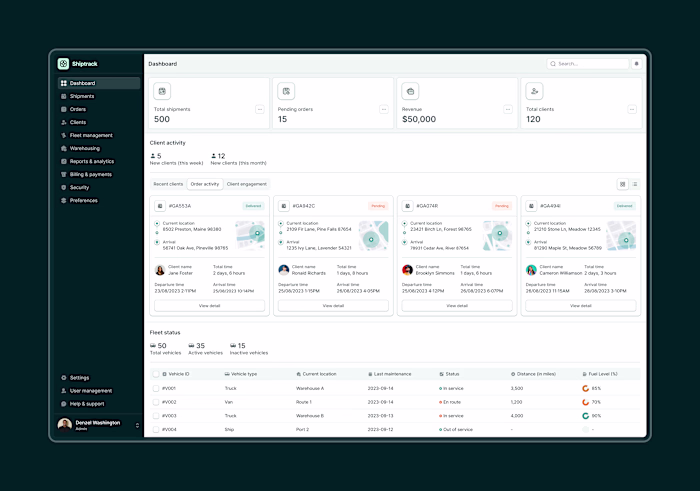
How do you turn cold, sterile data grids into a visually stunning operation hub? Here is our team’s take on Vega — Enterprise AI Analytics Dashboard. ✨
When designing an enterprise-grade platform, balancing extreme data density with design aesthetics is always a tough tightrope to walk. Look at how we handled the visual breakdown:
📊 Modular Clarity: Clean, responsive UI elements built to isolate complex data without creating user fatigue.
🍊 Intentional Accents: A restrained dark canvas paired with strategic red and orange data bars to signal urgency instantly.
💬 The Narrative Layer: Blending real-time customer voices seamlessly next to complex technical charts.
Feedback, thoughts, and support are always appreciated. ❤️
Like this project
Posted Jul 3, 2026
How do you turn cold, sterile data grids into a visually stunning operation hub? Here is our team’s take on Vega — Enterprise AI Analytics Dashboard. ✨ When ...
Likes
0
Views
1
Timeline
May 11, 2026 - May 15, 2026