Sales Performance Dashboard and Insights

Mubar BI


Data Collection and Preparation:
The dataset was collected, which included information on revenue won, revenue in the pipeline, sales stages, product categories, territories, and industries.
Data cleaning and transformation were performed to ensure accuracy and consistency, handling missing values and inconsistencies.
Data Analysis:
Key metrics were calculated, such as total revenue won, revenue in the pipeline, and forecast percentages.
Advanced calculations were performed to analyze revenue distribution by product category and territory.
Pipeline trends were analyzed, including opportunity counts, total pipeline, and average days remaining for deals to close.
Visualization:
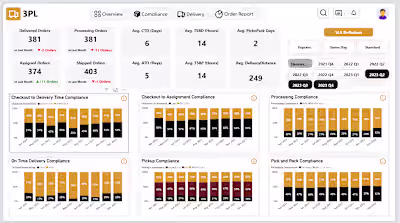
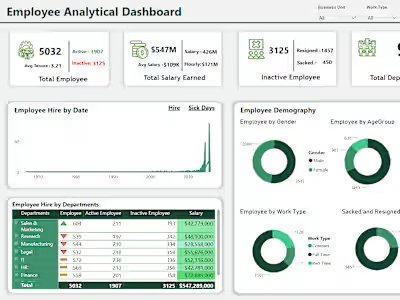
A dashboard was created to visualize the data effectively. It included various charts and graphs, such as bar charts for revenue distribution by product category and territory, line charts for pipeline trends, and tables for detailed sales data.
The dashboard also included metrics and KPIs displayed prominently for quick reference.
Insights and Reporting:
The dashboard provided insights into sales performance, such as identifying top-performing product categories and territories.
It highlighted areas for improvement, such as territories with low forecast percentages and industries with high revenue open.
The analysis and dashboard provided the organization with a clear understanding of its sales performance and pipeline trends, enabling it to make informed decisions regarding sales strategies, resource allocation, and target setting. The visualizations highlighted key trends and areas for improvement, helping the organization to focus on high-performing product categories and territories and to address issues related to low forecast percentages and high revenue open.
Like this project
Posted Jun 26, 2025
Created a sales performance dashboard with insights and visualizations.
Likes
0
Views
1
Timeline
Jan 1, 2025 - Jan 31, 2025