Food & Beverages Sales Analysis
ugbaje innocent
Food-and-Beverages Sales Analysis
Introduction:
The food and beverage sales analysis is represented in a dashboard typically referred to as a canvas. It comprises multiple charts, a graphs, cards and table that convey the story of how food and beverages were sold through various channels such as; Online, Retail, and Distributor.
Problem Statement:
There are a few but important questions that need to be answered below;
Which sales platform has the highest revenue?
Which quarter of the year produce the highest revenue for the company?
Which platform has the lowest revenue, and how can sales be improved on such a platform?
Data Sourcing:
Skill/ Concept Demonstrated:
The following power BI features were used in the visualization:
Download data,
Transformation,
Power query,
DAX, Quick measure,
Modelling,
Button,
Navigation,
Filter.
Modelling:
Automatic relationship was used and nothing was adjusted.
Visualization:
This report comprises of 4 pages:
Food and Beverage Sales Dashboard
Revenue by Month aand Quater
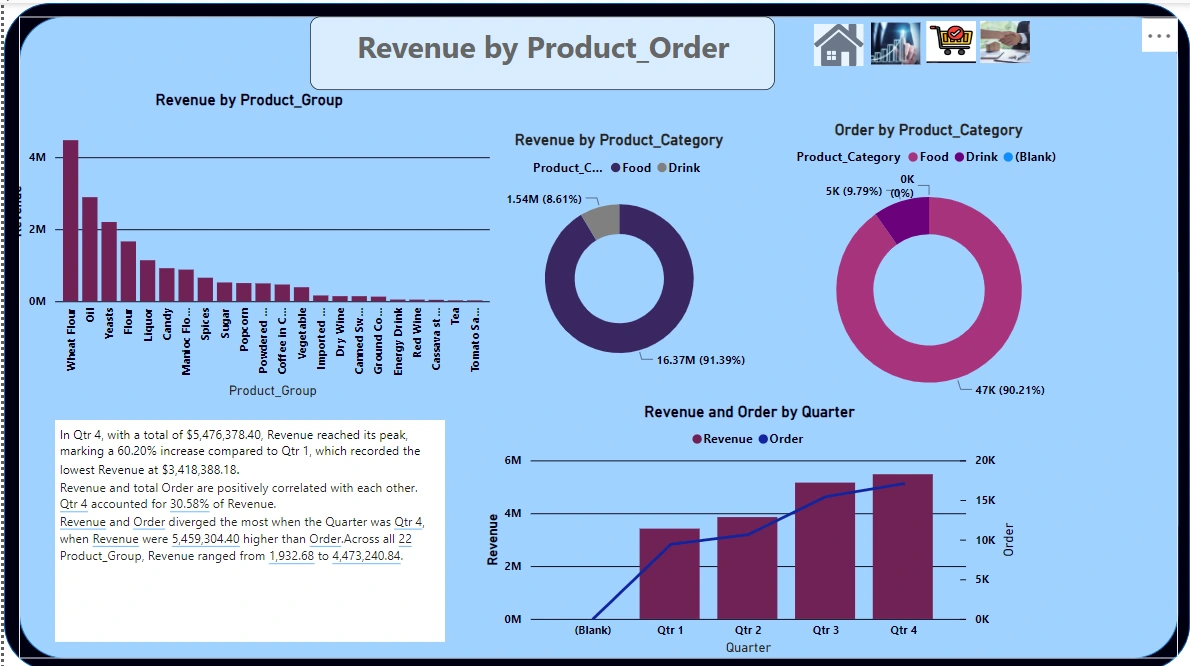
Product Order
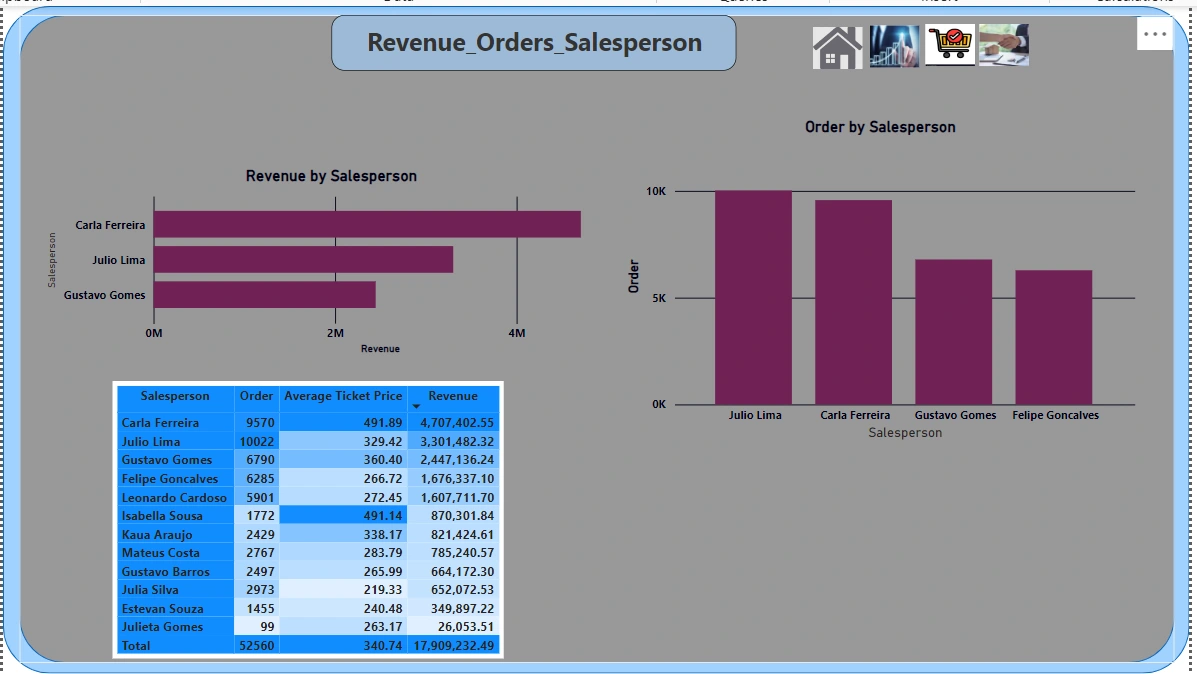
Salesperson
Page Navigation:
To navigate the report from one page to another, use the icons located in the top right corner of each page. To enable navigation, CLICK ON EACH PAGE you wish to visit. To move to the third page, you need to click on the home icon again, just like the last page. You must return to the home page before navigating to another page.
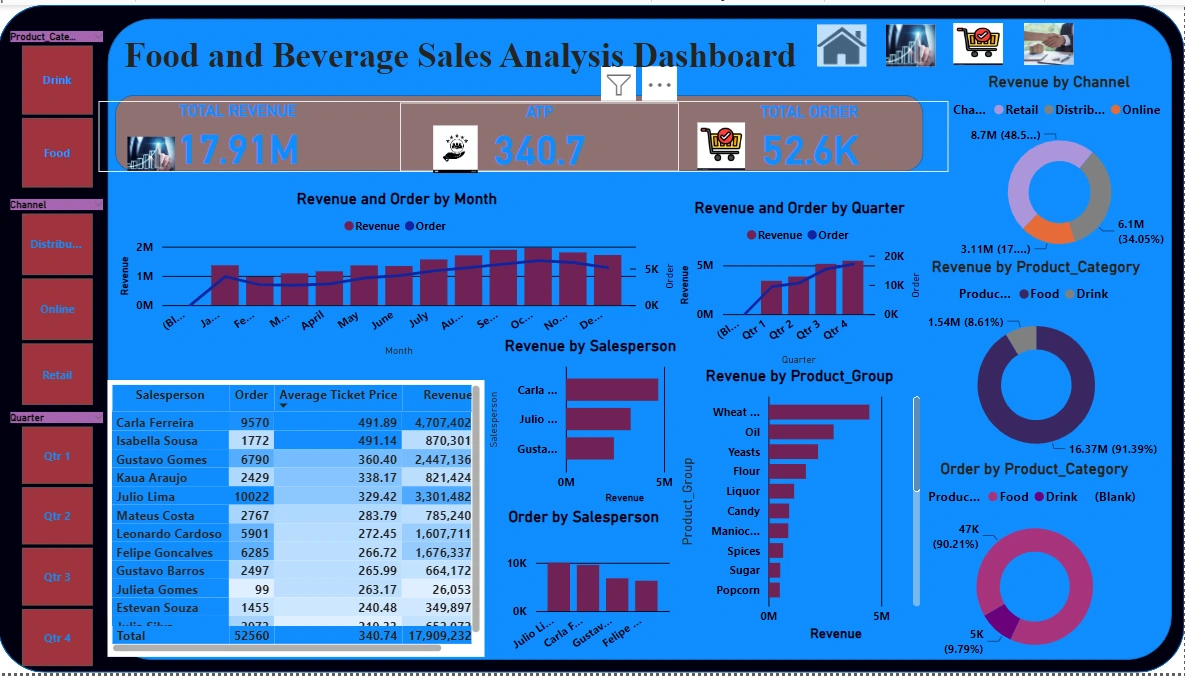
The dashboard is navigated with help of 9 side buttons on the left the side. These buttons aid in explaining the dashboard better, shedding more light on the revenue, sales channels and the quarter where the best and worst sale were recorded.
Analysis:
Drink and Food button: These buttons filter the revenue, average total products, and the quantities ordered on every sale platform. From the analysis, the total revenue derived from the sale of Drink is 1.5M while for Food it is 16.37M.
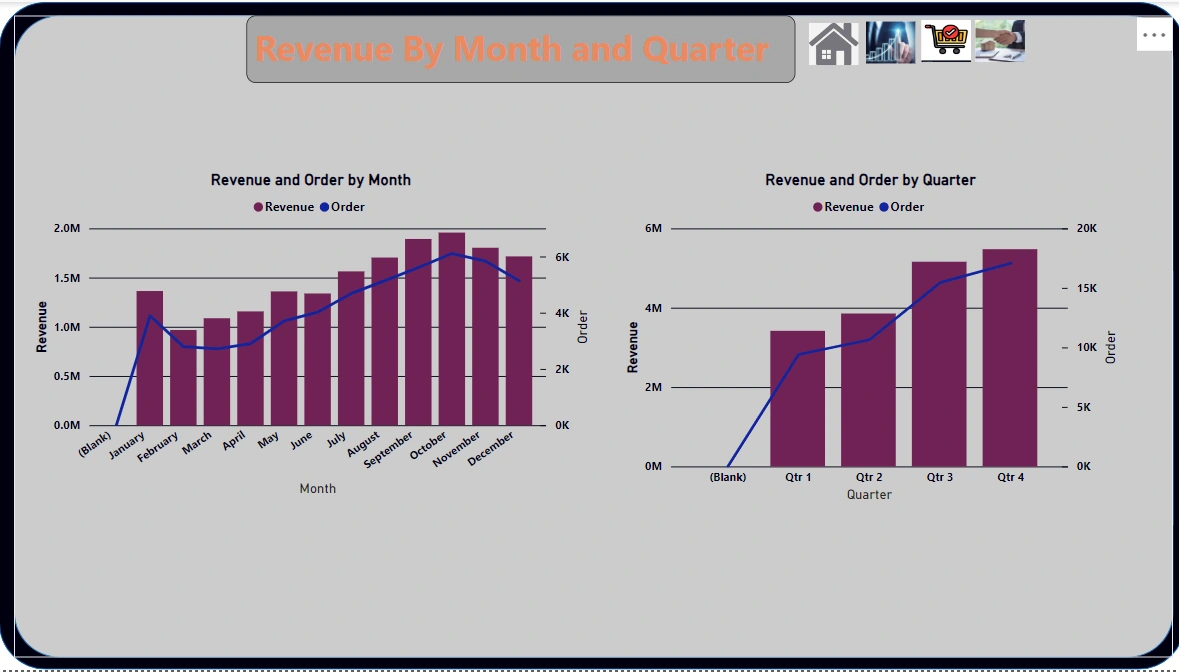
The Quarter button: This shows the progression of sale as it flows from the first quarter to the fourth quarter. From all indications, Retail sales channel has the highest turnover, increasing from 3.42M in the first quarter to 5.48M in the fourth quarter. It is interesting to note that Online revenue dropped on the fourth quarter to 1.06M compared to 1.09M in the third quarter.
Sales Channel button: These sales channels comprise Online, Retail, and Distributor, and they show the amount of food and drink sold through these channels. From the given dataset, Retail has a Total Revenue of 8.70M and a Total Order of 22.3K, making it the most utilized channel, while the Online channel has a lower Total Revenue of 3.11M and a Total Order of 12.0K.
You can interact with the report here
RECOMMENDATIONS
From the dashboard, it is evident that the Retail sales channel generated the highest revenue. this highlights the need to:
Recruit competent social media marketers for the sales chaneel. In the 4th quarter, despite 4,415 Orders being requested, only 1.06M revenue was generated, unlike previous quarter where 4,132 orders resulted in 1.09M revenue. The social media space holds a lot of potentials and should be harnessed.
Professional who can sale DRINKS should be employed as well because the total revenue of drink compared to food is very low. To stay healthy and hydrated, we need more drink options. Improving sales in this platform can be achieved by focusing on drink sales. 🍹😃
Like this project
Posted Apr 18, 2024
Contribute to TheIbesone/Food-and-Beverage development by creating an account on GitHub.
Likes
0
Views
53