Sustainable Emission Tracker Dashboard Sustainability platforms

Sustainable Emission Tracker Dashboard
Sustainability platforms often bring together a large amount of environmental data.
The challenge is turning that information into something people can understand quickly.
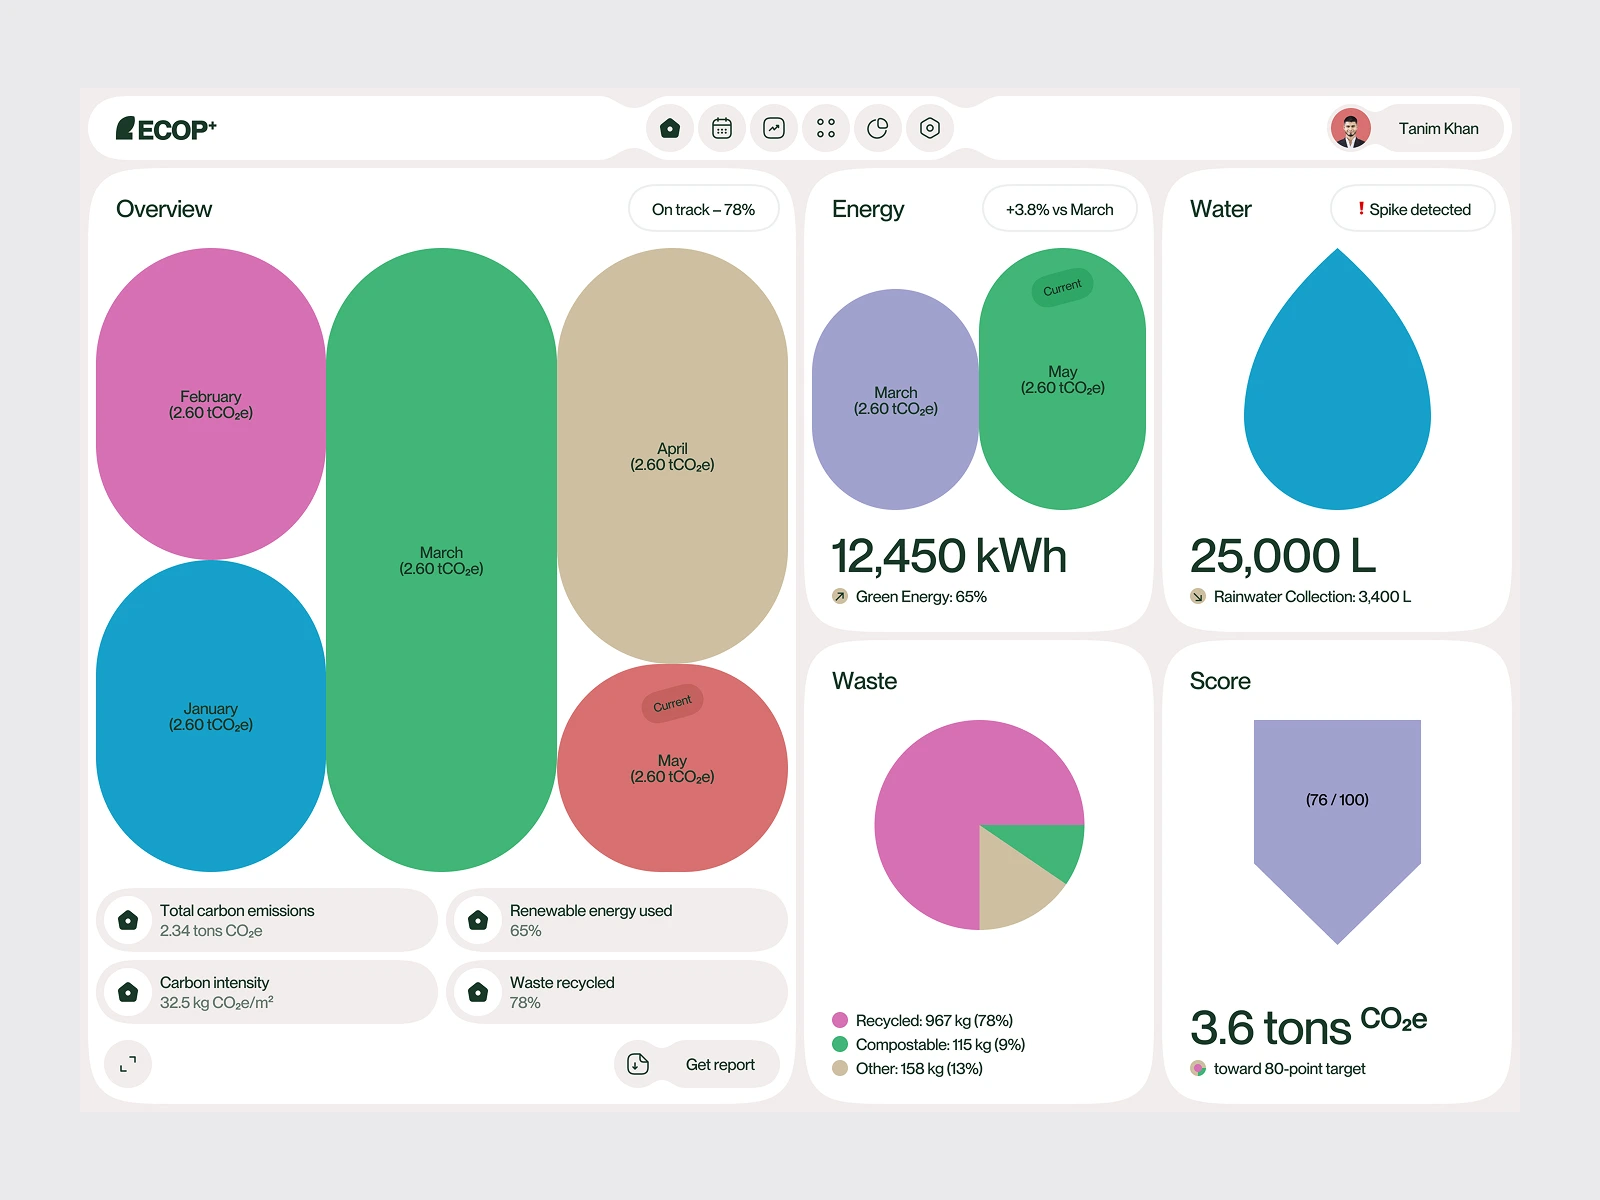
For this Sustainable Emission Tracker Dashboard, we designed the experience around emissions performance, sustainability targets and progress tracking.
The interface uses clear metric cards, structured charts and visual indicators to create a more understandable view of environmental performance.
Rather than treating every data point equally, the dashboard creates hierarchy around the information users are most likely to monitor and act on.
Focus: Carbon Emissions Tracking · Sustainability Dashboard · ESG UI/UX · Data Visualization · Climate-Tech Product Design
The goal was to make complex environmental data feel structured, readable and useful.
Designed by WaxyWeb.
Building a sustainability or climate-tech product?
0 likes · 0 views · Sep 23, 2026
Sustainable Emission Tracker Dashboard Sustainability platforms often bring together a large amount of environmental data. The challenge is turning that info...