Data Visualisation and Storytelling using Power BI
DAN NGUYEN
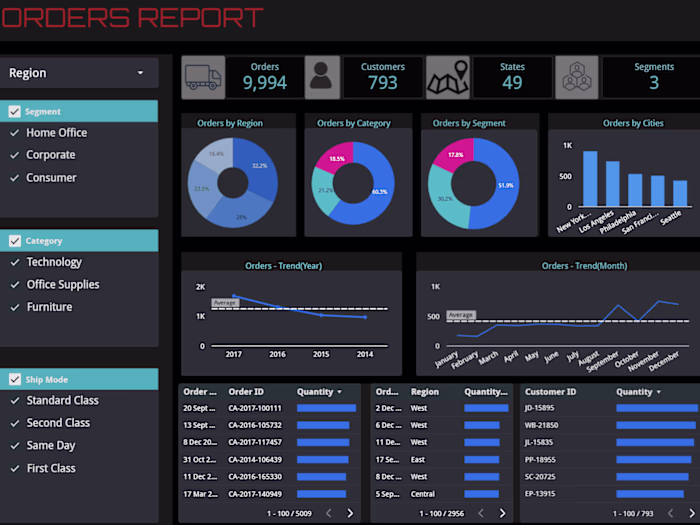
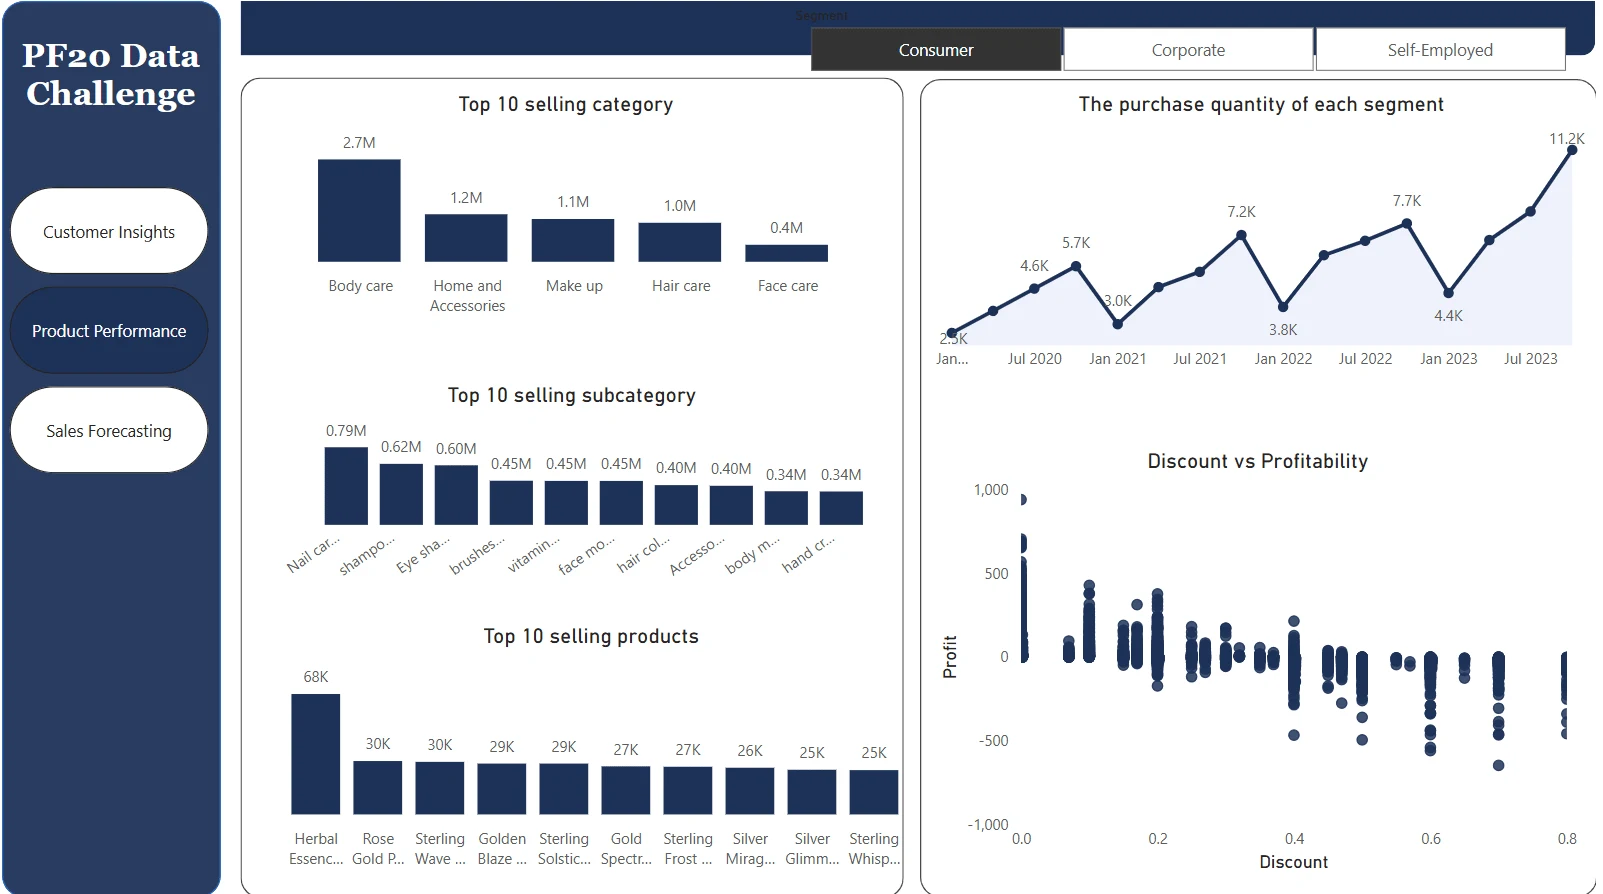
Data-Driven Insights: This interactive dashboard provides a comprehensive overview of key business metrics, enabling data-driven decision-making across various departments.
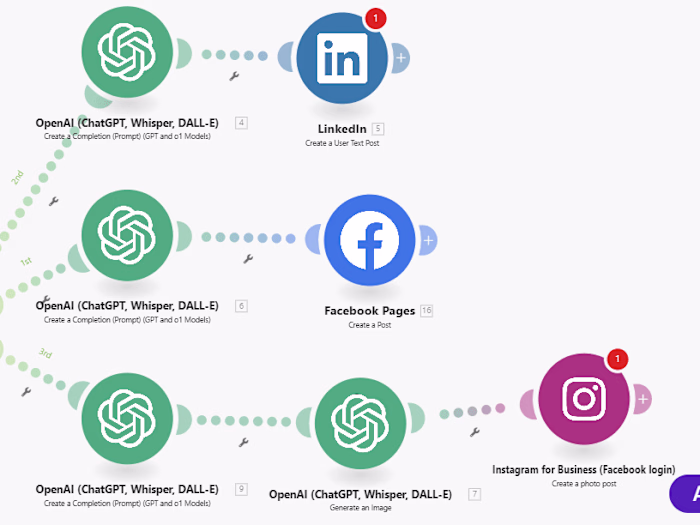
Power BI & Power Automate: Built using Power BI for data visualization and Power Automate for automated data refresh, ensuring up-to-date information.
Integrated Data: Power Query was used to integrate data from multiple sources, including sales, marketing, and CRM systems, ensuring a holistic view of business performance.
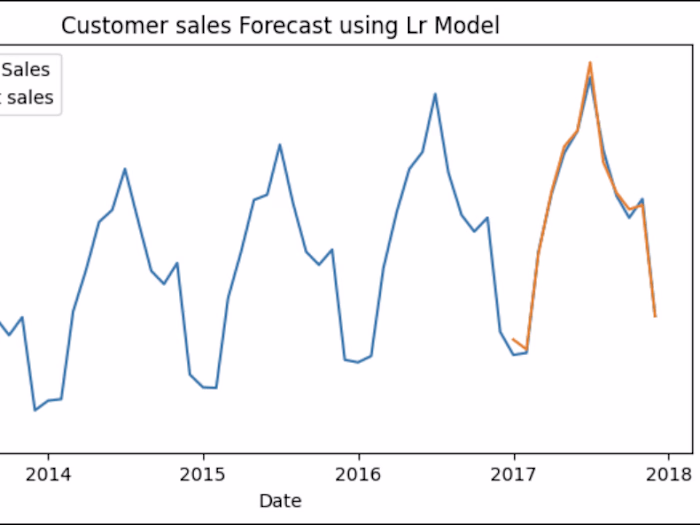
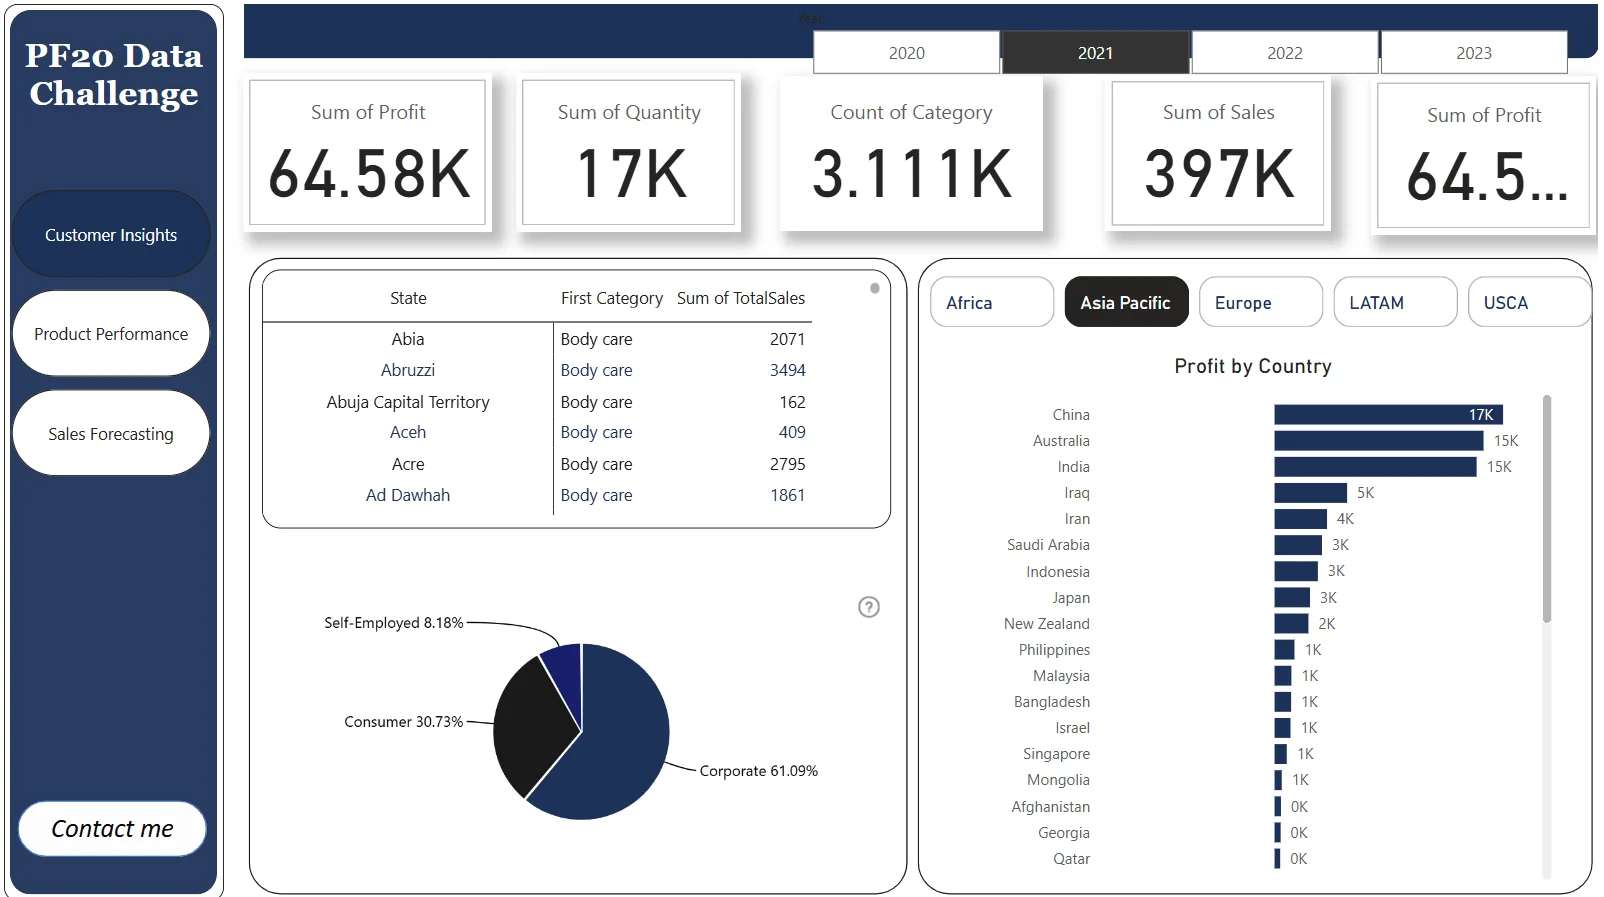
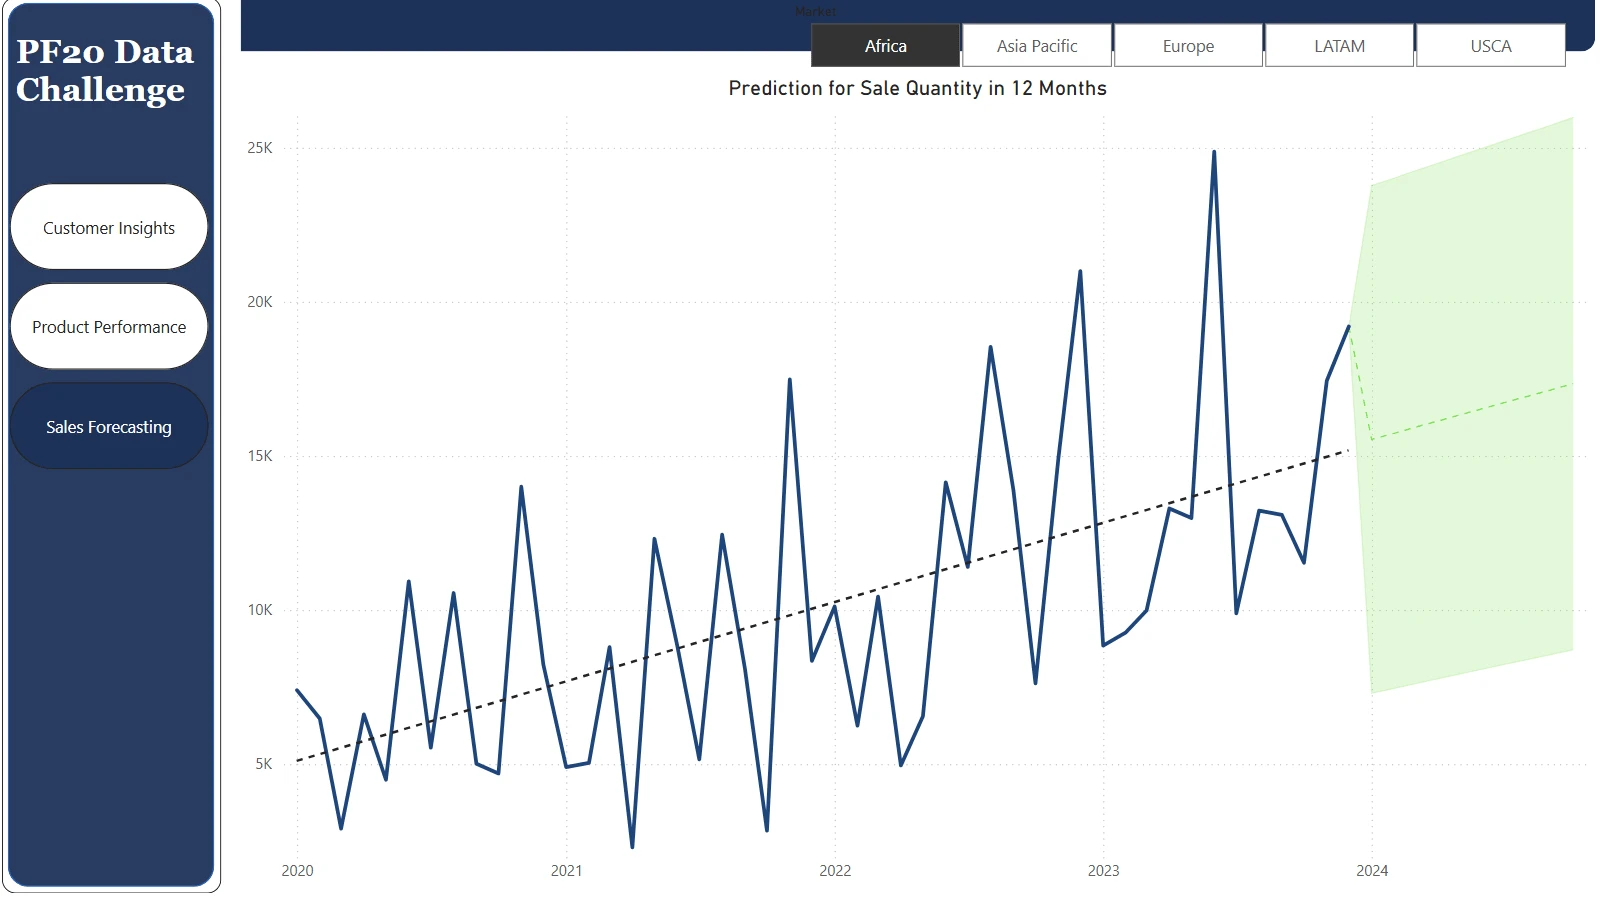
Visualizations for Clarity: The dashboard features a variety of interactive visualizations, including bar charts, pie charts, and line graphs, to present data in a clear and compelling way.
Actionable Insights: Key performance indicators (KPIs) highlight sales figures, campaign performance, customer demographics, and distribution channel contributions. Interactive filters allow users to drill down into specific data points, uncovering trends and insights.
Automated Efficiency: Power Automate automates the data refresh process, saving time and resources, allowing users to focus on analysis and decision-making.
Strategic Tool: This dashboard serves as a powerful tool for strategic planning, performance monitoring, and operational optimization across the organization.
Like this project
Posted Sep 15, 2024
Successfully analyzed sales data for an e-commerce client, identifying key trends and actionable insights to enhance their marketing strategy.