Infographics
Abdullah Sartaj
The History of Billionaires
Case Study 1: The History of Billionaires
Client Brief:
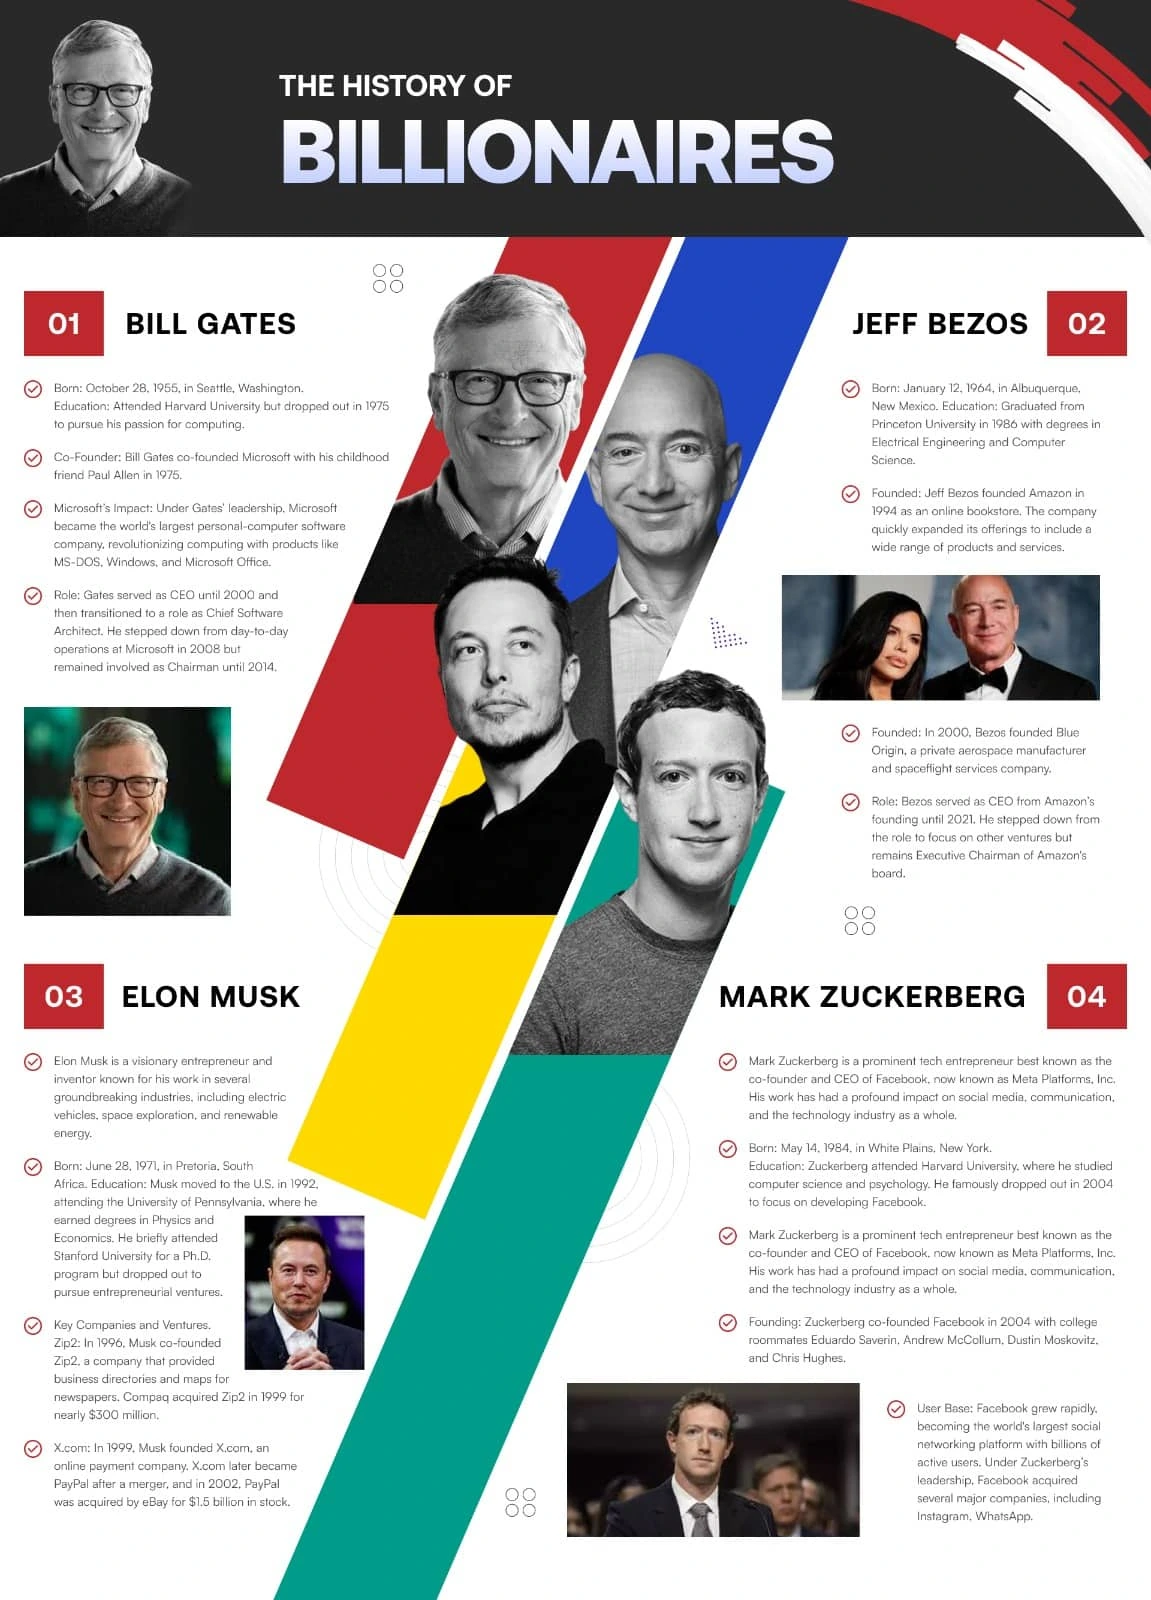
An educational blog focused on business and entrepreneurship wanted an infographic summarizing the journey of four iconic tech billionaires: Bill Gates, Jeff Bezos, Elon Musk, and Mark Zuckerberg. The purpose was to provide readers with a visual timeline of their paths to success.
Design Objective:
To present a biographical snapshot of each billionaire with a balance between text and imagery, ensuring it looked dynamic, informative, and authoritative.
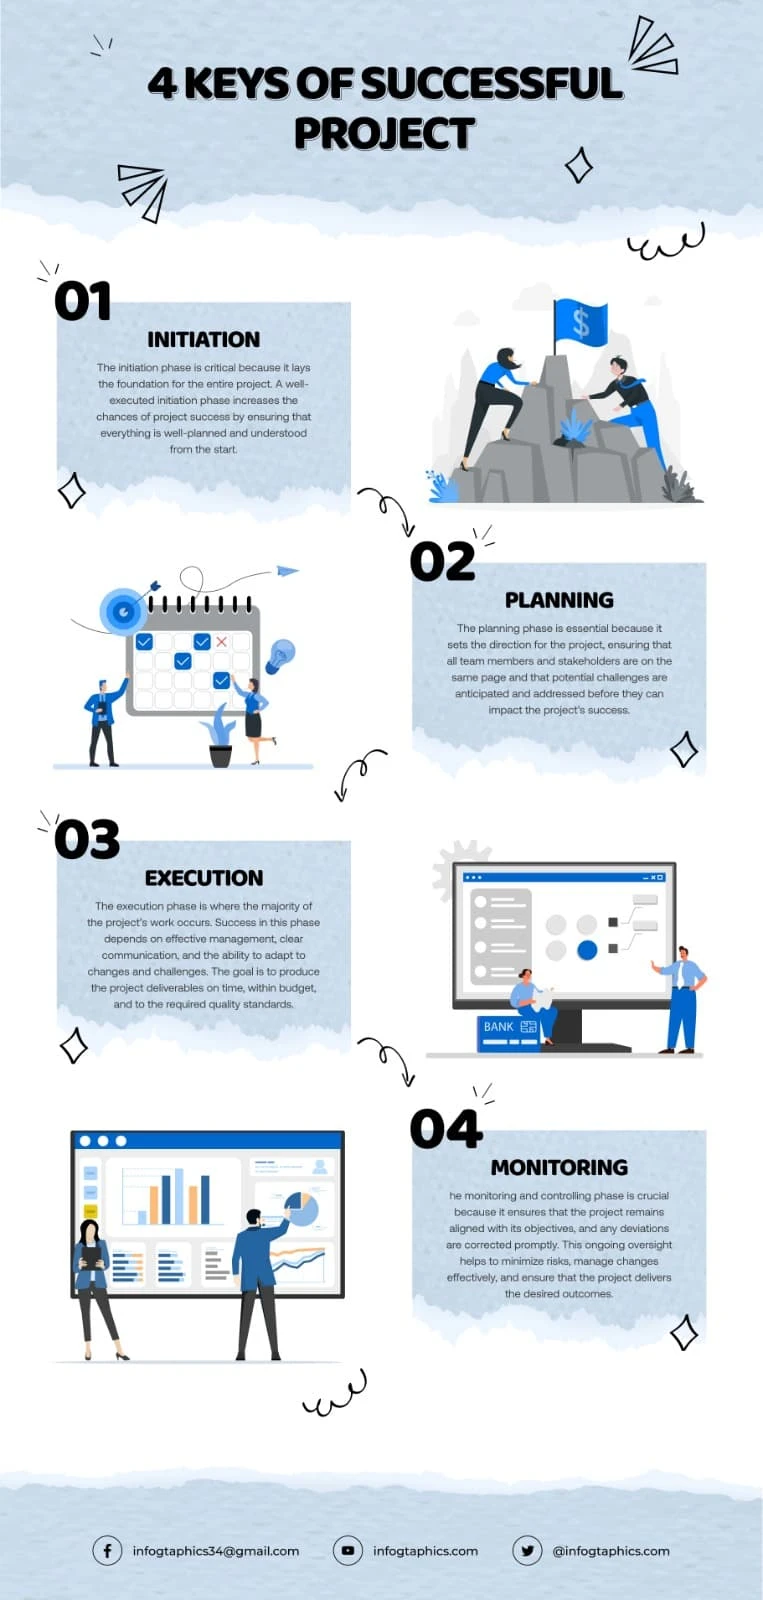
Design Process:
Layout Strategy: Split-page vertical layout, using colored diagonal blocks to divide each individual’s section for visual distinction.
Color Coding: Each billionaire was assigned a distinct color stripe, reinforcing individuality and enabling quick visual segmentation.
Portraits & Icons: High-quality grayscale images for visual consistency, with icons highlighting key milestones (birth, education, founding companies).
Font Choice: A mix of bold and regular fonts maintained clarity while emphasizing names and roles.
Outcome:
The infographic performed well on social media, with over 10K shares within the first week. It was featured in a few business education newsletters and helped boost blog subscriptions by 18%.
Baked Fresh
Case Study 2: Baked Fresh – Loved by All
Client Brief:
A local artisan bakery aimed to educate customers on the different categories of bread they offered, with the goal of increasing in-store engagement and upselling specialty products.
Design Objective:
To make a visually warm and appetizing infographic that educates and entices viewers, emphasizing variety and quality of their baked goods.
Design Process:
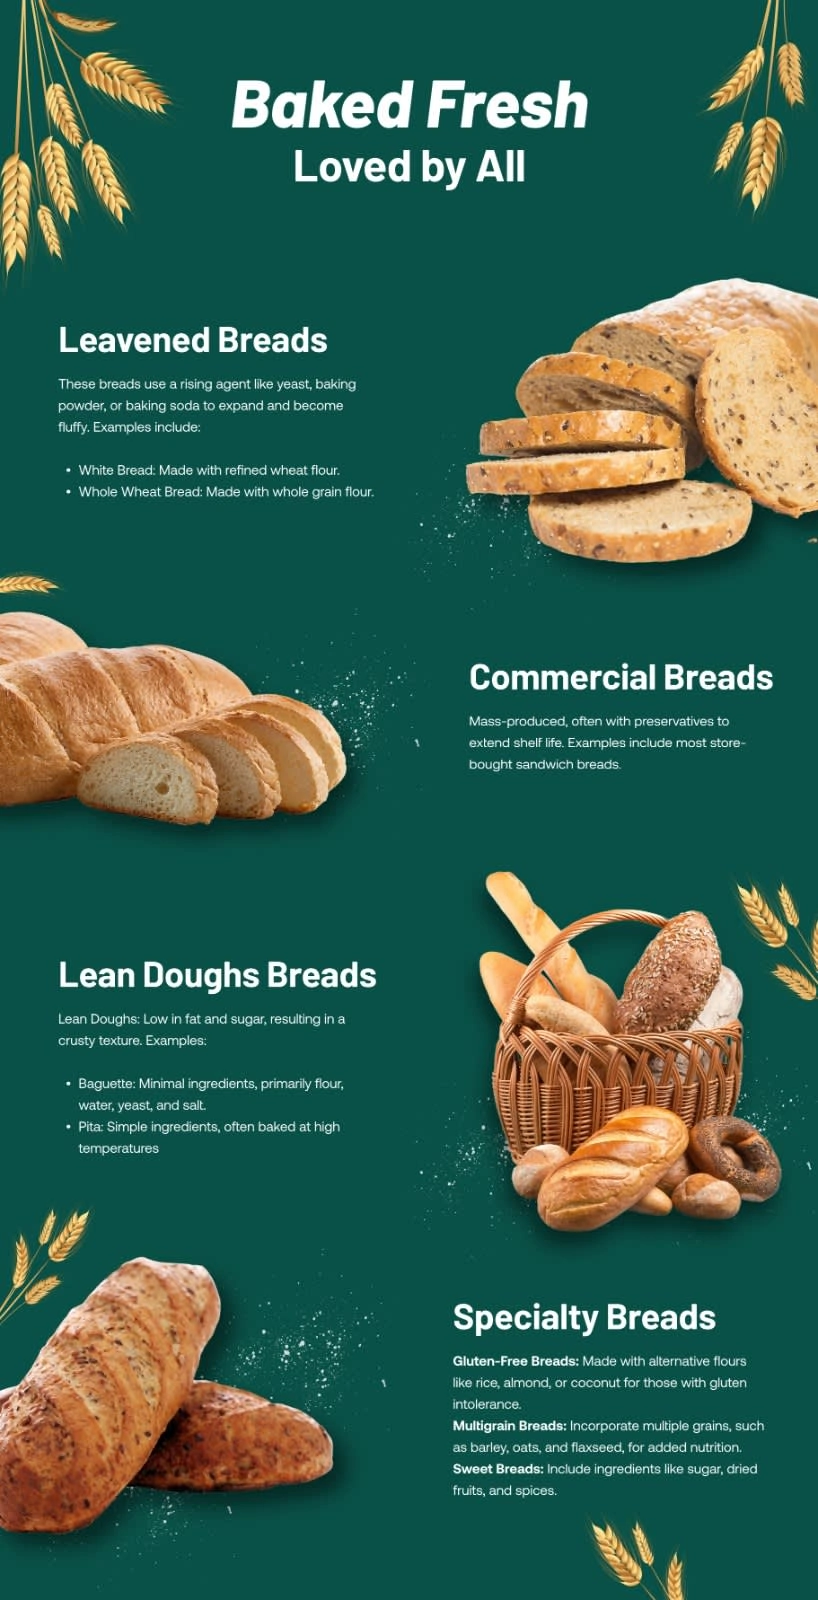
Theme and Color Palette: Deep green background with gold wheat illustrations provided a rustic, organic feel that aligns with the bakery’s brand identity.
Content Sections: Divided into five bread categories — Leavened, Commercial, Lean Doughs, and Specialty Breads — each explained with examples.
Imagery: Realistic, high-resolution bread photography made the design visually appealing and mouth-watering.
Typography: Friendly rounded font matched the warm tone, while bold headers made the categories easy to skim.
Outcome:
The infographic was printed and displayed in-store and also used on the bakery’s Instagram page. The bakery saw a 30% rise in customer inquiries about gluten-free and multigrain products, indicating the infographic effectively educated and influenced customer behavior.
Like this project
Posted Jun 30, 2025
A clear, visually impactful infographic design that captures attention, and communicates key insights effectively.