
Olaolu Motojesi
BI Analyst: Automating reports with Power BI, SQL, & Excel.
Ready for work
Olaolu is ready for their next project!
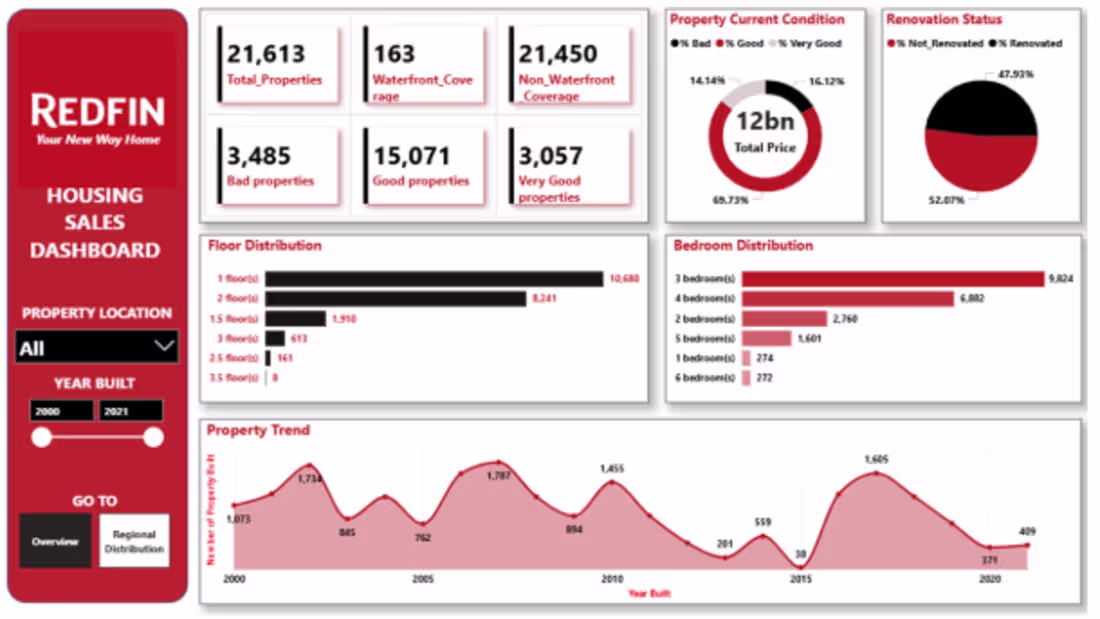
U.S. Housing Market Trends with Power BI
I analysed 21,000+ U.S. housing records and built an interactive Power BI dashboard to explore property conditions, renovations, and construction trends.
Key signals:
• Over 50% of homes are unrenovated
• Construction drops sharply after 2020
• Florida and Hawaii show strong renovation potential
Full report and dashboard:
[https://princemoto.github.io/Motojesi-portfolio/# ]
20
154
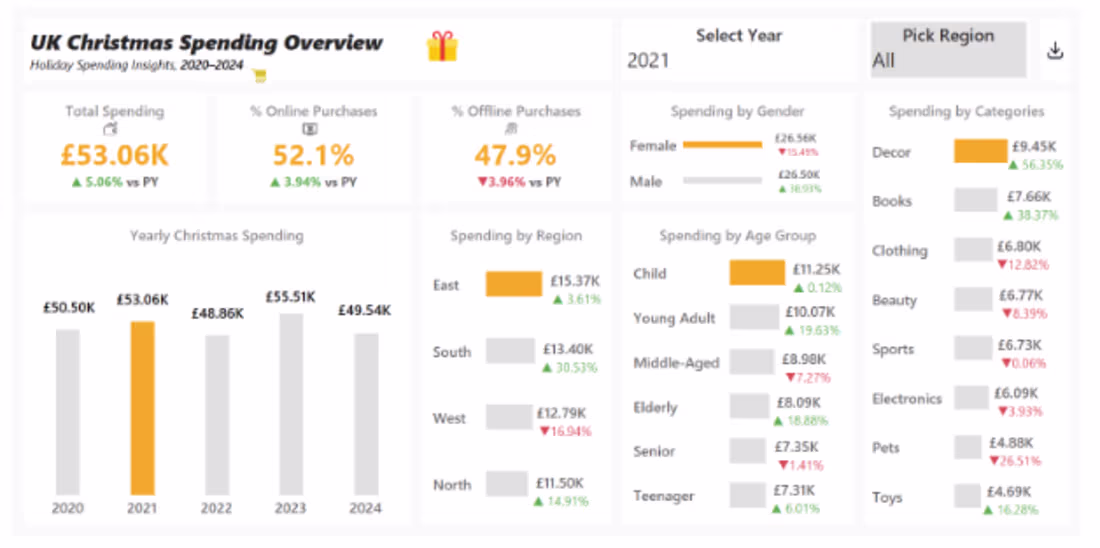
UK Holiday Spending (2020–2024)
I analysed UK Christmas spending data from 2020 to 2024 using Excel and Tableau to understand how consumer behaviour has shifted post-COVID.
Spending peaked in 2023, then declined in 2024.
Online remains strong, but in-store still matters.
Teenagers are emerging as a fast-growing spending segment.
Toys, electronics, and books consistently outperform other categories.
Regional trends show stability in the West and volatility in the East and South.
Full report and interactive dashboard here:
[https://princemoto.github.io/Motojesi-portfolio/# ]
2
30
229
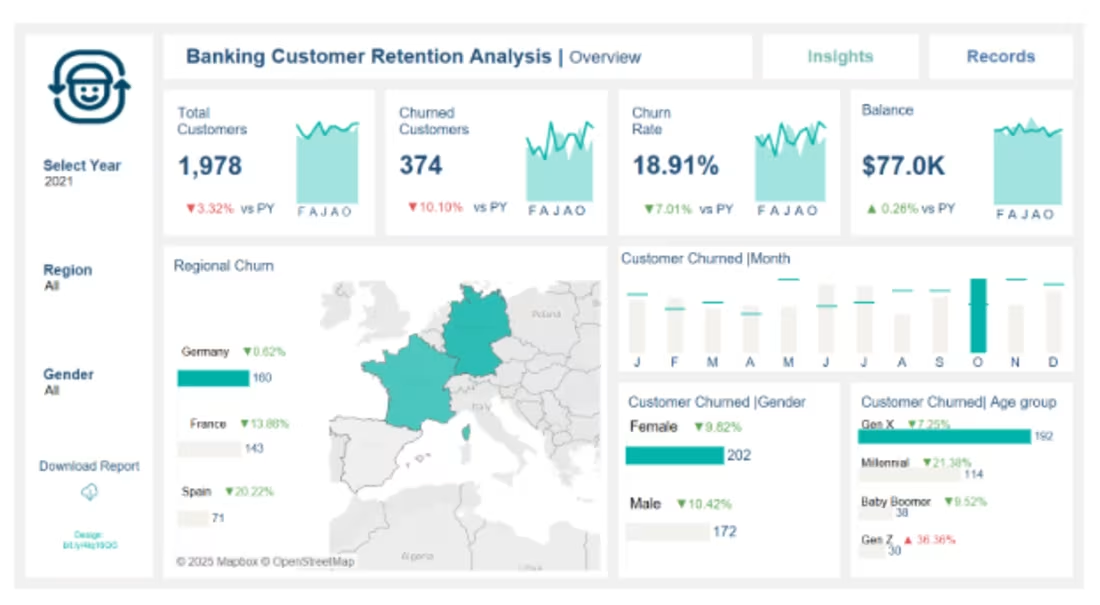
💔 Why are customers leaving the bank?
I analysed 5 years of bank churn data (2020–2024) using Excel & Tableau to find out!
🔑 Key findings:
Average Churn Rate: 20.36% (1 in 5 customers leave yearly).
High-Risk Segments: Females, Gen X/Millennials, single-product holders, inactive users.
Peak Churn Months: March & December.
I turned raw data into actionable strategies for retention campaigns and personalised marketing.
Explore the interactive dashboard & full insights here: [Paste your Tableau Public or GitHub Link Here]
#DataAnalysis #Tableau #Excel #ChurnAnalysis #Banking #DataVisualisation #Consulting
21
155
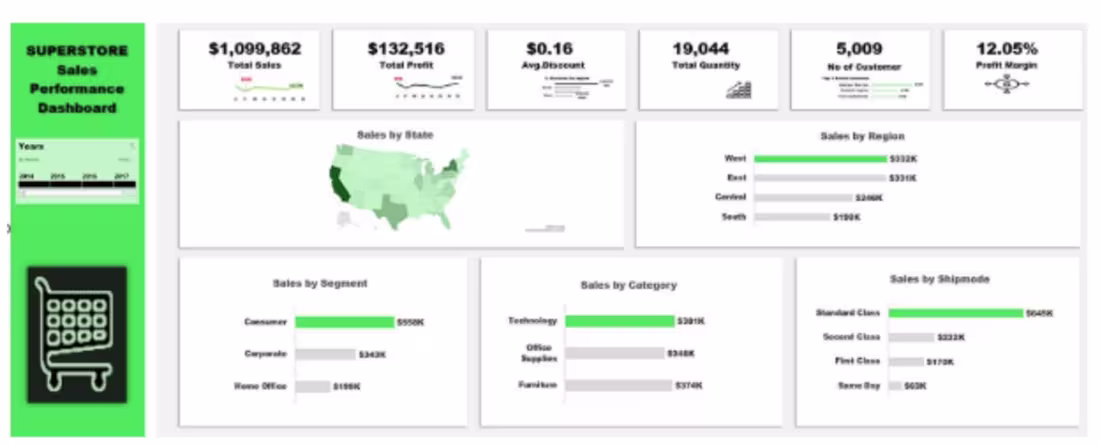
Analysed 4 years of Superstore sales data with Excel. Discovered peak seasonal trends and key regional opportunities. Check out the automated dashboard & full insights here: [https://princemoto.github.io/Motojesi-portfolio/# ]
#DataAnalysis #PowerBI #Excel #BusinessIntelligence #Consulting
2
22
173