
Nityananda Khelo
Data Analyst & Visualizer | Excel, SQL, and Power BI


Employee Workforce & Attrition Analytics Dashboard
I designed and developed an interactive Employee Workforce & Attrition Analytics Dashboard in Microsoft Power BI to provide a clear, data-driven view of workforce structure, compensation, employee demographics, and hiring trends.
The dashboard analyzes 2K+ employees and provides key business metrics including total annual salary, average salary, and average performance rating. It also enables users to explore employee distribution across departments, locations, employment types, and gender, while the hiring trend visualization highlights workforce growth over time.
Key Features
Executive-level KPI cards for workforce and compensation metrics
Employee distribution by employment type
Department-wise and location-wise workforce analysis
Gender distribution analysis
Employee hiring trends by year
Interactive department filtering for focused analysis
Clean, professional, and business-oriented dashboard design
Tools Used
Microsoft Power BI | Data Visualization | DAX | Business Intelligence
This project demonstrates my ability to transform employee data into clear, interactive, and actionable business insights using Power BI.
2
208
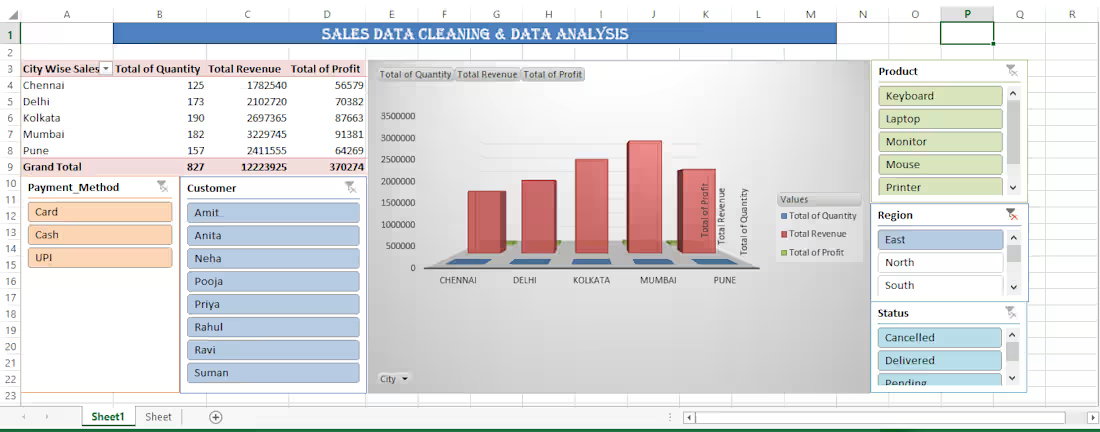
In this project, I worked on cleaning raw sales data and transforming it into meaningful insights using Microsoft Excel. I applied pivot tables and interactive filters to organize information by city, product, payment method, and customer. The analysis highlighted key performance metrics such as total quantity sold, total revenue, and profit across five major cities.
Mumbai emerged as the top-performing city with the highest revenue and profit, while Chennai showed the lowest figures. The final dashboard included a 3D bar chart for clear visualization, making it easy to compare city-wise performance at a glance.
This project demonstrates my ability to:
Perform data cleaning and structuring
Build pivot tables for multi-dimensional analysis
Apply filters for dynamic exploration
Create professional charts for business insights
Impact: The analysis provided actionable insights into regional sales performance, helping identify strong markets and areas for improvement.
2
2
310
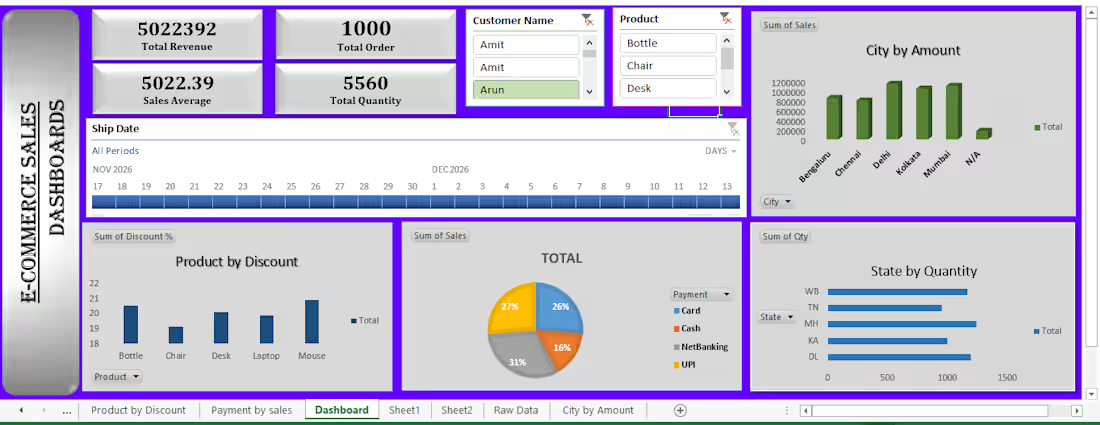
This project focuses on analyzing and visualizing e‑commerce sales data using Microsoft Excel. I designed a dynamic dashboard that consolidates key business metrics such as total revenue (₹5,022,392), total orders (1000), average sales value, and total quantity sold.
The dashboard integrates multiple interactive charts and filters:
Product by Discount – highlights discount distribution across items.
City by Amount – compares sales performance across major cities like Bengaluru, Chennai, Delhi, Kolkata, and Mumbai.
State by Quantity – shows product demand across states (WB, TN, MH, KA, DL).
Payment Method Analysis – pie chart breakdown of Card, Cash, NetBanking, and UPI transactions.
With timeline filters and customer/product selectors, the dashboard enables flexible exploration of sales trends.
Key Skills Demonstrated:
Data cleaning and preparation
Pivot tables and advanced Excel formulas
Dashboard design with interactive filters
Business insights through visualization
Impact: This dashboard provides a clear, data‑driven view of e‑commerce performance, helping identify top‑performing cities, customer preferences, and payment trends for better decision‑making.
1
158
I created an E-Commerce Sales Analysis project to analyze sales data and generate meaningful business insights. I used Excel for data cleaning and analysis, SQL for querying the data, and Power BI to create an interactive dashboard. I analyzed key metrics such as revenue by product, revenue by region, orders, product performance, and top 5 customers. The project helped me understand how data can be transformed into useful insights for business decision-making.
1
153