The network for creativity
Join 1.25M professional creatives like you
Connect with clients, get discovered, and run your business 100% commission-free
Creatives on Contra have earned over $150M and we are just getting started
Back to feedPost

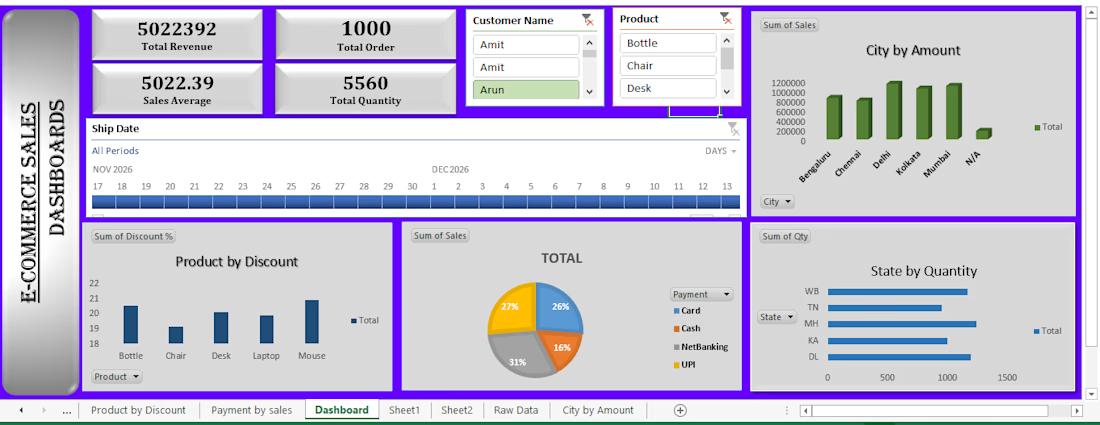
This project focuses on analyzing and visualizing e‑commerce sales data using Microsoft Excel. I designed a dynamic dashboard that consolidates key business metrics such as total revenue (₹5,022,392), total orders (1000), average sales value, and total quantity sold.
The dashboard integrates multiple interactive charts and filters:
Product by Discount – highlights discount distribution across items.
City by Amount – compares sales performance across major cities like Bengaluru, Chennai, Delhi, Kolkata, and Mumbai.
State by Quantity – shows product demand across states (WB, TN, MH, KA, DL).
Payment Method Analysis – pie chart breakdown of Card, Cash, NetBanking, and UPI transactions.
With timeline filters and customer/product selectors, the dashboard enables flexible exploration of sales trends.
Key Skills Demonstrated:
Data cleaning and preparation
Pivot tables and advanced Excel formulas
Dashboard design with interactive filters
Business insights through visualization
Impact: This dashboard provides a clear, data‑driven view of e‑commerce performance, helping identify top‑performing cities, customer preferences, and payment trends for better decision‑making.

The network for creativity
Join 1.25M professional creatives like you
Connect with clients, get discovered, and run your business 100% commission-free
Creatives on Contra have earned over $150M and we are just getting started




Related posts

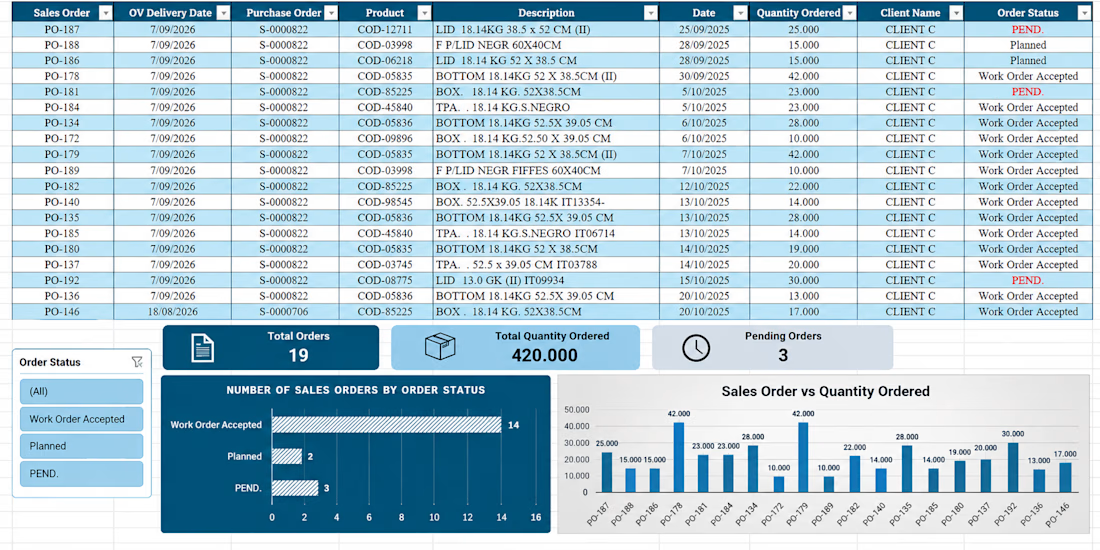
Developed an Excel dashboard for tracking sales orders, organizing order data, monitoring order status, and analyzing requested quantities. The project included data organization, filters, KPI summaries, and visual charts to improve data comprehension and support informed decision-making.

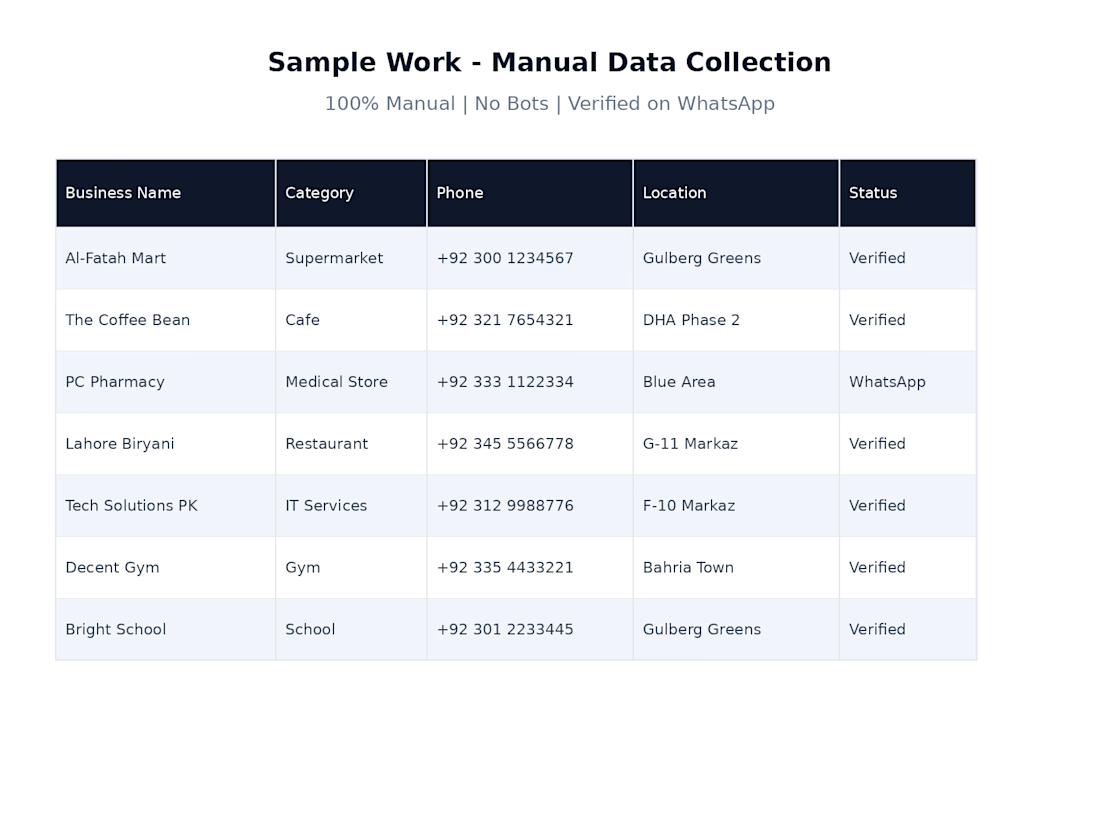
Sample of my manual business data collection work using Google Maps. I verified business details and organized the information into a clean, structured Excel sheet for marketing and lead generation.


Hello is there any #Dataentry jobs available?

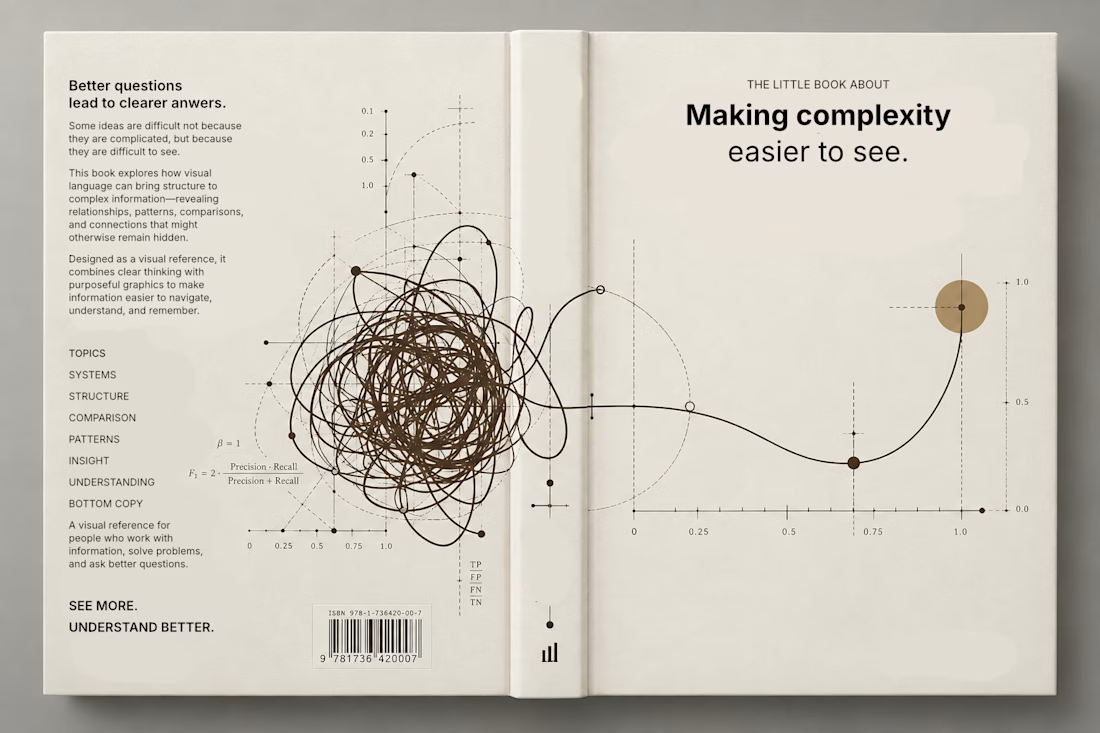
Currently exploring a book design focused on making complex information easier to understand through visual language. Playing with typography, data visualization, and graphic systems to give the subject a more editorial feel.


This is a trully elegant and impressive design concept.
I love it.