
Nik Maryam Nik Rusli
Excel & Canva | Data Entry | Graphic Design
- 1
- Followers


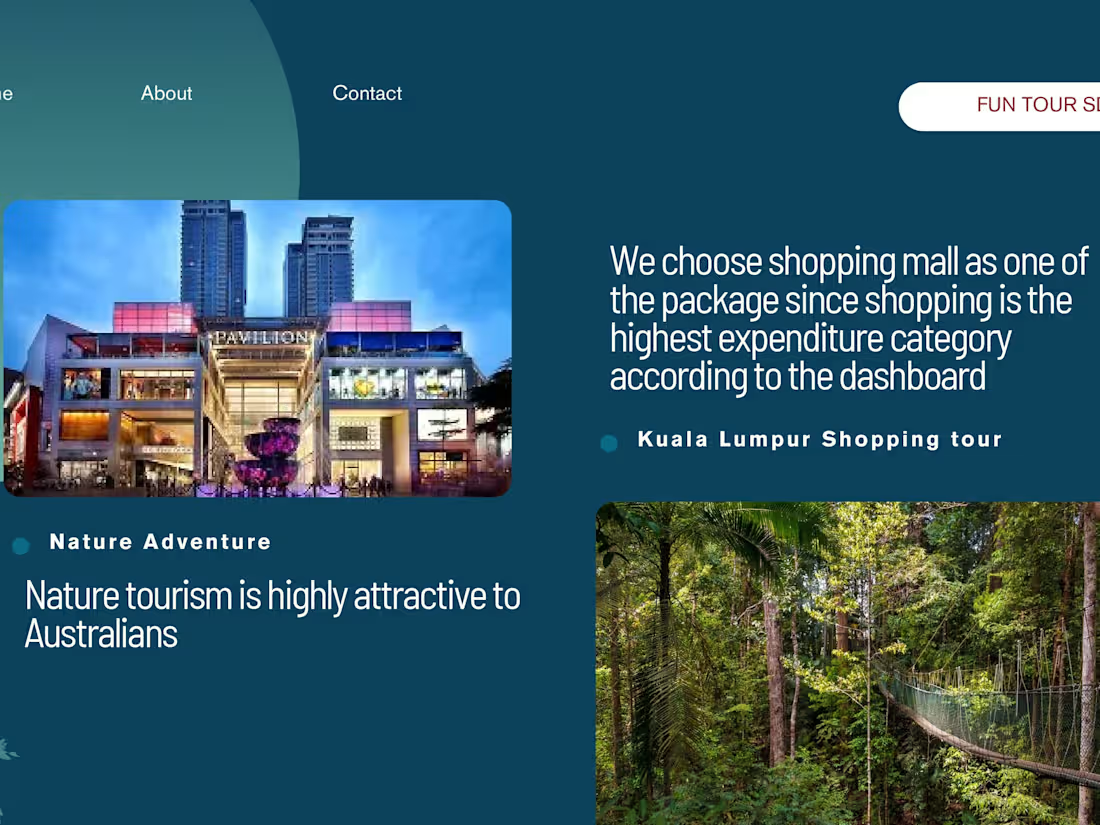
Developed a travel agency website concept to attract Australian tourists to Malaysia. The project includes tourist visit analysis, an overview of Australia's tourism market, and a proposed 5-day, 4-night Malaysia Ultimate Escape package. The package features Kuala Lumpur sightseeing and shopping, nature adventures, and a Penang heritage tour. The website combines tourism insights with travel package information to promote Malaysia as an attractive travel destination.
0
1
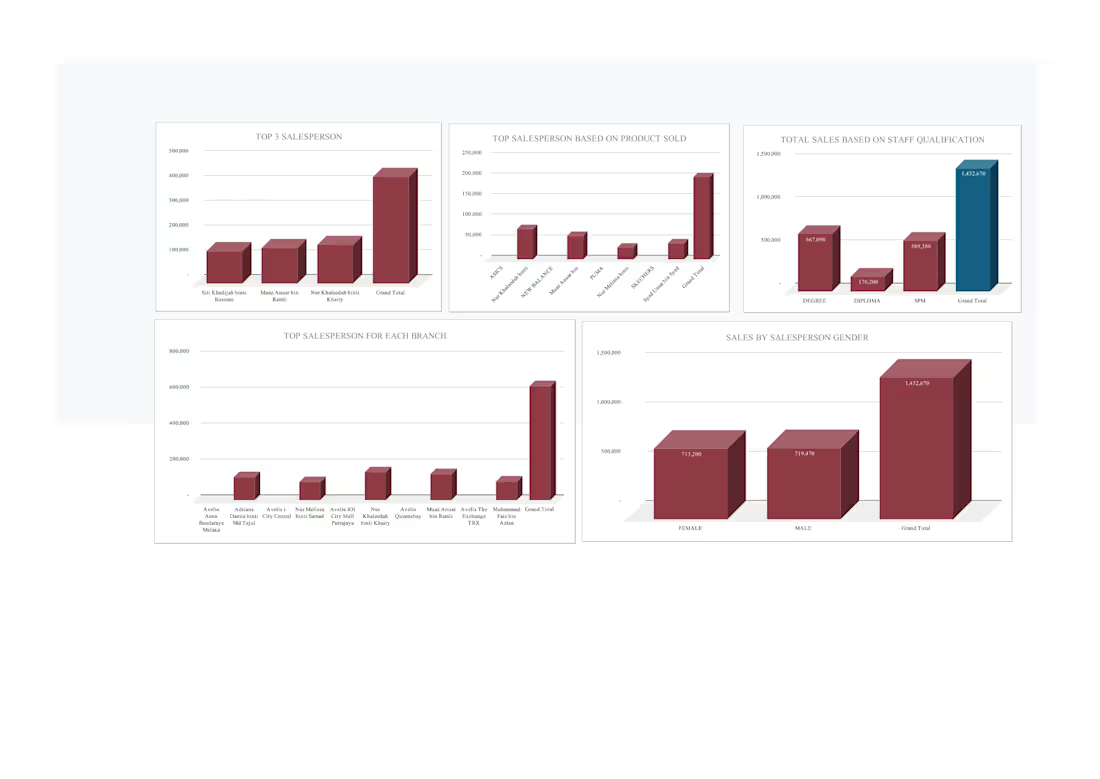
The project involved analysing sales data from 2024 to 2025 and transforming complex business information into clear, visually appealing charts and reports using Microsoft Excel.
I utilised Excel PivotTables, PivotCharts, and data visualization techniques to organize and present business information effectively.
This project demonstrates my ability to transform raw data into meaningful business insights, identify sales trends, evaluate performance, and create professional Excel dashboards that support data-driven decision-making.
0
21
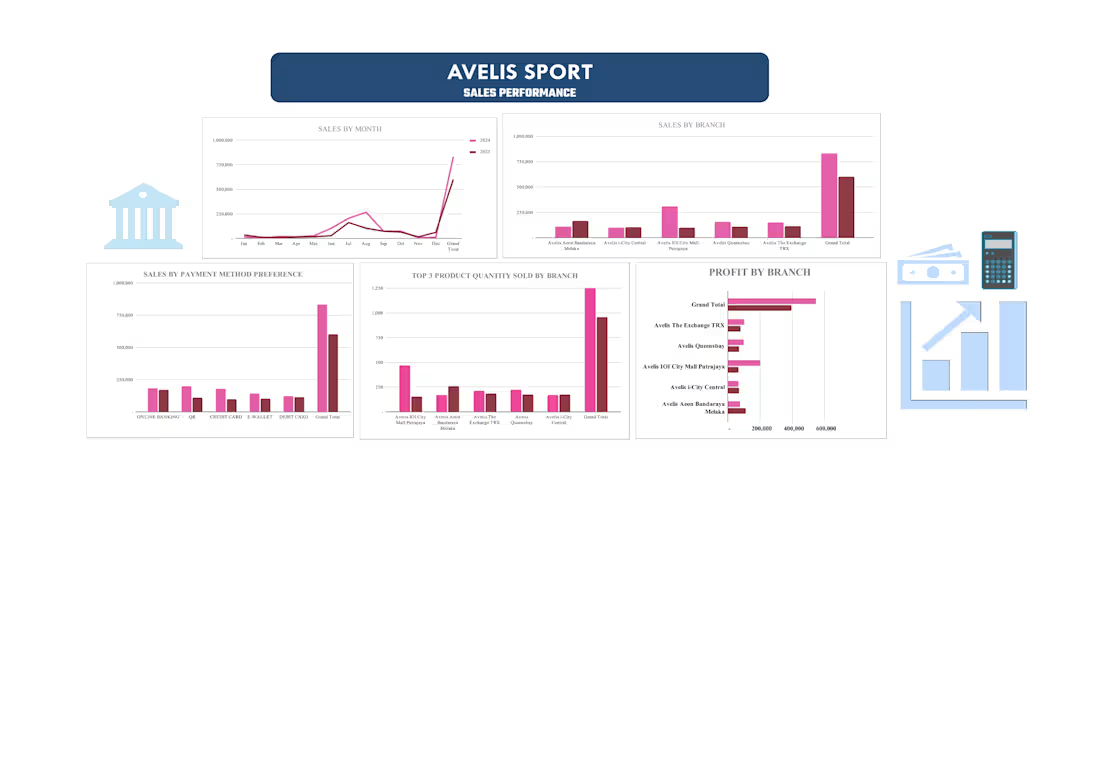
The project involved analysing sales data from 2024 to 2025 and transforming complex business information into clear, visually appealing charts and reports using Microsoft Excel.
Key features of the dashboard include:
- Sales performance analysis across five retail branches.
I utilised Excel PivotTables, PivotCharts, and data visualization techniques to organize and present business information effectively.
This project demonstrates my ability to transform raw data into meaningful business insights, identify sales trends, evaluate performance, and create professional Excel dashboards that support data-driven decision-making.
0
28
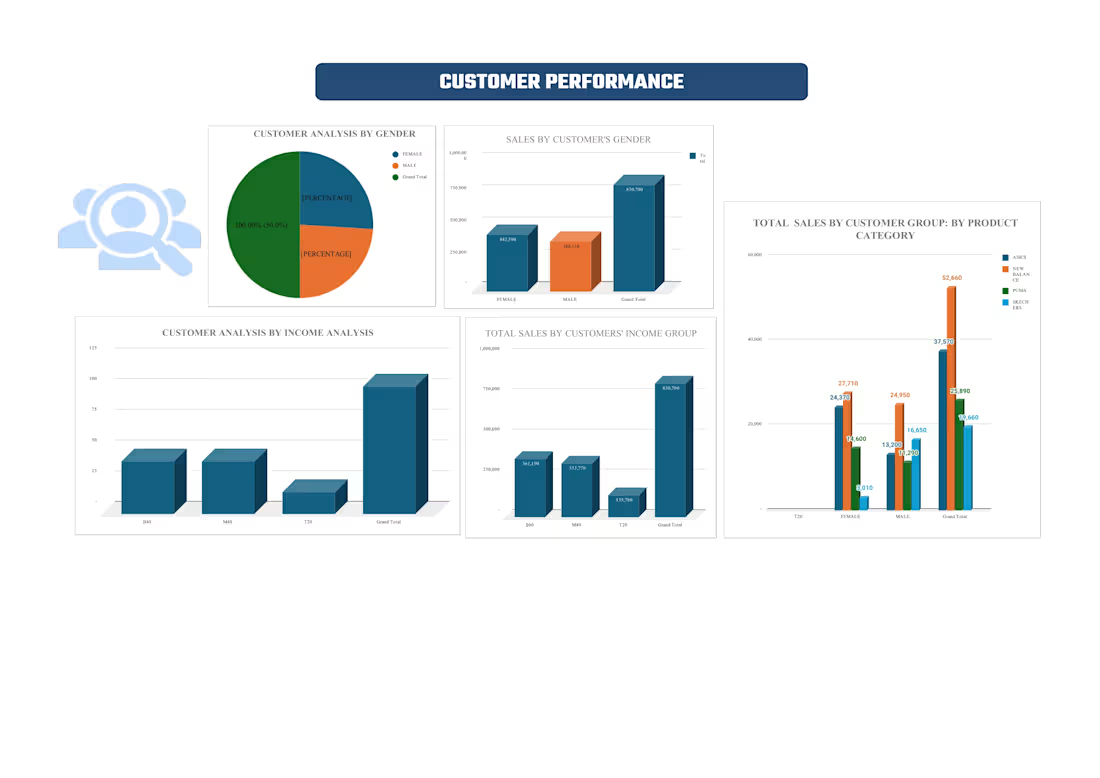
I developed a comprehensive Excel Sales Performance Dashboard. The project involved analyzing sales data from 2024 to 2025 and transforming complex business information into clear, visually appealing charts and reports using Microsoft Excel.
Key features of the dashboard include:
- Customer payment method preferences.
I utilised Excel PivotTables, PivotCharts, and data visualization techniques to organize and present business information effectively.
This project demonstrates my ability to transform raw data into meaningful business insights, identify sales trends, evaluate performance, and create professional Excel dashboards that support data-driven decision-making.
0
26