The network for creativity
Join 1.25M professional creatives like you
Connect with clients, get discovered, and run your business 100% commission-free
Creatives on Contra have earned over $150M and we are just getting started
Back to feedPost
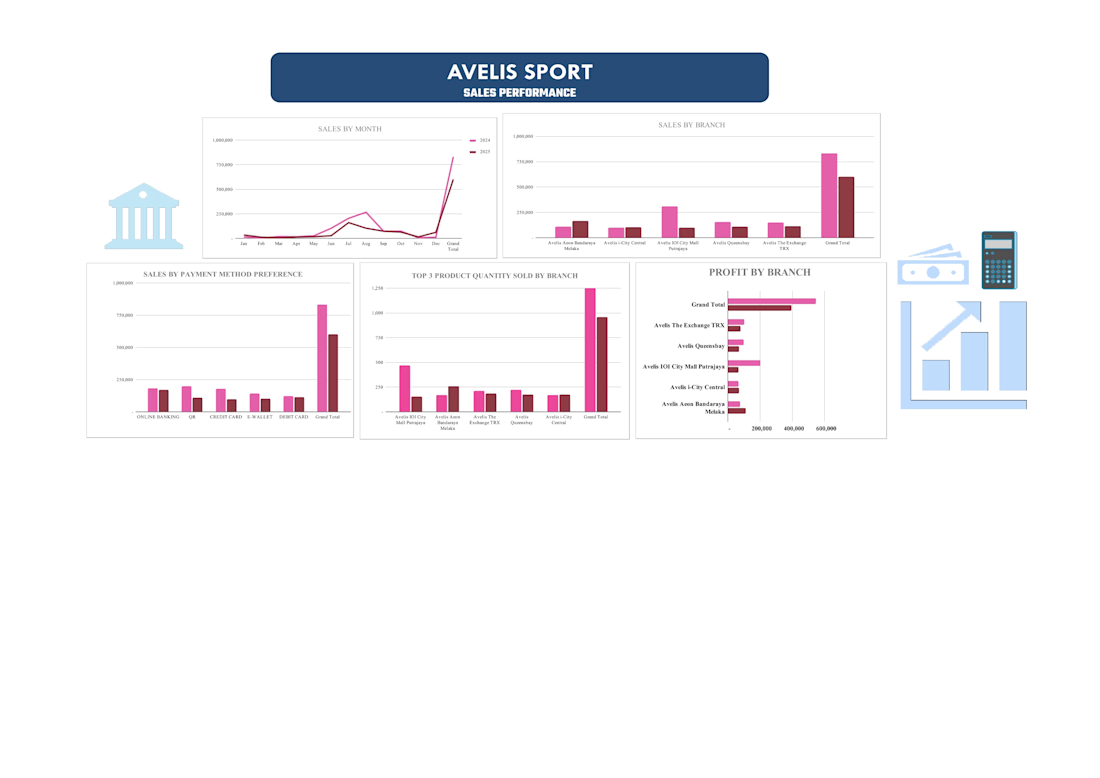
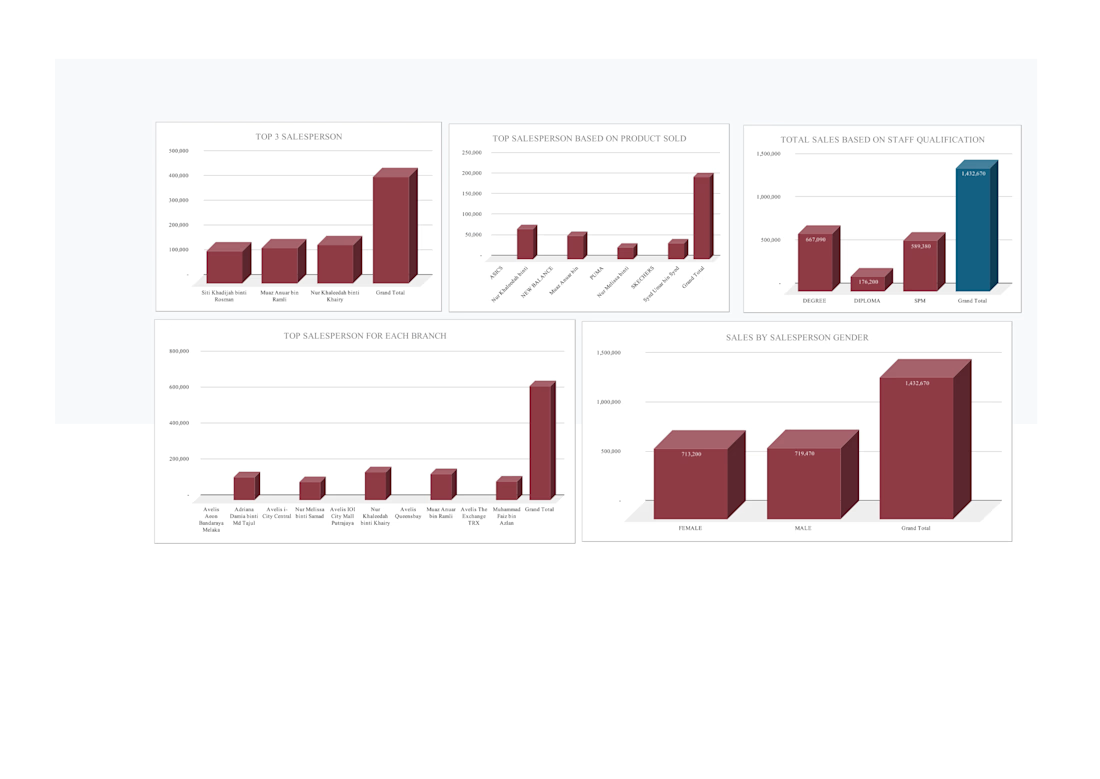
The project involved analysing sales data from 2024 to 2025 and transforming complex business information into clear, visually appealing charts and reports using Microsoft Excel.
I utilised Excel PivotTables, PivotCharts, and data visualization techniques to organize and present business information effectively.
This project demonstrates my ability to transform raw data into meaningful business insights, identify sales trends, evaluate performance, and create professional Excel dashboards that support data-driven decision-making.

The network for creativity
Join 1.25M professional creatives like you
Connect with clients, get discovered, and run your business 100% commission-free
Creatives on Contra have earned over $150M and we are just getting started









Related posts

Imagining you book your flight while experiencing
Meet Contrail.
Complex data into beautiful visuals in 3d.
Demo: https://flights-gr8r.vercel.app


Booking a flight with a 3D plane in the search is a fun idea. The dark UI makes the model stand out well.

I developed a comprehensive Excel Sales Performance Dashboard. The project involved analyzing sales data from 2024 to 2025 and transforming complex business information into clear, visually appealing charts and reports using Microsoft Excel.
Key features of the dashboard include:
- Customer payment method preferences.
I utilised Excel PivotTables, PivotCharts, and data visualization techniques to organize and present business information effectively.
This project demonstrates my ability to transform raw data into meaningful business insights, identify sales trends, evaluate performance, and create professional Excel dashboards that support data-driven decision-making.
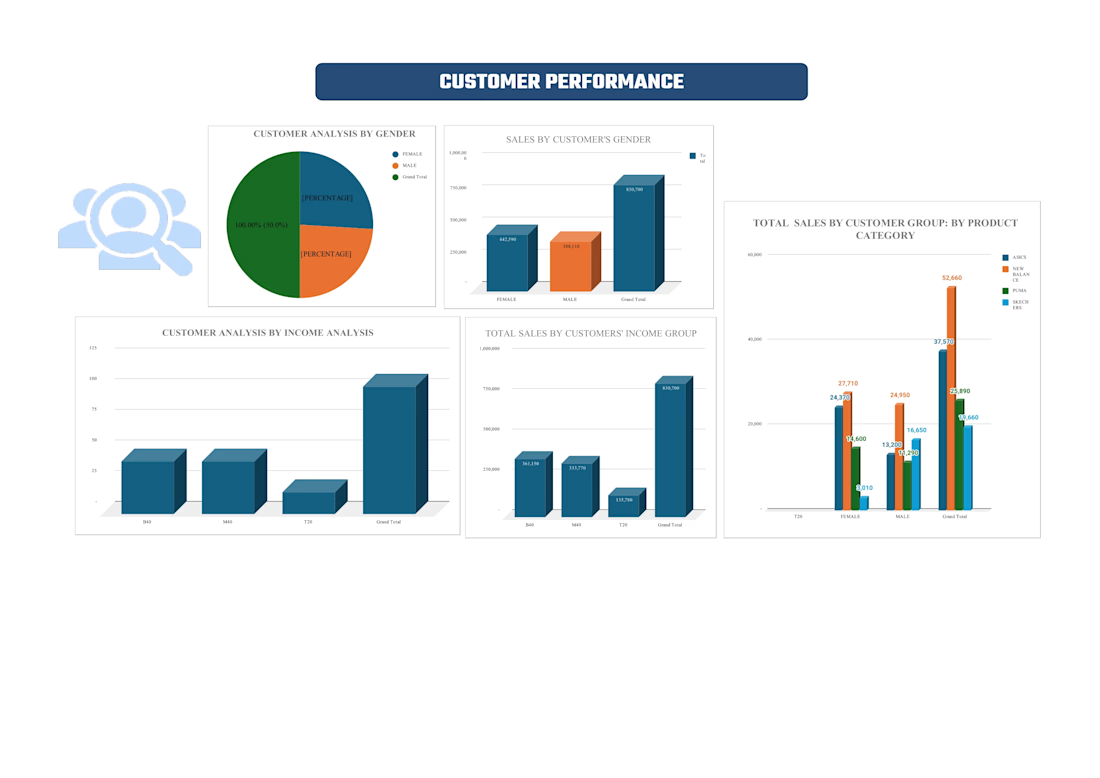
The project involved analysing sales data from 2024 to 2025 and transforming complex business information into clear, visually appealing charts and reports using Microsoft Excel.
Key features of the dashboard include:
- Sales performance analysis across five retail branches.
I utilised Excel PivotTables, PivotCharts, and data visualization techniques to organize and present business information effectively.
This project demonstrates my ability to transform raw data into meaningful business insights, identify sales trends, evaluate performance, and create professional Excel dashboards that support data-driven decision-making.