
Nandani Jha
Data Analyst| Machine Learning| Blockchain
New to Contra
Nandani is building their profile!
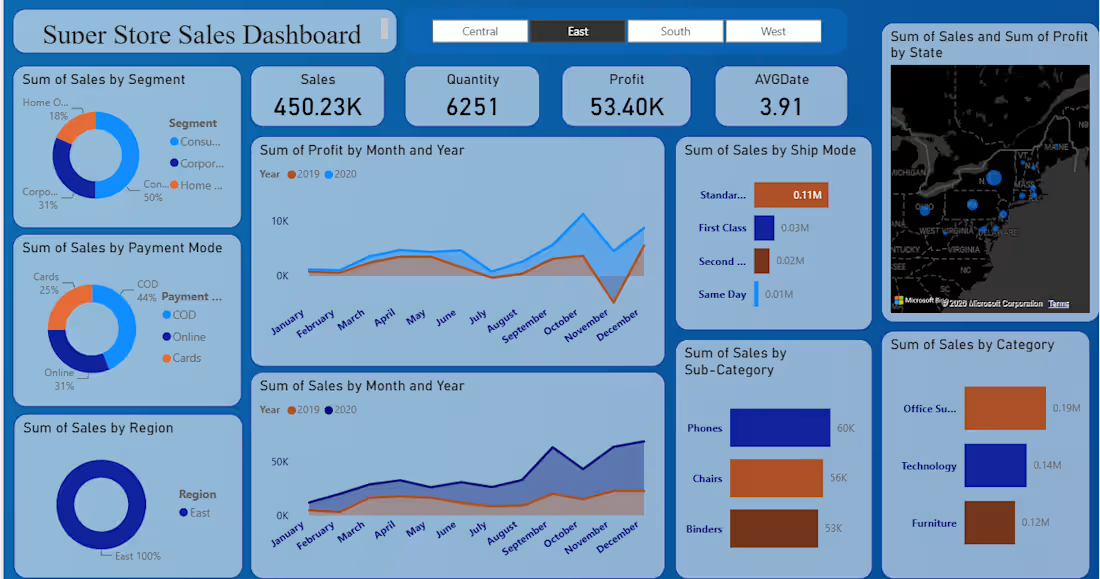
Designed an interactive Power BI dashboard to analyze Super Store sales performance across multiple business dimensions. The dashboard enables users to monitor sales, profit, quantity sold, shipping methods, product categories, customer segments, payment modes, and regional performance through dynamic visualizations and filters.
The solution transforms raw sales data into actionable business insights, helping stakeholders identify profitable products, high-performing regions, seasonal sales trends, and customer purchasing behavior.
0
3
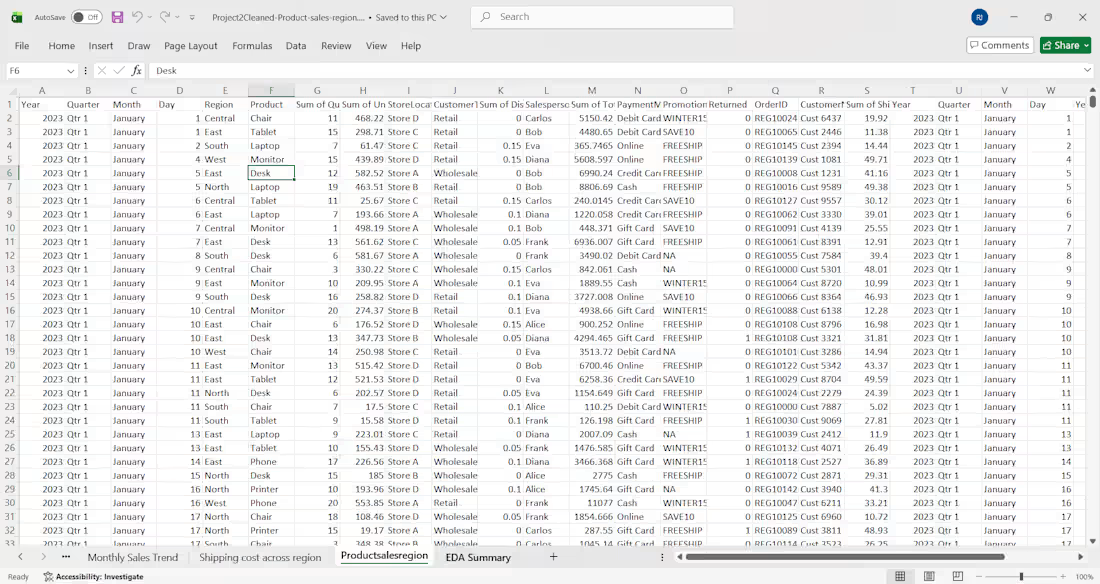
Product Sales & Regional Performance Analysis
Overview
Performed an end-to-end sales data analysis on a retail dataset containing 1,500 transactions to uncover regional sales trends, product performance, and shipping cost patterns. The project involved cleaning the dataset, conducting exploratory data analysis (EDA), and creating business-ready reports in Excel.
Problem
Businesses need to understand which products and regions drive the most revenue to make informed decisions about inventory, pricing, and marketing. This project transformed raw sales data into meaningful insights that support strategic planning.
My Role
Cleaned and validated the sales dataset to ensure data quality and consistency.
Performed Exploratory Data Analysis (EDA) to identify sales trends and business patterns.
Built Pivot Tables and charts to analyze regional performance, product sales, monthly trends, and shipping costs.
Calculated key business metrics, including total sales, average order value, transaction count, and quantity sold.
Created an Excel report summarizing actionable insights for business stakeholders.
Key Insights
Analyzed 1,500 sales transactions with a total sales value of approximately 4.38 million.
Identified the West region as the highest revenue-generating region.
Found that Tablet was the best-performing product by sales.
Observed that February recorded the highest sales activity.
Compared shipping costs across regions and highlighted operational differences.
Tools Used
Microsoft Excel
Pivot Tables
Charts & Data Visualization
Data Cleaning
Exploratory Data Analysis (EDA)
Deliverables
Cleaned sales dataset
Regional sales analysis
Product performance report
Monthly sales trend analysis
Shipping cost analysis
Executive summary with business insights
Business Impact
The analysis provides a clear view of sales performance across products and regions, helping businesses identify high-performing markets, optimize inventory planning, and support data-driven decision-making.
0
4
Online Order Sales Analysis
Overview
Analyzed an online retail sales dataset to uncover product performance, revenue trends, and customer purchasing patterns. The project focused on cleaning sales data, creating meaningful summaries, and transforming raw information into actionable business insights using Excel.
Problem
Businesses often collect large volumes of sales data, but without proper analysis it is difficult to identify top-performing products, sales trends, and opportunities to improve revenue.
My Role
Cleaned and organized the sales dataset by removing inconsistencies and preparing it for analysis.
Created Pivot Tables to summarize sales performance across products and categories.
Analyzed revenue trends and identified best-selling products.
Built charts and visual reports to present key business insights.
Delivered a structured Excel dashboard that supports data-driven decision-making.
Tools Used
Microsoft Excel
Pivot Tables
Charts & Data Visualization
Deliverables
Cleaned sales dataset
Sales summary reports
Pivot Table analysis
Interactive charts
Business insights and recommendations
Business Impact
This analysis helps businesses understand which products generate the most revenue, monitor sales performance, and make informed inventory and marketing decisions using clear, data-driven reports.
0
7
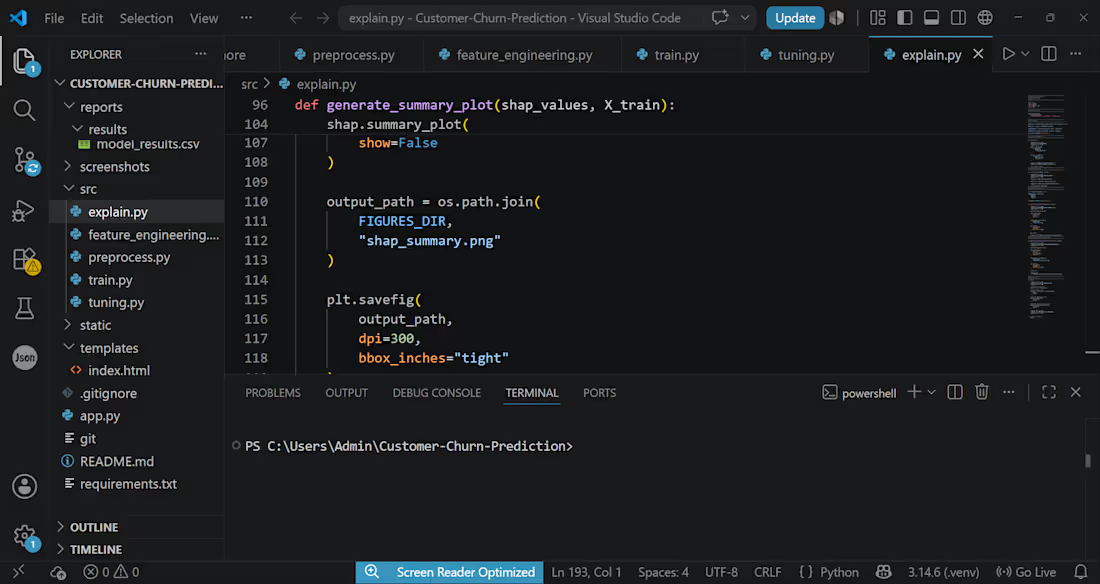
Customer Churn Prediction Using Machine Learning
Overview
Developed an end-to-end machine learning solution to predict customer churn and help businesses identify customers who are likely to leave. The project combined data cleaning, exploratory data analysis, feature engineering, predictive modeling, and interactive reporting to generate actionable business insights.
Problem
Customer retention is more cost-effective than acquiring new customers, but identifying at-risk customers can be challenging. This project aimed to analyze customer behavior and build a predictive model that enables proactive retention strategies.
My Role
Cleaned and preprocessed customer data by handling missing values, duplicates, and inconsistent records.
Performed Exploratory Data Analysis (EDA) to uncover trends, correlations, and churn patterns.
Engineered features and encoded categorical variables for model training.
Built and evaluated multiple machine learning models to predict customer churn.
Compared model performance using standard evaluation metrics.
Created clear visualizations and dashboards to communicate key findings.
Structured the project as an end-to-end machine learning pipeline with reusable code.
Tools & Technologies
Python
Pandas
NumPy
Scikit-learn
XGBoost
Matplotlib
Power BI
Jupyter Notebook
Git & GitHub
Deliverables
Cleaned and transformed customer dataset
Exploratory Data Analysis (EDA) report
Feature engineering pipeline
Trained churn prediction model
Performance evaluation report
Visual dashboards and business insights
Well-documented source code
Business Impact
The solution helps businesses identify customers with a high likelihood of churn, enabling targeted retention campaigns, better customer engagement, and more informed, data-driven decision-making.
0
13