The network for creativity
Join 1.25M professional creatives like you
Connect with clients, get discovered, and run your business 100% commission-free
Creatives on Contra have earned over $150M and we are just getting started
Back to feedPost

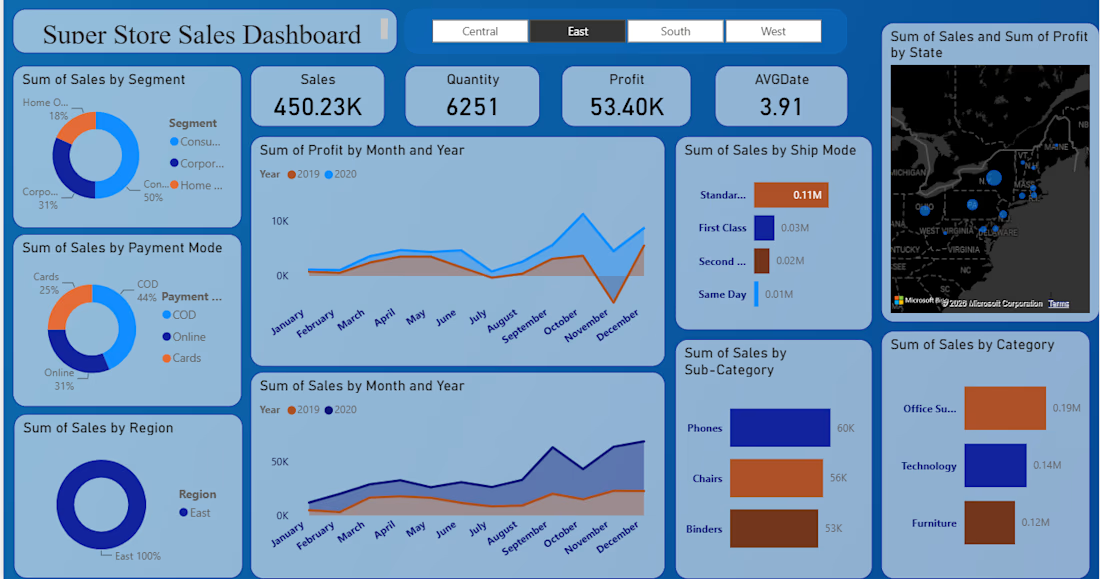
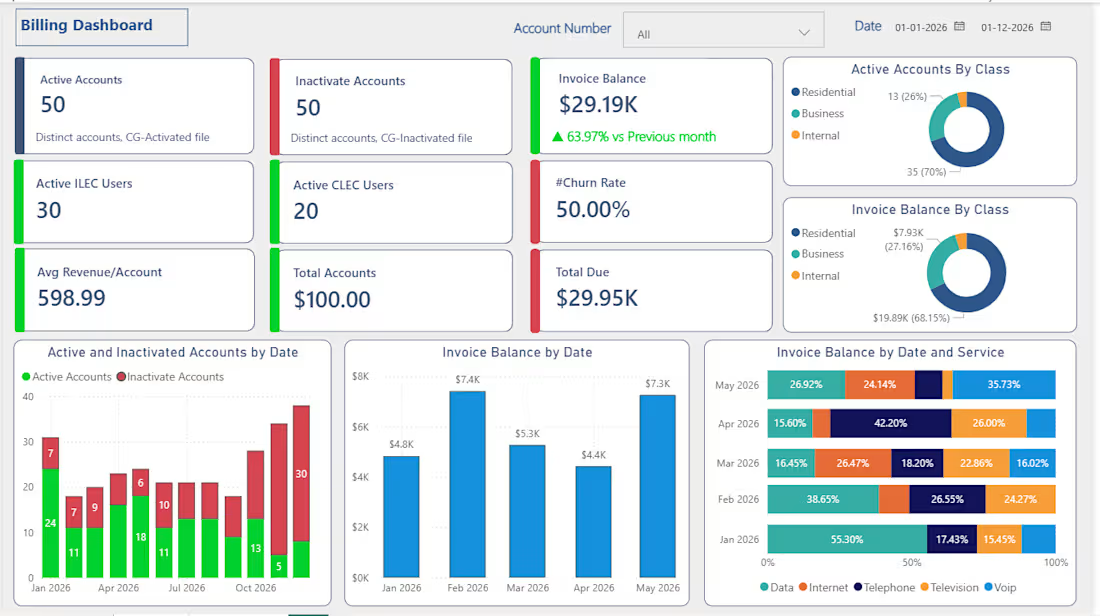
Designed an interactive Power BI dashboard to analyze Super Store sales performance across multiple business dimensions. The dashboard enables users to monitor sales, profit, quantity sold, shipping methods, product categories, customer segments, payment modes, and regional performance through dynamic visualizations and filters.
The solution transforms raw sales data into actionable business insights, helping stakeholders identify profitable products, high-performing regions, seasonal sales trends, and customer purchasing behavior.

The network for creativity
Join 1.25M professional creatives like you
Connect with clients, get discovered, and run your business 100% commission-free
Creatives on Contra have earned over $150M and we are just getting started
Trending
retrofuturism
Share your favorite designs from the past exploring the distant future. Or your own take on the aesthetic 🚀
halftone
Dots. Texture. Grain. Let's see your designs using the halftone technique.

Midjourney
Creatives are showing off what they're making with Midjourney.
colorgrade
Video editors sound off: How do you enhance the mood of your video in color grading?


Related posts

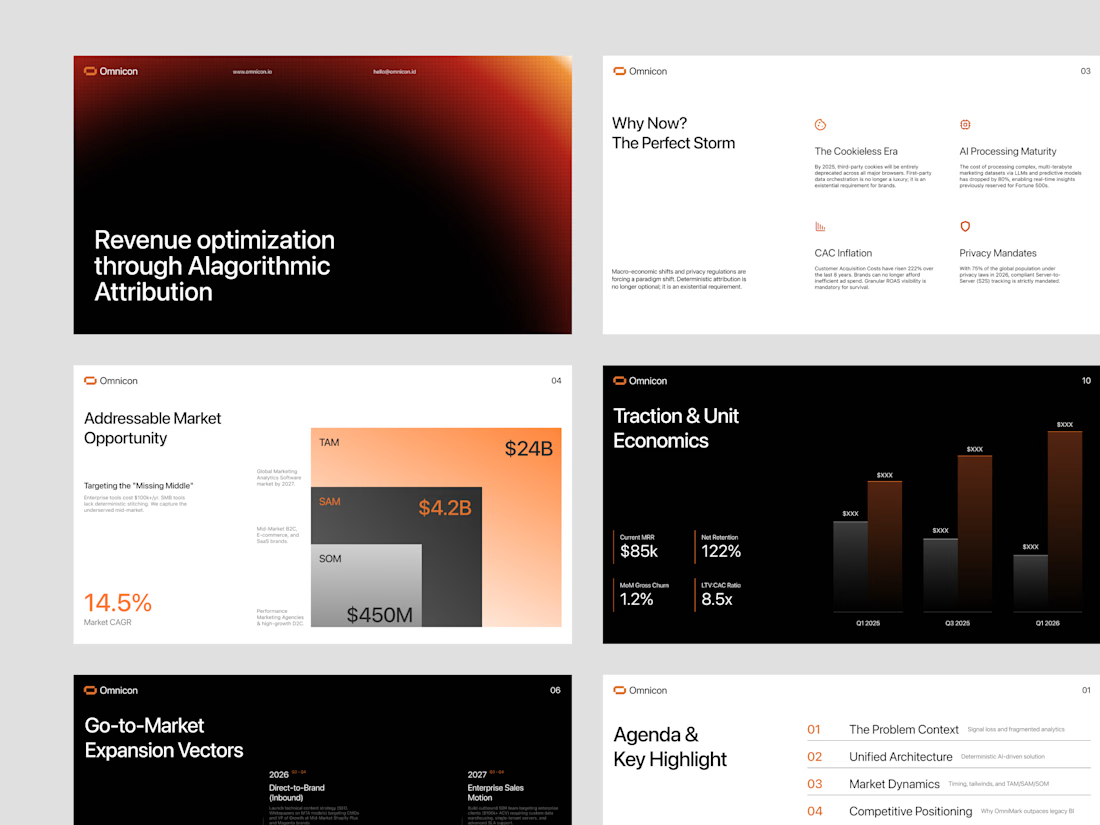
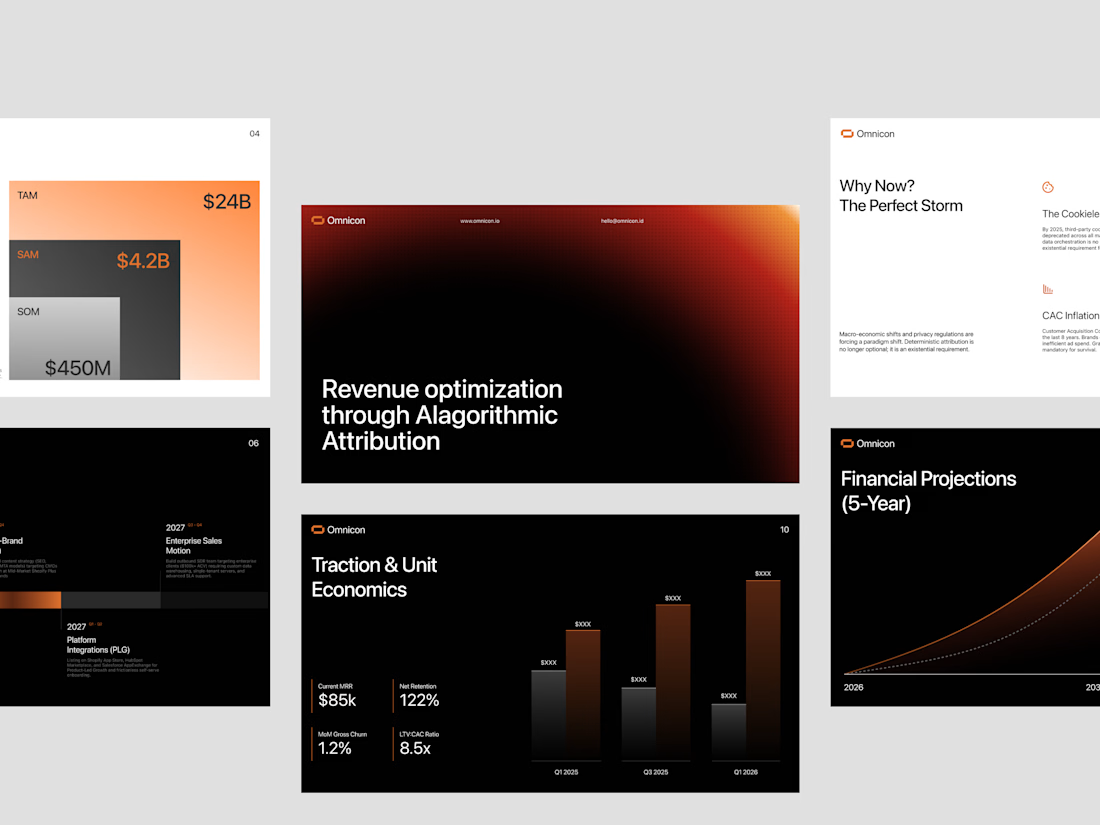
Meet Omnicon — a pitch deck that turns complex marketing analytics into a story investors can follow at a glance. Disciplined black-and-orange visuals meet strong data visualization, from TAM/SAM/SOM breakdowns to traction charts and 5-year projections, making every slide sharp, structured, and easy to absorb. Confident typography and generous spacing keep the narrative clear from problem to financials.
📩 Collaborate with Us? Contra Cansaas Agency

Developed a sales and Revenue dashboard using Microsoft power BI with SQL as data source.



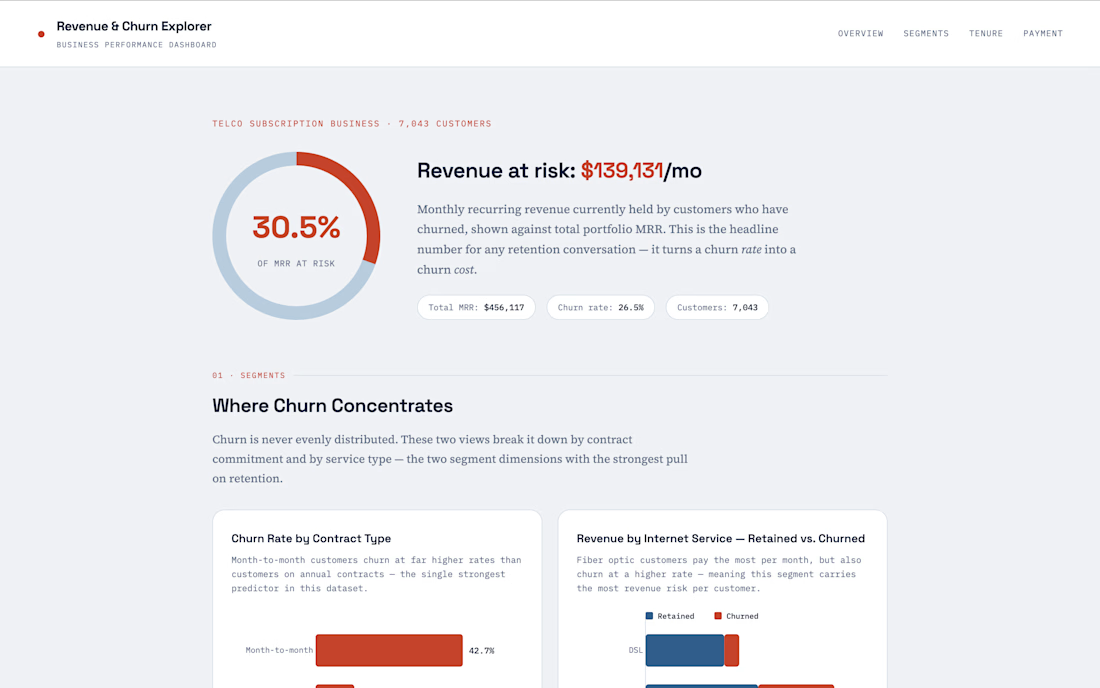
An interactive D3.js dashboard analyzing revenue, churn, and customer segments for a telecom subscription business (7,043 real customers). Calculates "Revenue at Risk" turning a churn rate into a churn cost and finds that contract type is the strongest churn predictor (42.7% for month-to-month vs. 2.8% for two-year contracts), while payment method is a surprisingly strong signal on its own: electronic check users churn at 45.3%, nearly 3x automatic payment methods.