
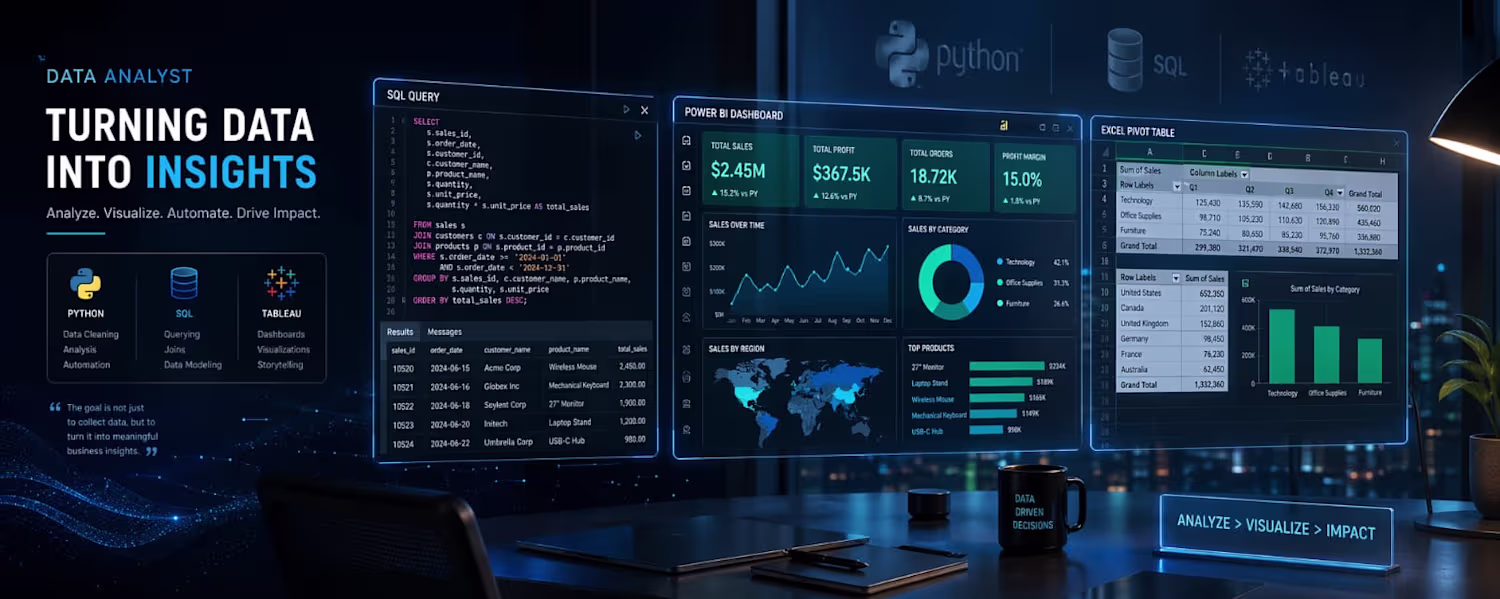
Mujtaba Quadri
Data Analyst | SQL • Python • Excel • Power BI • Tableau
New to Contra
Mujtaba is ready for their next project!
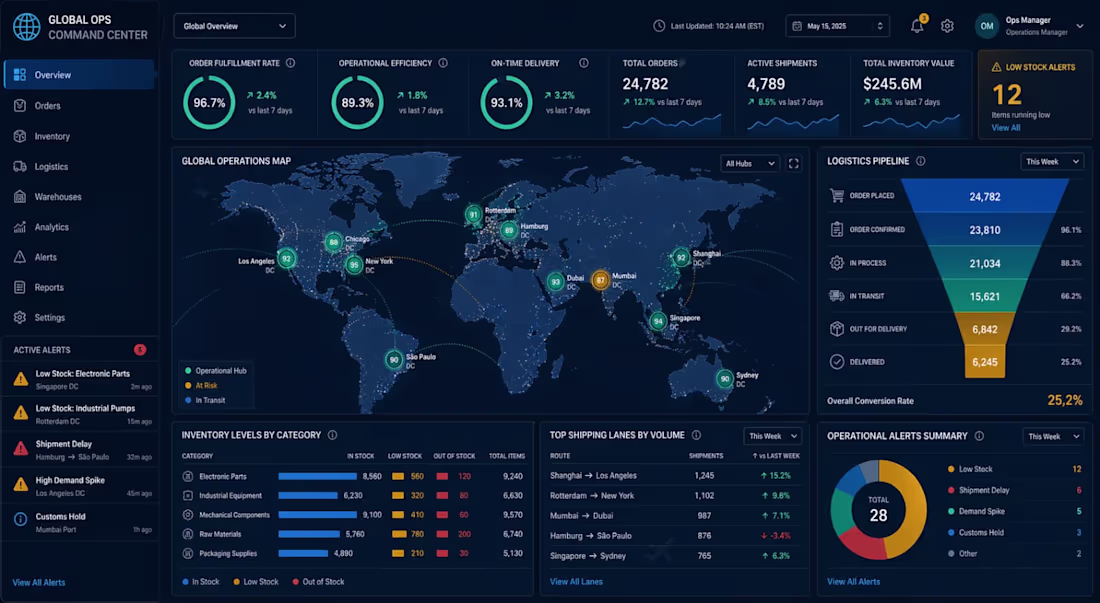
This Project Focused On The Architecture Of A Dynamic Operational Command Center Designed To Optimize Global Supply Chain Logistics And Inventory Management. By Integrating Multi-Source Data Streams Using Advanced SQL Querying, The System Provides Real-Time Visibility Into Key Performance Indicators Such As Order Fulfillment Latency, Inventory Turnover Ratios, And Regional Delivery Success Rates. Utilizing Sophisticated Data Visualization Techniques, The Dashboard Empowers Stakeholders To Identify Logistics Bottlenecks And Streamline Warehouse Operations. The Implementation Of Automated Trend Analysis Facilitated A Significant Reduction In Stock-Out Incidents And Enhanced Overall Operational Efficiency By Providing Granular Insights Into The End-To-End Supply Chain Lifecycle.
1
59
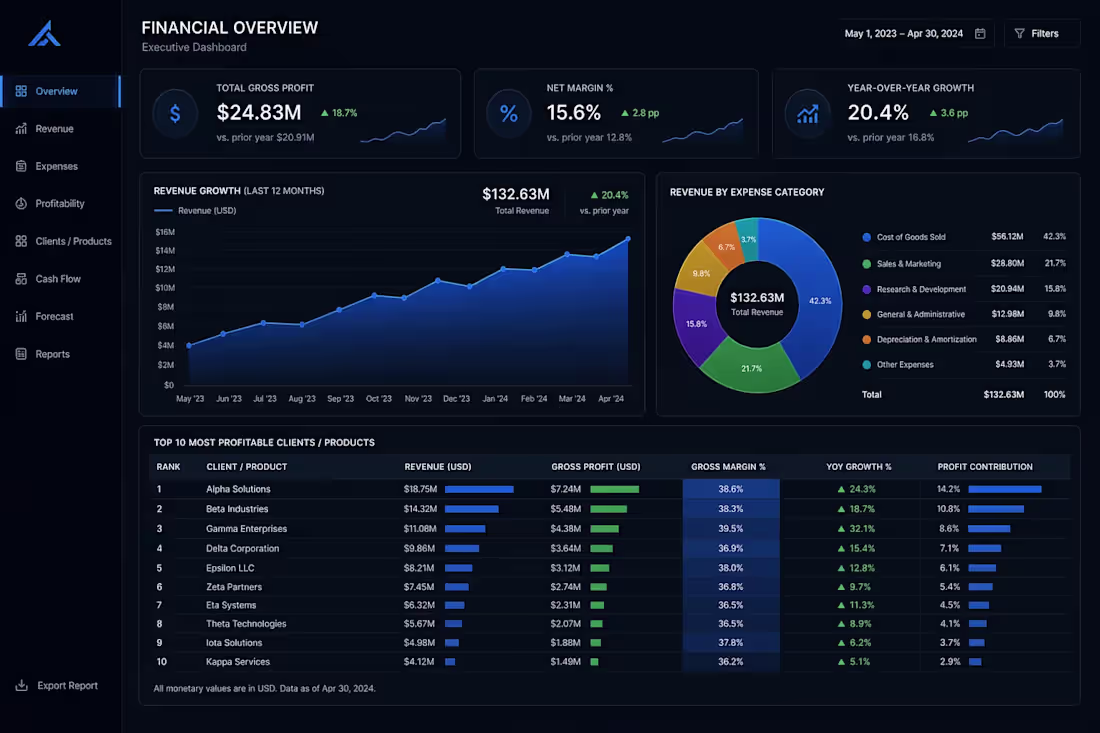
This Project Involved The Development Of A Comprehensive Financial Intelligence Suite Designed To Monitor Corporate Fiscal Health And Strategic Growth Metrics. Utilizing A Unified Data Model Engineered Through Complex SQL Aggregations, The System Integrates Disparate Transactional Streams Into A High-Fidelity Executive Dashboard. The Analysis Focuses On Critical Performance Indicators Including Total Gross Profit ($24.83M), Net Margins (15.6%), And Year-Over-Year (YoY) Revenue Trends. By Implementing Dynamic Profit Contribution Models And Expense Categorization, The Project Provides Stakeholders With Granular Visibility Into Net Profitability Across The Entire Client Portfolio, Facilitating Data-Driven Resource Allocation And Identifying A 20.4% Sustained Growth Trajectory.
1
61
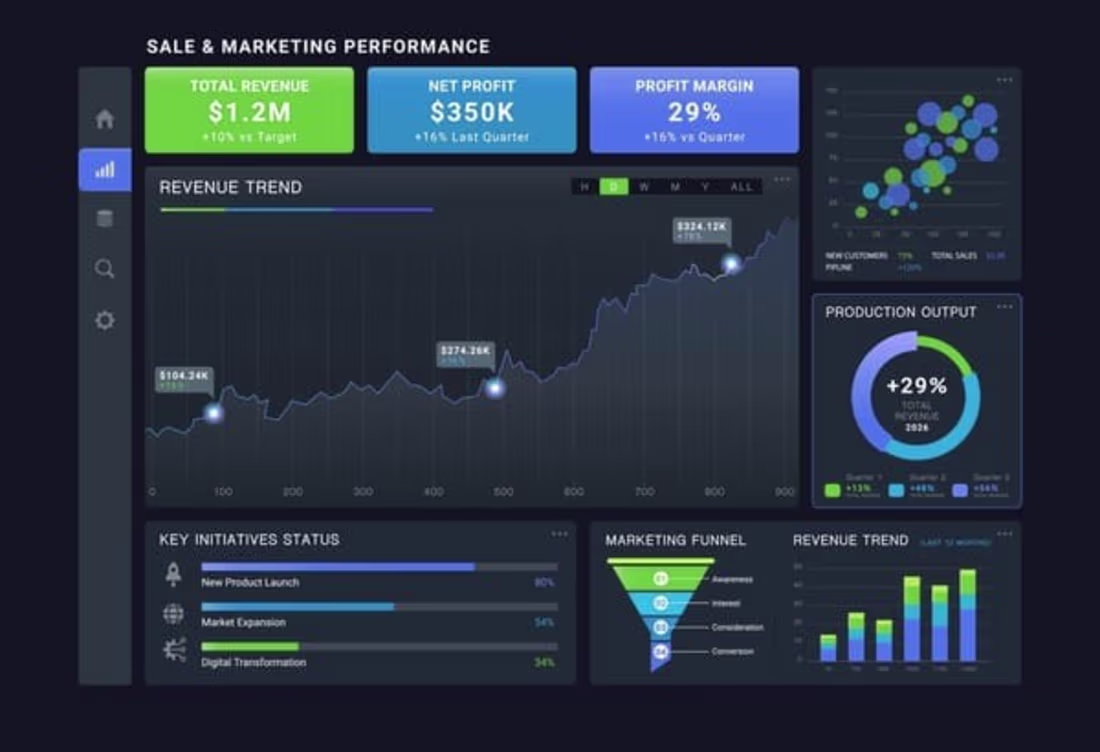
"I Designed A Comprehensive Sales Performance Dashboard To Track Key Business Metrics Across Multiple Regions. By Integrating Raw Data Into A Dynamic Visual Interface, I Provided Leadership With Real-Time Insights Into Profit Margins, Regional Growth, And Product Performance, Enabling Data-Driven Strategy Decisions That Optimized Inventory Allocation."
1
84

"I Developed A SQL-Driven Monitoring System For A Global Supply Chain Network. By Writing Complex Queries To Analyze Inventory Levels Across Multiple International Warehouses, I Created An Automated Flagging System For Low-Stock Items. This Project Demonstrates My Ability To Handle Large-Scale Relational Databases And Provide Actionable Logistics Insights."
1
86

"I Developed An Automated Python Pipeline To Process And Categorize Over 1,000 Customer Reviews. Using The Pandas Library, I Built A Logic-Based Scoring System That Translates Raw Text Into Actionable Sentiment Insights, Helping Product Teams Identify Critical Issues In Real-Time."
1
89
Turning 2.4M+ rows of raw data into business intelligence. 📊
Just wrapped up this end-to-end Swiggy Analytics pipeline. I used SQL to model complex data—calculating KPIs like Customer Lifetime Value (CLV)—and pushed the results to Power BI and Tableau for live, interactive visualization.
🔹 Focus: 99% data accuracy.
🔹 Credential: NASSCOM-Certified Analyst.
🔹 Status: Identity Verified & ready for new automation projects!
#SQL #DataAnalytics #PowerBI #Automation #Freelance
1
344