

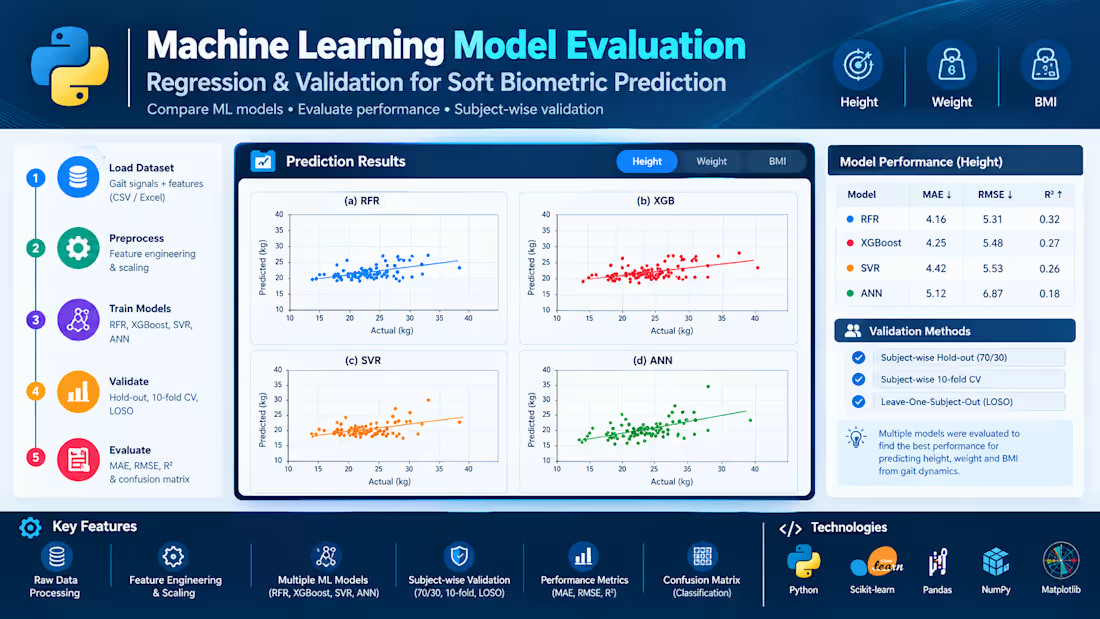
Machine Learning Model Evaluation for Soft Biometric Prediction
Developed and evaluated machine learning models to predict physical characteristics from human gait data collected using inertial sensors. The project compares Random Forest Regression (RFR), XGBoost, Support Vector Regression (SVR), and Artificial Neural Networks (ANN) using engineered gait features.
To assess model generalization to unseen individuals, multiple subject-wise validation strategies were applied, including hold-out validation, 10-fold cross-validation, and Leave-One-Subject-Out (LOSO). Performance was evaluated using MAE, RMSE, and R², with visual comparisons of actual and predicted values.
The project demonstrates an end-to-end workflow for data preprocessing, feature engineering, predictive modelling, and systematic performance evaluation.
0
14

Data Analysis & Visualization with Python: Developed a Python-based data analysis workflow to transform raw datasets into meaningful insights through data cleaning, exploratory data analysis (EDA), statistical analysis, and visualization.
The workflow uses Python's data science libraries to organize datasets, identify patterns and trends, examine relationships between variables, and present findings through clear, informative charts and graphs. The goal is to make complex data easier to understand and support data-driven decision-making.
Key Features:
Data Cleaning & Preprocessing: Handle missing values, inconsistent entries, and data quality issues.
Exploratory Data Analysis: Investigate distributions, patterns, trends, and relationships within datasets.
Statistical Analysis: Calculate descriptive statistics and analyze correlations between variables.
Data Visualization: Create informative charts, graphs, and plots to communicate analytical findings.
Insight Generation: Summarize key observations in a clear and understandable format.
Reproducible Workflow: Use Python scripts and notebooks for transparent, repeatable analysis.
Technologies Used: Python · Pandas · NumPy · Matplotlib · Seaborn · SciPy
0
19

Developed a Python-based automation system that generates personalized exam bubble sheets in a single PDF file using student information stored in Excel.
The system reads each student's name, ID, section, exam date, and required sheet length from an Excel spreadsheet, then automatically populates a custom LaTeX exam template and compiles the output into a PDF document. Each student receives an individually personalized bubble sheet, with support for one-page exams containing up to 100 questions or two-page exams containing up to 200 questions.
The solution streamlines bulk exam preparation, reduces repetitive manual work, and ensures consistent formatting across all generated sheets.
Key Features:
Excel-based student data import
Automated LaTeX template population
Personalized bubble sheets for each student
Support for 100- and 200-question exams
Batch generation of a single multi-page PDF
Automated PDF compilation using Python
Technologies: Python, LaTeX, Pandas, Excel, pdflatex, PDF Automation.
0
21
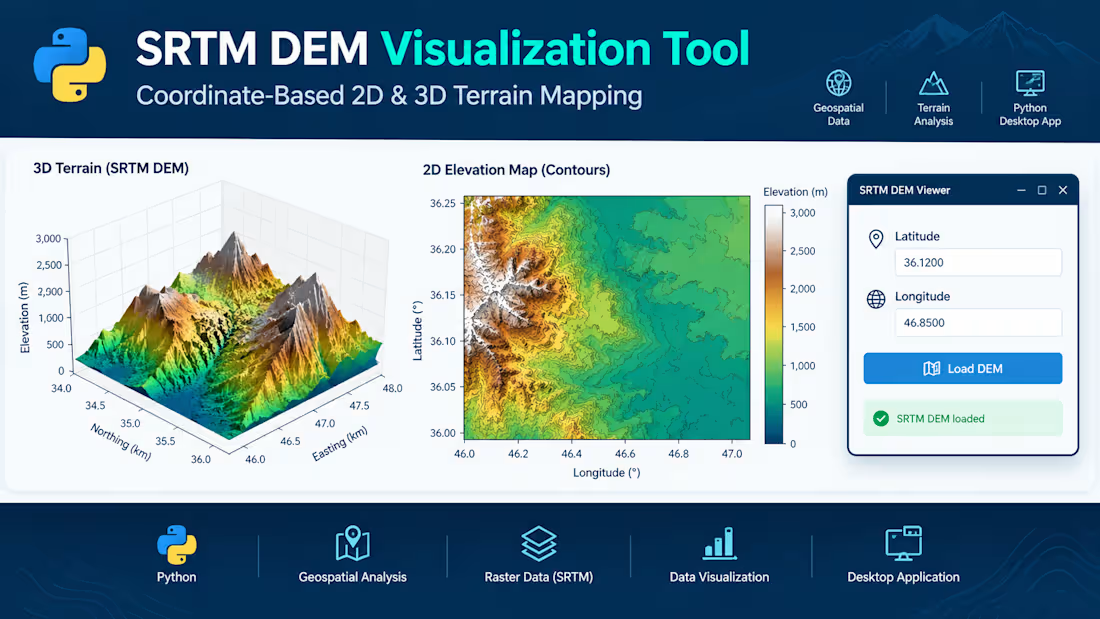
SRTM DEM Visualization Tool – Python Desktop Application
Developed a Python-based desktop application for visualizing Shuttle Radar Topography Mission (SRTM) Digital Elevation Model (DEM) data. The application allows users to enter geographic coordinates (latitude and longitude), load the corresponding elevation data, and explore terrain through interactive 2D and 3D visualizations.
The tool presents a 3D terrain surface to examine landscape features and a 2D elevation map with contour details and elevation-based color mapping. It combines geospatial data processing, raster analysis, and scientific visualization within a user-friendly graphical interface.
Key Features:
- Coordinate-based terrain data selection
- 2D elevation mapping and contour visualization
- 3D terrain surface plotting
- Elevation-based color mapping
- Desktop GUI for convenient data exploration
Technologies: Python, SRTM DEM, geospatial data processing, Matplotlib, 2D/3D visualization, and GUI development.
0
22