
Moses NJUGUNA
Avid Software Engineer, Data Engineer and Technical Writer


Data, AI, Software, Technical Writing
𝗬𝗢𝗨𝗥 𝗦𝗔𝗟𝗘𝗦 𝗗𝗔𝗧𝗔 𝗔𝗟𝗥𝗘𝗔𝗗𝗬 𝗞𝗡𝗢𝗪𝗦 𝗪𝗛𝗜𝗖𝗛 𝗖𝗨𝗦𝗧𝗢𝗠𝗘𝗥𝗦 𝗔𝗥𝗘 𝗔𝗕𝗢𝗨𝗧 𝗧𝗢 𝗟𝗘𝗔𝗩𝗘.
Most owners check that money came in. Few ask what the numbers say about next month.
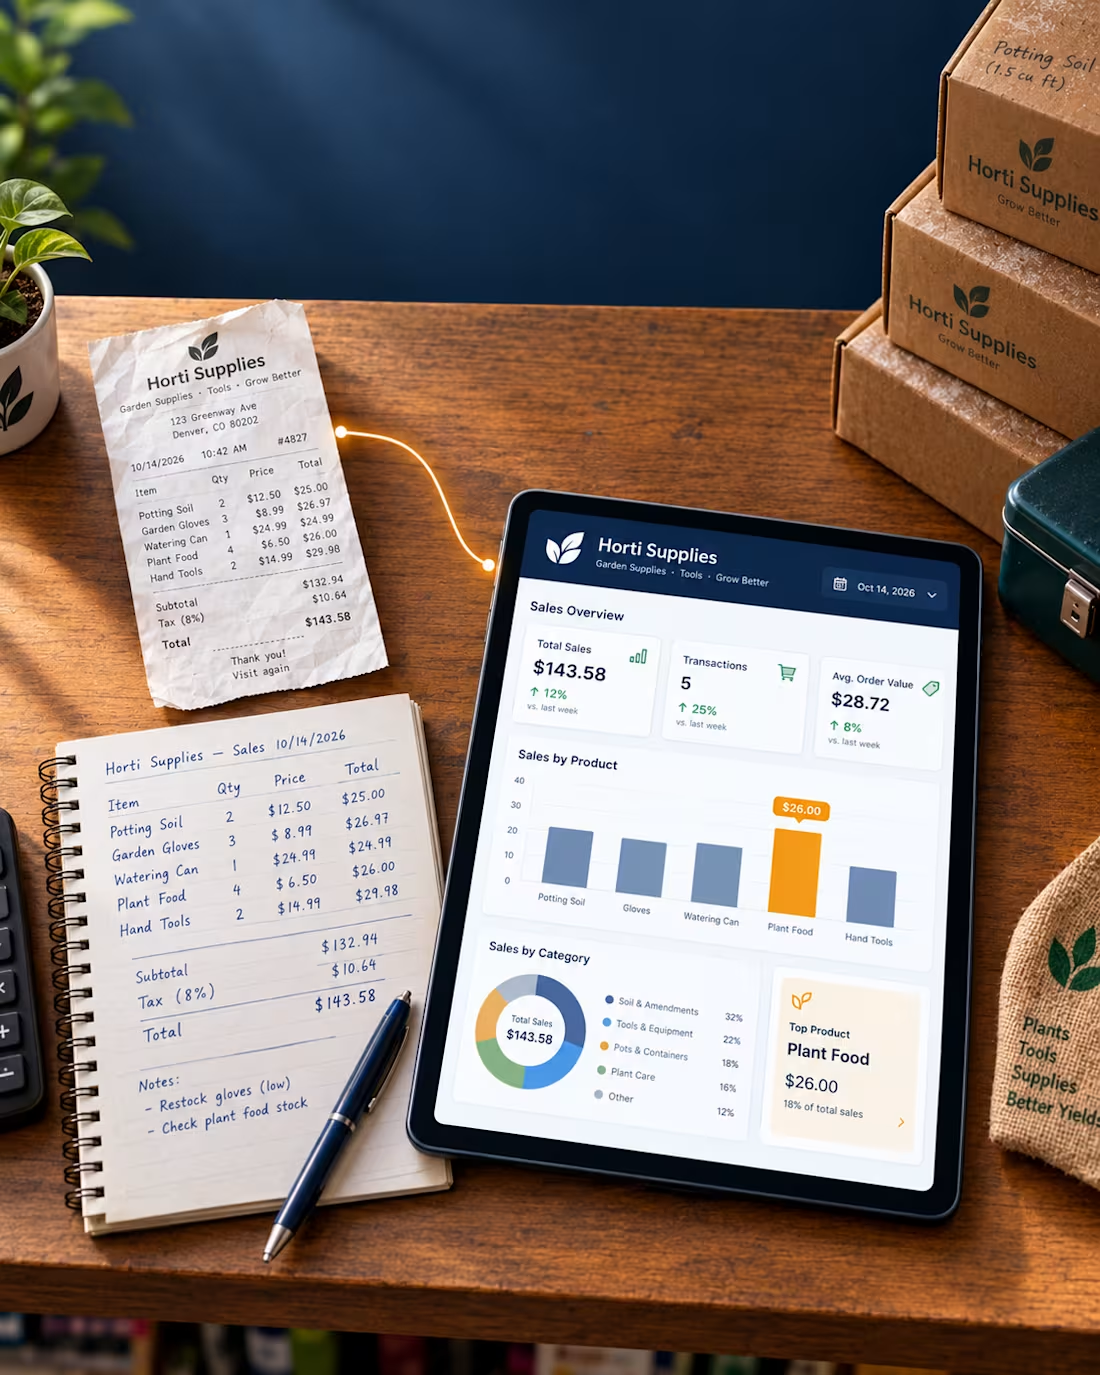
I ran a 90-day Dead Stock Check on Horti Supplies data (about $14,500 in sales).
In plain sight:
👤 𝟲 𝗼𝗳 𝘁𝗵𝗲 𝘁𝗼𝗽 𝟮𝟱 𝗰𝘂𝘀𝘁𝗼𝗺𝗲𝗿𝘀 𝗾𝘂𝗶𝗲𝘁𝗹𝘆 𝘀𝘁𝗼𝗽𝗽𝗲𝗱 𝗯𝘂𝘆𝗶𝗻𝗴: about $550 a month walking away.
$𝟵𝟰𝟬 𝘀𝘁𝘂𝗰𝗸 𝗼𝗻 𝘁𝗵𝗲 𝘀𝗵𝗲𝗹𝗳 - 8 products unsold for 30 to 83 days made 2.4% of sales but held 22% of stock value.
📉 𝗧𝗵𝗲 𝟯𝗿𝗱 𝗯𝗲𝘀𝘁-𝘀𝗲𝗹𝗹𝗶𝗻𝗴 𝗽𝗿𝗼𝗱𝘂𝗰𝘁 𝗿𝗮𝗻𝗸𝗲𝗱 𝟮𝟭𝘀𝘁 𝗳𝗼𝗿 𝗽𝗿𝗼𝗳𝗶𝘁.
🕑 𝗧𝗵𝗿𝗲𝗲 𝘀𝗹𝗼𝘄 𝗮𝗳𝘁𝗲𝗿𝗻𝗼𝗼𝗻 𝗵𝗼𝘂𝗿𝘀 - brought in 7% of sales; rent and staff costs didn’t drop.
𝗧𝗿𝘆 𝘁𝗵𝗶𝘀 𝘁𝗼𝗱𝗮𝘆 (𝟭𝟬 𝗺𝗶𝗻𝘂𝘁𝗲𝘀, 𝗻𝗼 𝘀𝗼𝗳𝘁𝘄𝗮𝗿𝗲): export last month’s sales, sort by profit, and circle anything that earned almost nothing but took up shelf space.
𝗧𝘄𝗼 𝘄𝗮𝘆𝘀 𝗜 𝗰𝗮𝗻 𝗵𝗲𝗹𝗽:
1️⃣ 𝗧𝗵𝗲 𝗗𝗲𝗮𝗱 𝗦𝘁𝗼𝗰𝗸 𝗖𝗵𝗲𝗰𝗸: send one month of sales data (names removed is fine) and get a one-page report on where cash is stuck, which customers are drifting, and 3 actions for this week. 🎁 The first 10 get it free, in return for sharing the anonymised result as a case study.
2️⃣ 𝗖𝗼𝗺𝗶𝗻𝗴 𝘀𝗼𝗼𝗻, 𝗜𝗻𝘀𝗶𝗴𝗵𝘁𝗟𝗼𝗼𝗽: upload a CSV or SQL export and get a named diagnosis (Customer Churn, Dead Stock, Demand Forecast) plus a visual report.
𝗖𝗼𝗺𝗺𝗲𝗻𝘁 “𝗖𝗛𝗘𝗖𝗞” 𝗳𝗼𝗿 𝗮 𝗳𝗿𝗲𝗲 𝗗𝗲𝗮𝗱 𝗦𝘁𝗼𝗰𝗸 𝗖𝗵𝗲𝗰𝗸, 𝗼𝗿 “𝗟𝗢𝗢𝗣” 𝗳𝗼𝗿 𝘁𝗵𝗲 𝗜𝗻𝘀𝗶𝗴𝗵𝘁𝗟𝗼𝗼𝗽 𝘄𝗮𝗶𝘁𝗹𝗶𝘀𝘁.
I’m Moses, a data engineer and founder of Closertune. Do you know an owner who says, “Sales are slow, but I don’t know why”?
1
121
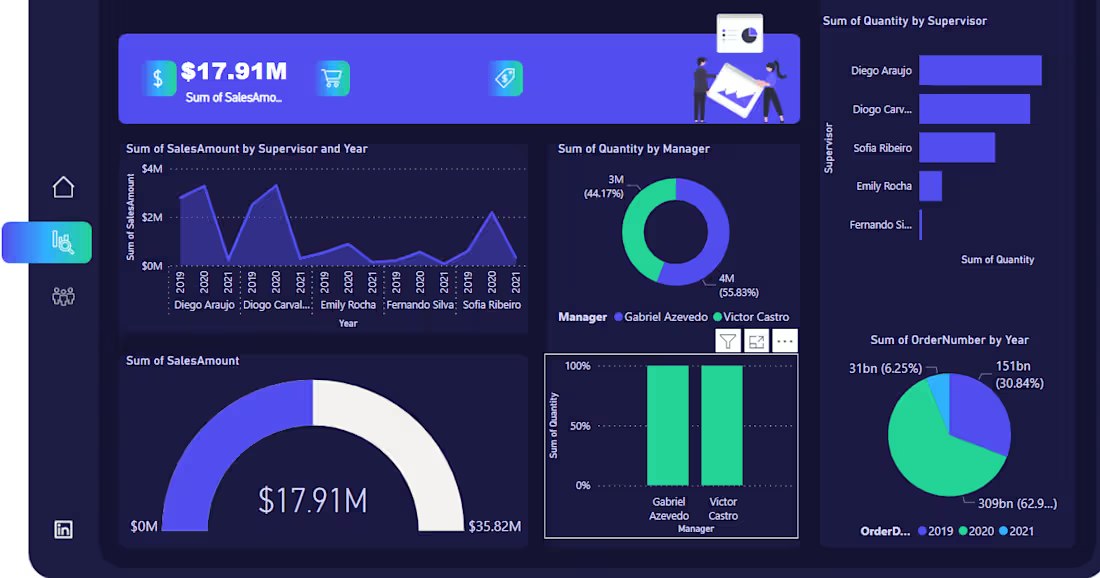
I recently built an interactive Power BI sales dashboard tracking $17.91M in total sales across supervisors, managers, and order years.
I then designed the data model and DAX measures behind the KPI cards, gauge, and trend visuals, and built drill-down views: sales by supervisor and year, quantity split by manager, and order volume by year.
I used combo visuals (donut, gauge, bar, and line charts) on one page so stakeholders can get the full picture without switching reports.
I also focused on a clean, single-screen layout that non-technical stakeholders can read at a glance.
#Microsoft Power BI #Daxko Operations #Data Visualization #Data Modeling #Business Intelligence
0
68
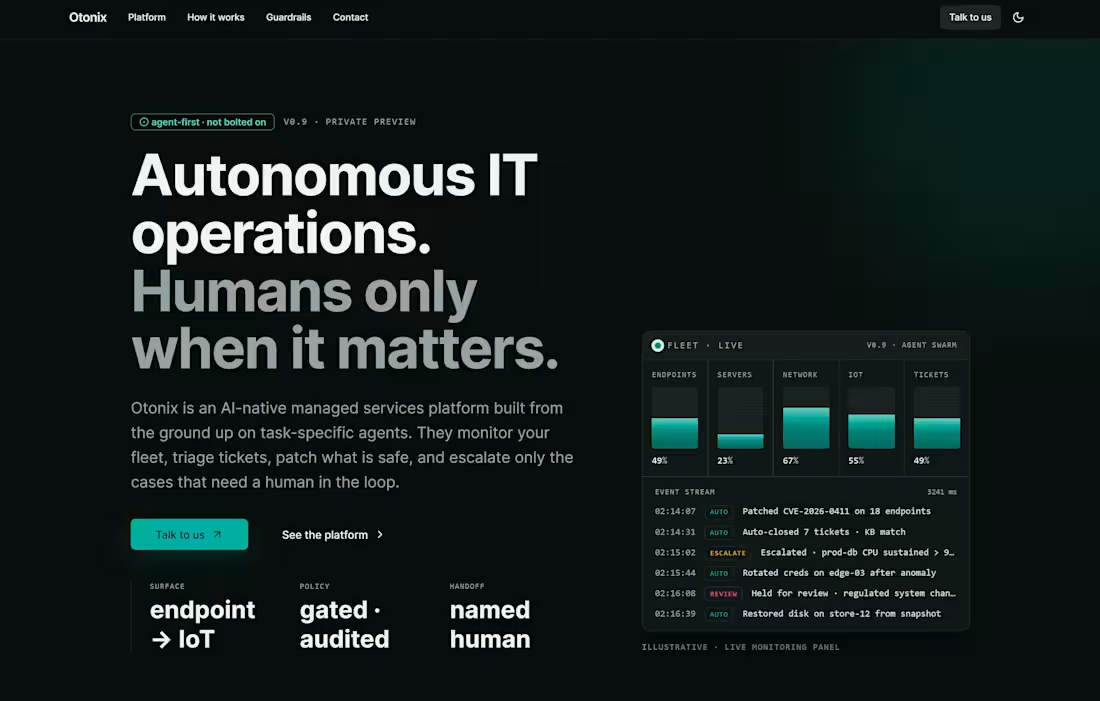
Building the technical foundation for Otonix, an AI-native IT Operations Platform
I worked on the engineering side of Otonix, an autonomous IT operations platform built on agent-first, task-specific AI agents that monitor, triage, remediate, and escalate IT operations, instead of a chatbot bolted onto legacy RMM/PSA tooling.
What the build involved:
🔹 Architecting the platform around four core agent capabilities: Monitor, Triage, Remediate, and Escalate.
🔹 Building the policy-guardrail layer that constrains automated actions and gates anything touching regulated systems or irreversible changes.
🔹 Implementing the audit trail: a signed, searchable, exportable log of every agent decision and action.
🔹 Working with a signal-ingestion pipeline (endpoints, servers, network, IoT) feeding into the triage/remediation flow.
Python/FastAPI, Node.js, React, PostgreSQL, Docker, n8n, Kubernetes
I build backend systems and full-stack platforms for technical products. Especially where reliability, auditability, and guardrails matter as much as the automation itself. If you're building something in a similar space, let's talk.
📩 mosesmorrisdev@gmail.com | github.com/Moses-Morris
1
101

This is a web design project for an Institution.
0
67