


569 real patients. 30 tumor measurements. Two outcomes.
I wanted to know what cancer actually looks like in data.
The answer is brutal.
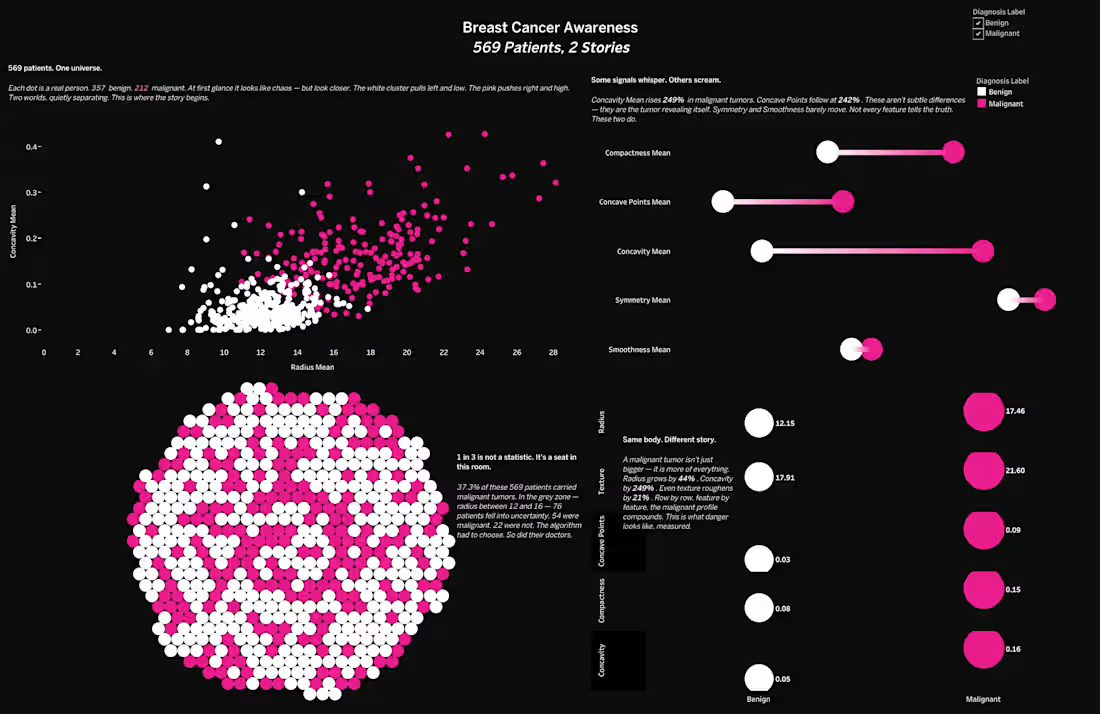
Concavity rises 249% in malignant tumors. Concave Points by 242%. The tumor doesn't hide. The data screams. Most people just aren't looking at the right signals.
So I built a Tableau story that makes it impossible to miss.
A scatter plot separating 357 benign from 212 malignant patients in one view. A lollipop chart showing exactly which features predict danger. Bubble cells that look like tumors under a microscope. And a dot matrix where every single dot is a real human being.
357 white. 212 pink.
https://lnkd.in/dZs-ydsK
(https://lnkd.in/dZs-ydsK)Every dot is a real person.
1
2
155
From reactive billing to predictive revenue intelligence in US Healthcare Revenue Cycle Management.
Built an end-to-end denial prediction model using XGBoost, integrated with Excel, and deployed in Power BI to surface high-risk claims before submission.
Predicts the likelihood of denial at the claim level
Helps billing teams prioritize and prevent revenue loss
Translates complex ML output into actionable insights.
Turning raw data into proactive revenue protection, not just reporting.
0
76
569 real patients. 30 tumor measurements. Two outcomes.
I wanted to know what cancer actually looks like in data.
The answer is brutal.
Concavity rises 249% in malignant tumors. Concave Points by 242%. The tumor doesn't hide. The data screams. Most people just aren't looking at the right signals.
So I built a Tableau story that makes it impossible to miss.
A scatter plot separating 357 benign from 212 malignant patients in one view. A lollipop chart showing exactly which features predict danger. Bubble cells that look like tumors under a microscope. And a dot matrix where every single dot is a real human being.
357 white. 212 pink.
https://lnkd.in/dZs-ydsK
(https://lnkd.in/dZs-ydsK)Every dot is a real person.
0
93
I build automated Power BI intelligence systems that give your business a brain.
Not just dashboards. Not just charts. Systems that connect to your data, track what matters, surface problems before they become expensive, and tell your team exactly what to do next.
Whether you need financial intelligence, revenue analytics, operational reporting, or executive dashboards — I build Power BI solutions that are clean, scalable, and actually used by the people they are built for.
I include documented DAX measures, dynamic filtering, automated alerts (if needed), and a system your team can operate without relying on a developer whenever something changes.
If you have data and need decisions — let's talk.
1
177