The network for creativity
Join 1.25M professional creatives like you
Connect with clients, get discovered, and run your business 100% commission-free
Creatives on Contra have earned over $150M and we are just getting started
Back to feedPost
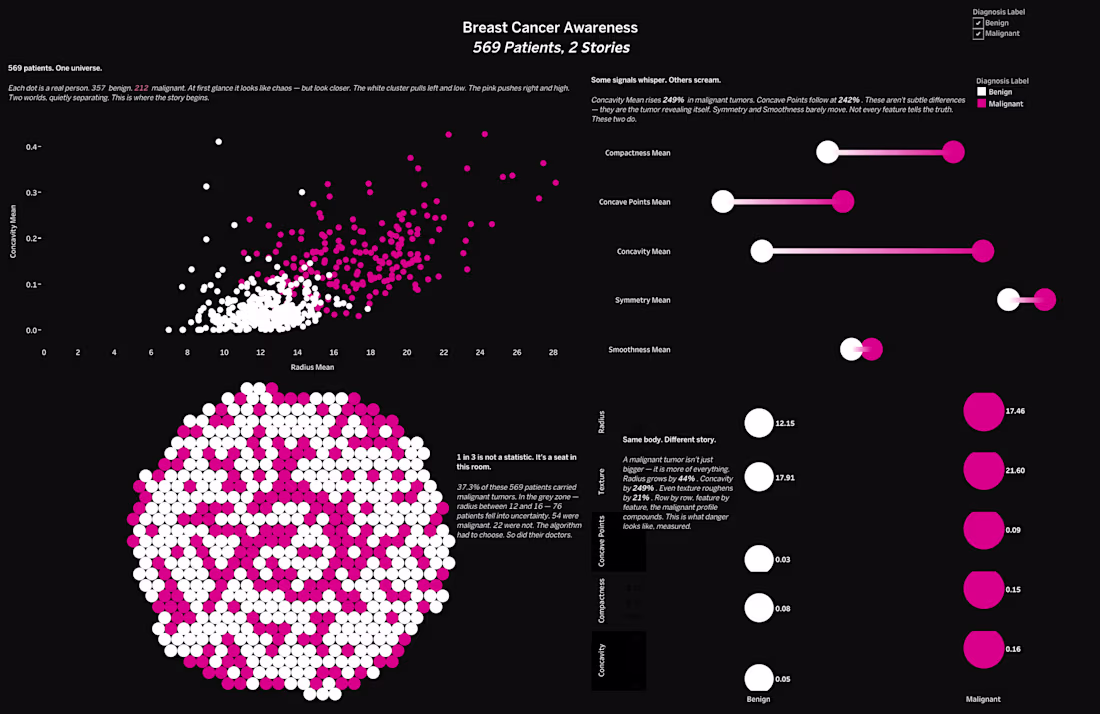
569 real patients. 30 tumor measurements. Two outcomes.
I wanted to know what cancer actually looks like in data.
The answer is brutal.
Concavity rises 249% in malignant tumors. Concave Points by 242%. The tumor doesn't hide. The data screams. Most people just aren't looking at the right signals.
So I built a Tableau story that makes it impossible to miss.
A scatter plot separating 357 benign from 212 malignant patients in one view. A lollipop chart showing exactly which features predict danger. Bubble cells that look like tumors under a microscope. And a dot matrix where every single dot is a real human being.
357 white. 212 pink.
https://lnkd.in/dZs-ydsK
Every dot is a real person.
The network for creativity
Join 1.25M professional creatives like you
Connect with clients, get discovered, and run your business 100% commission-free
Creatives on Contra have earned over $150M and we are just getting started
Trending
Claude
Claude has entered the design space. How are you using it?
Contra University
Learn from expert creatives how to earn more using next-gen AI tools.
Brand Design
The best brand designers are on Contra. Scroll to see what's trending in brand design. What are you building?
creativeaiflow
Creative AI workflows are evolving. What tools do you use, and what are their strengths and weaknesses?
freelancerlife
Freelancer life is wins, pivots, and everything in between. What’s yours right now?
Related posts
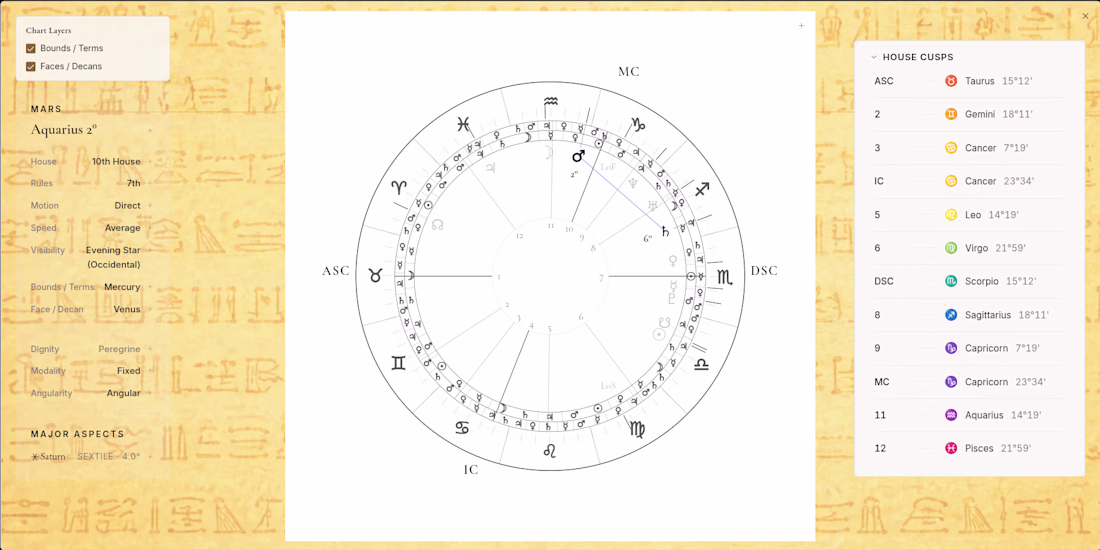
Apotelesma is a professional workspace for chart analysis, built entirely solo — from a real astronomical calculation engine to a fully custom, interactive UI. It connects multiple analytical techniques into one continuous workflow instead of treating them as separate, disconnected tools, with live data panels, saved states, and a system for organizing findings per client. Architected, designed, and shipped end to end. Live at apotelesma.org.
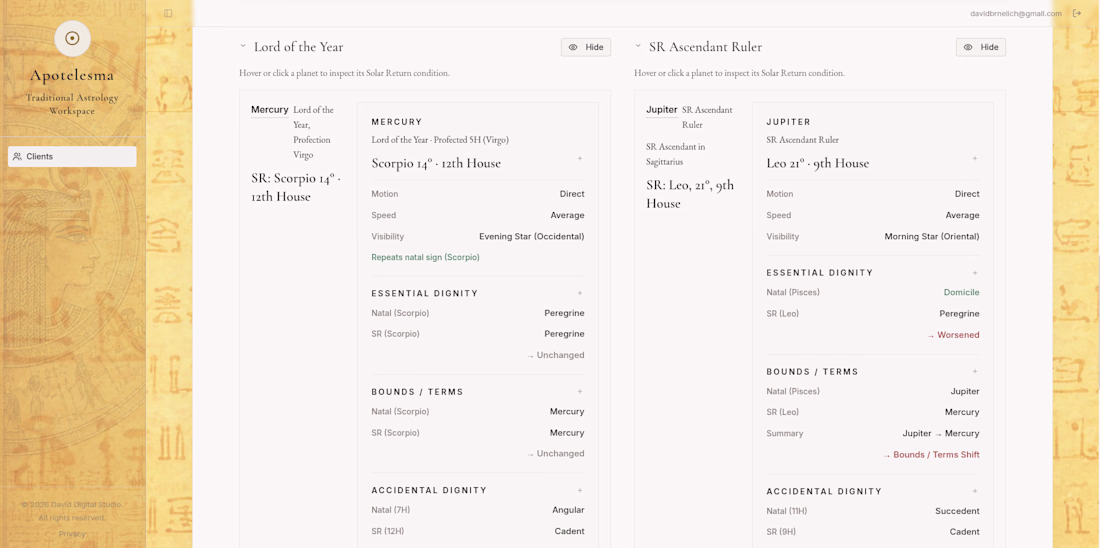

Impressive work! Building the calculation engine, interactive UI, and end-to-end workflow as a solo project is a significant achievement. I especially like the focus on bringing multiple analytical techniques together into one cohesive workspace instead of treating them as isolated tools
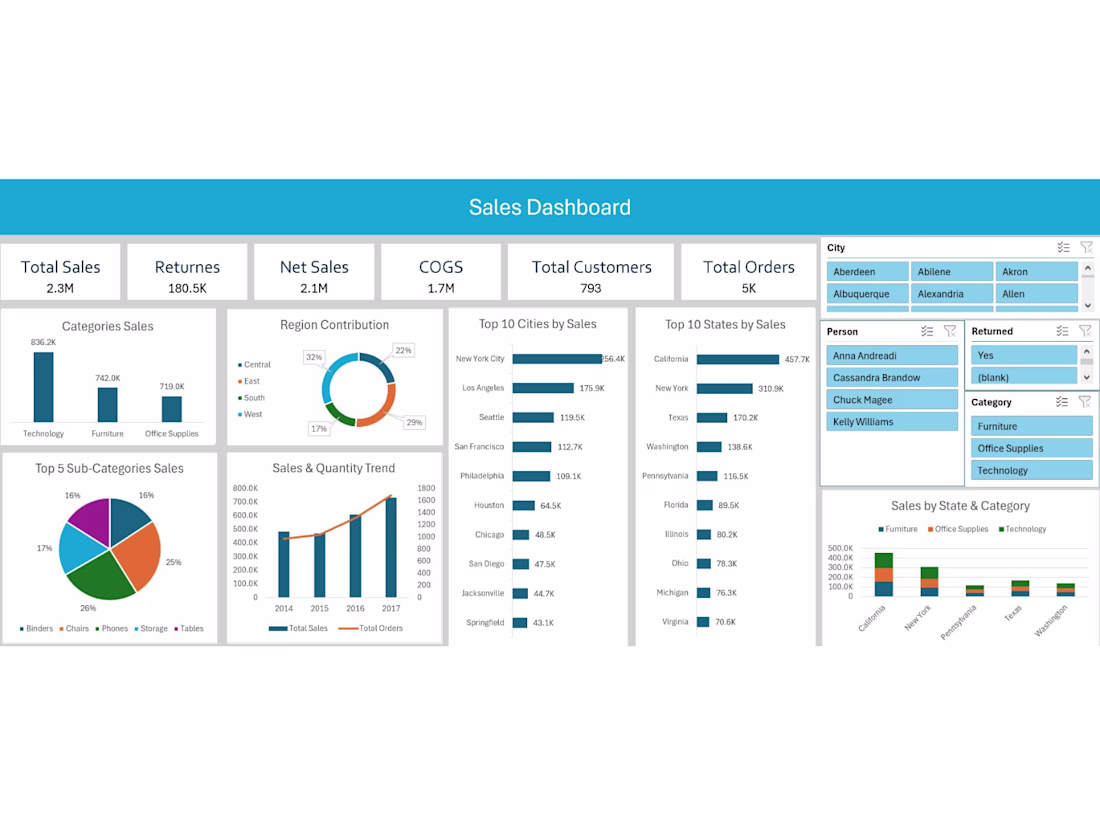
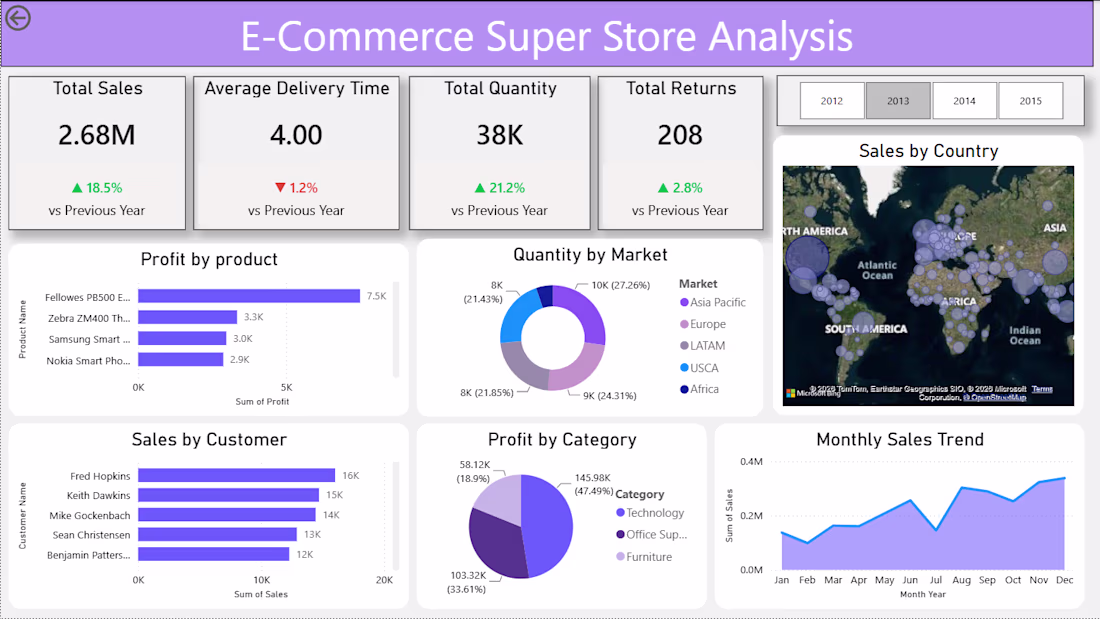
E-Commerce Super Store Sales Dashboard
Developed an interactive Power BI dashboard to analyze sales performance, profitability, customer trends, and operational KPIs for an e-commerce business. The dashboard provides decision-makers with real-time insights into sales growth, product performance, returns, and regional trends through dynamic and visually engaging reports.
Key Highlights
Designed an executive-style dashboard with an intuitive user experience
Built dynamic KPIs using DAX for Sales, Quantity, Returns, and Delivery Performance
Cleaned and transformed data using Power Query
Created an optimized data model for accurate and efficient reporting
Implemented interactive filters, cross-filtering, and time-based analysis
Visualized sales by country, product, category, customer, market, and monthly trends.
Skills Used
Power BI • DAX • Power Query • Data Modeling • ETL • Sales Analytics • KPI Development • Data Visualization • Business Intelligence
📊 Excel Sales Dashboard
An interactive Excel dashboard that transforms raw sales data into meaningful business insights through KPI tracking, dynamic filtering, and intuitive visualizations. Built using PivotTables, Pivot Charts, and Slicers to support effective sales analysis and decision-making.