
Marvellous Olaonipekun
Excel & Data Entry Specialist | Clean data, clear reports
New to Contra
Marvellous is building their profile!

TITLE: Back-to-School Shopping - Price Comparison & Budget Analysis
PROJECT TYPE: Personal/Practice project
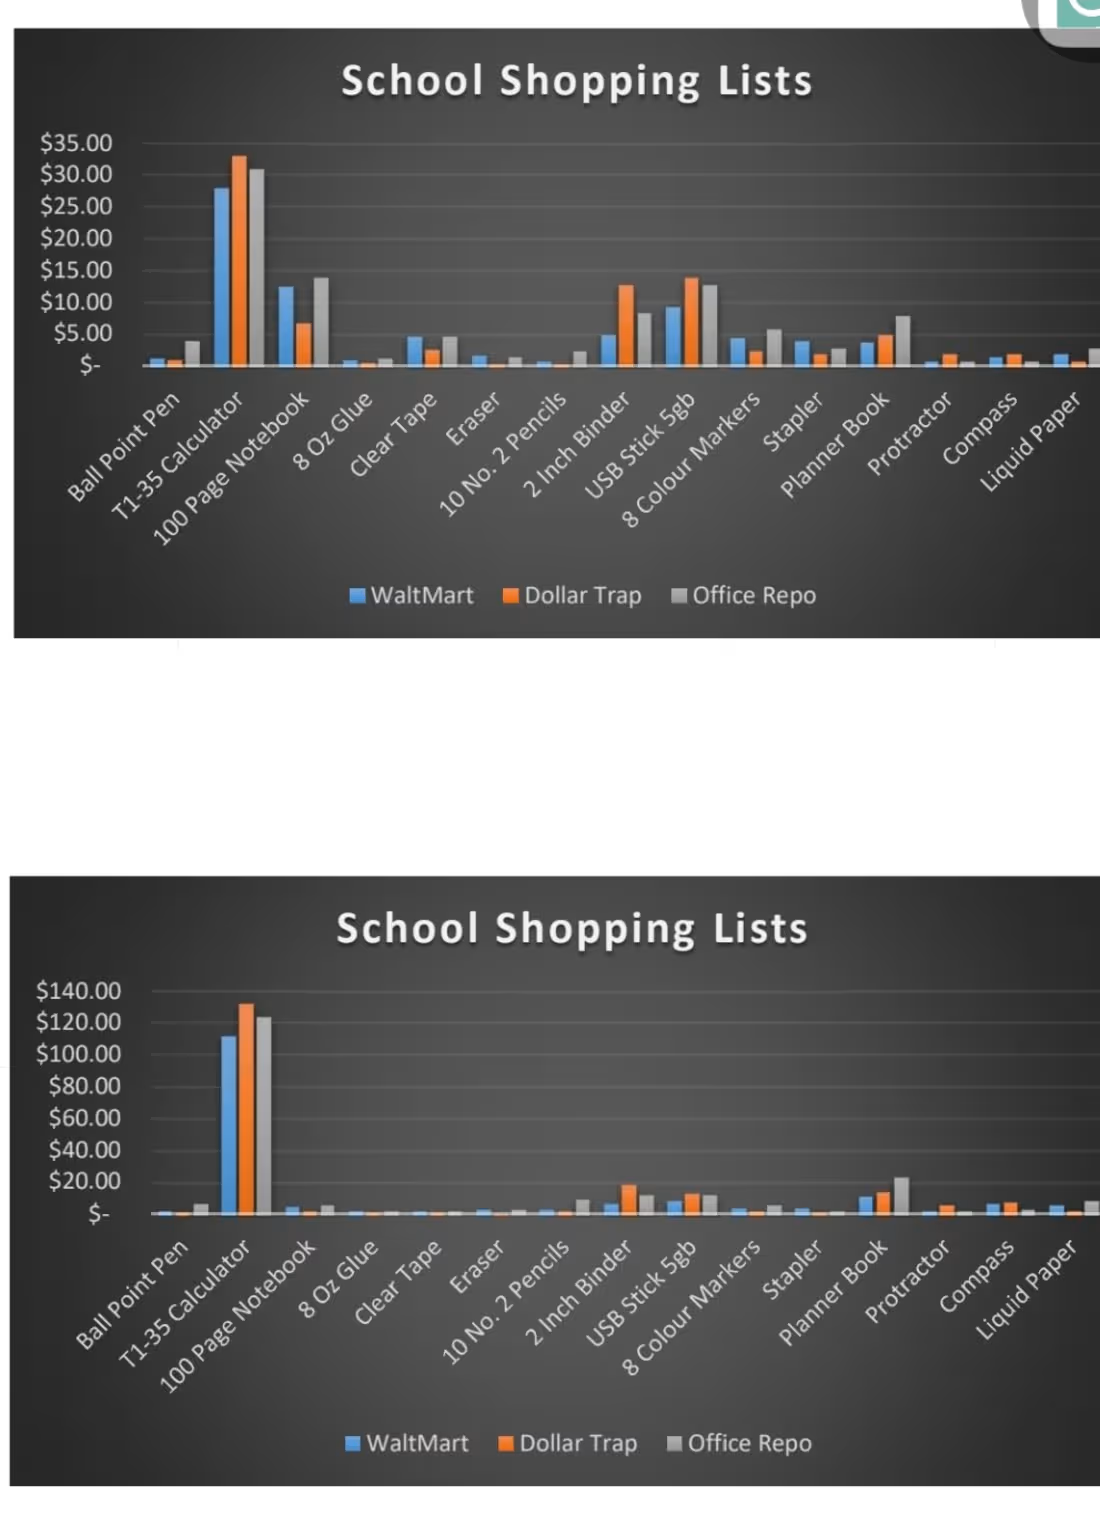
DESCRIPTION: I analyzed a back-to-school shopping scenario for Tim and Susan by comparing the prices of school supplies across three stores. The analysis calculated item-level and total shopping costs to identify cost differences and potential savings.
WHAT I DID:
• Created separate shopping lists based on each shopper's requirements.
• Organized prices for 15 school-supply items across three stores.
• Calculated item costs using Unit Price × Quantity.
• Used SUM to calculate total shopping costs.
• Compared individual item prices across stores.
• Created charts for unit-price and total-cost comparisons.
KEY FINDINGS:
Based on the prices and quantities in the dataset, WaltMart had the lowest total shopping cost for both shoppers. Susan's estimated total was $82.79, while Tim's was $185.71. The analysis showed potential savings of $20.50 for Susan and $45.15 for Tim compared with the highest-cost store.
RESULT:
The completed Excel model provided a clear comparison of school-supply prices and total shopping costs, helping identify lower-cost purchasing options and potential saving.
TOOLS USED: Microsoft Excel, SUM, Price Comparison, Cost Calculation, Bar Charts, Budget Analysis and Data Comparison.
0
17
TITLE: Printer ROI Analysis - Cost vs. Profit for 2 Years
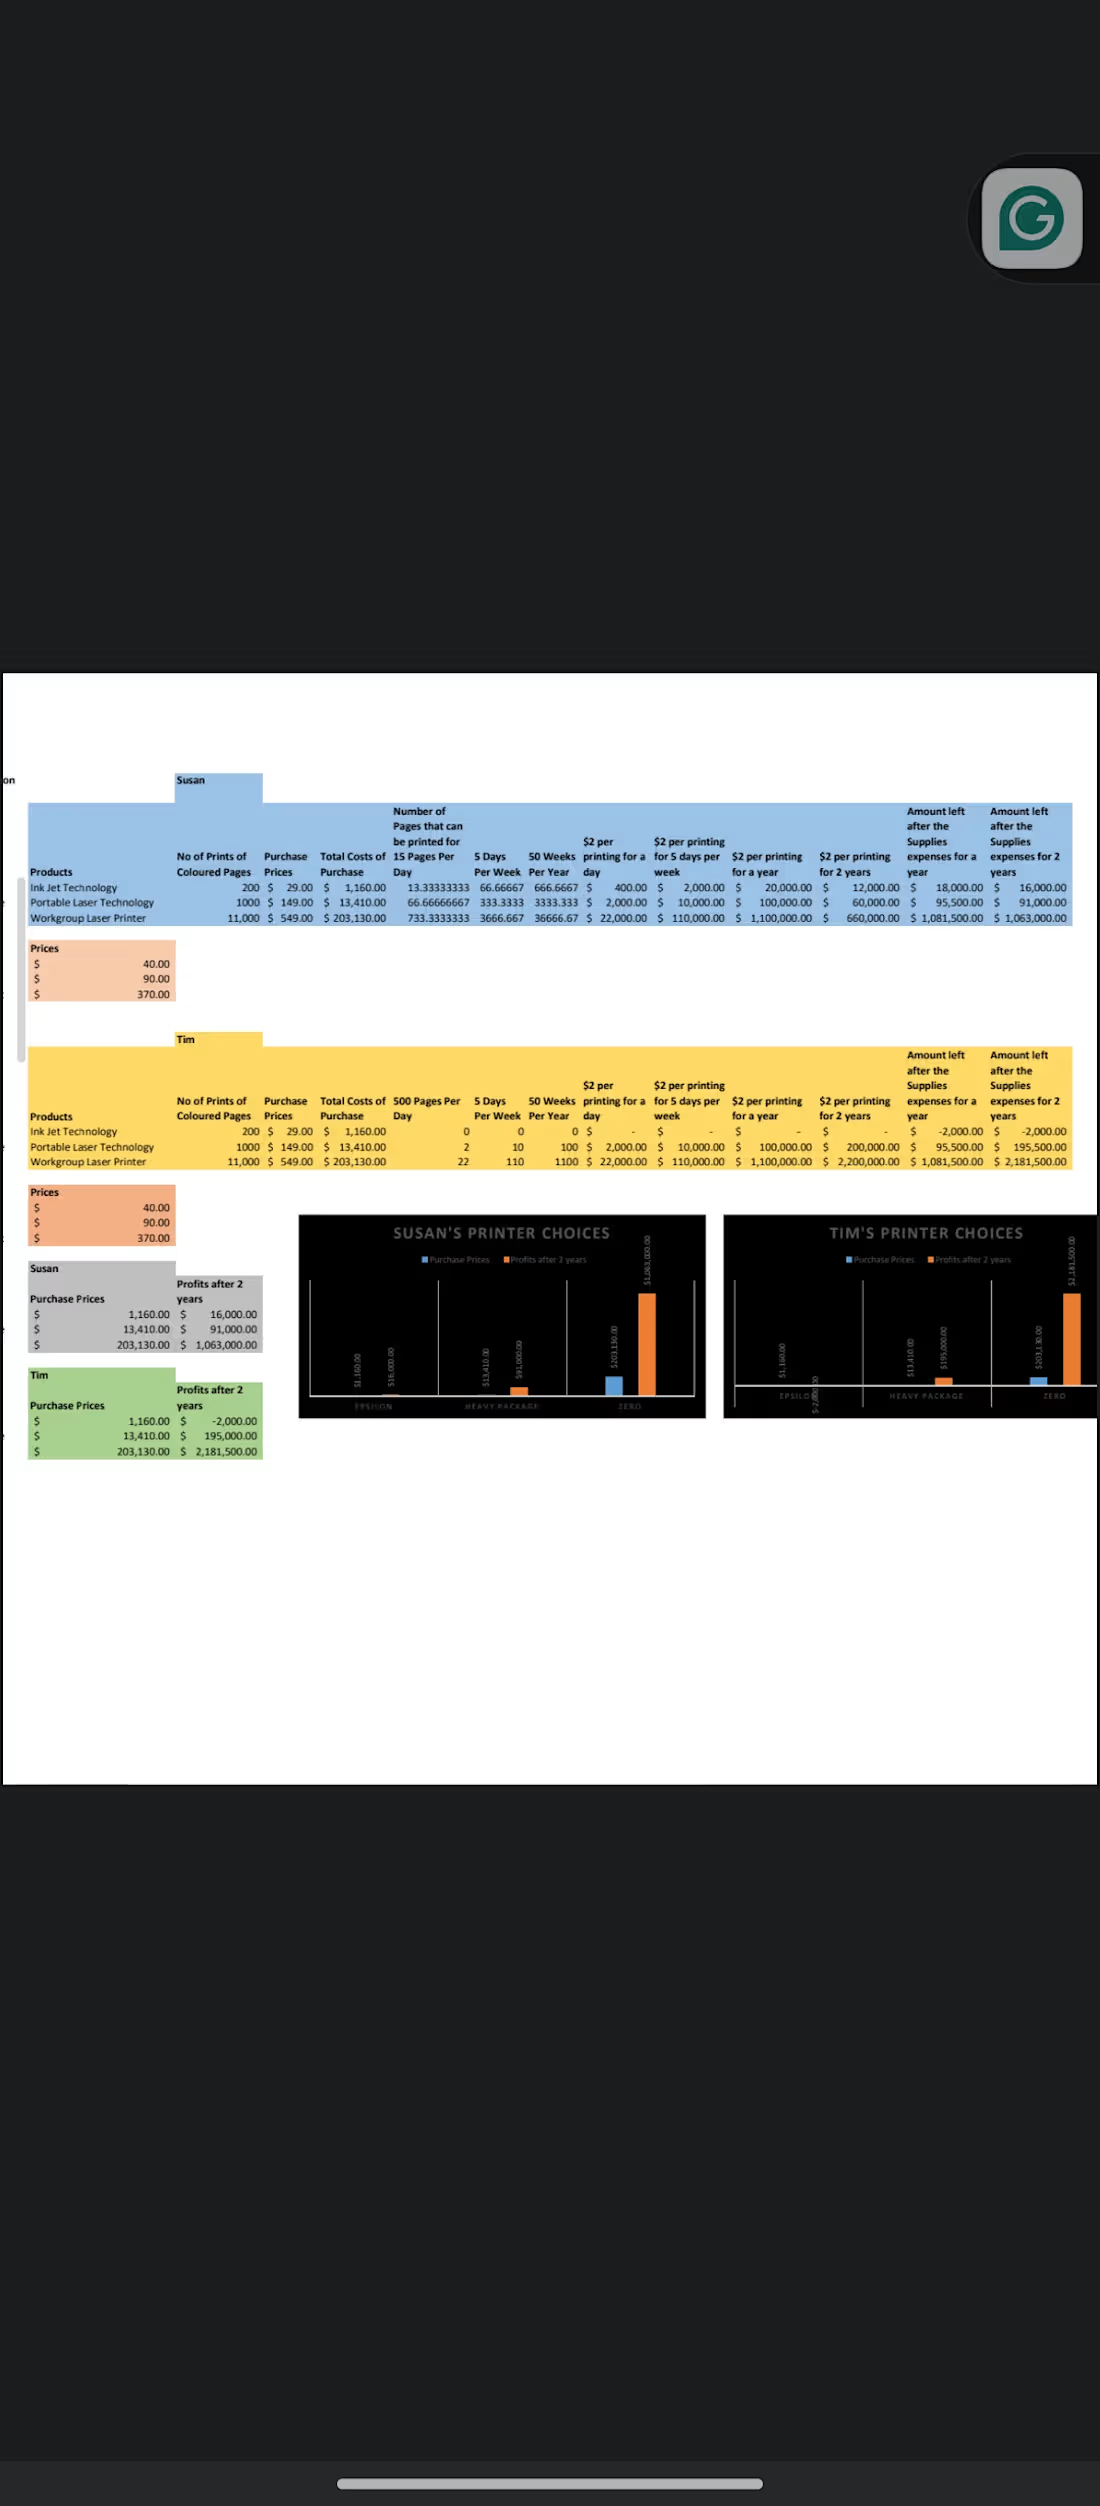
DESCRIPTION: I analyzed a two-year printer investment scenario for two users with the different daily printing requirements. The analysis compared three printer options based on purchase cost, supply cost, printing capacity, projected revenue and estimated two-year profit.
WHAT I DID:
• Organized printer specifications, capacity and cost data.
• Calculated estimated daily, annual and two-year printing volumes.
• Calculated total printer and supply costs.
• Projected revenue using the assumed $2-per-page rate.
• Calculated estimated two-year profit for each printer and user.
• Created charts to compare projected profitability.
• Applied cost-benefit and ROI analysis to evaluate the options.
KEY FINDINGS:
Under the assumptions used in the model, the Zero printer produced the highest projected two-year profit for both users, while the results varied considerably based on daily printing volume and printer costs.
RESULT:
The completed Excel model provided a structured comparison of printer costs, projected revenue and profitability, making it easier to evaluate the options under the scenario's assumptions.
TOOLS USED: Microsoft Excel, ROI Modeling, Cost-Benefit Analysis, Profit Calculation, Bar Charts and Business Case Analysis.
0
26
TITLE: Pet Ownership Cost Analysis - Dog vs. Cat Comparison
PROJECT TYPE: Personal/Practice Project
DESCRIPTION: I analyzed a pet ownership scenario in which a couple was comparing the estimated one-year costs of owning a dog versus a cat. The analysis compared initial setup expenses and recurring monthly costs to provide a clear view of the total annual cost of each option.
WHAT I DID:
• Organized initial and recurring pet ownership cost: Purchase, Collar, Tag, Bowl and Leash.
• Calculated monthly expenses using Excel formulas.
• Calculated estimated one-year ownership costs.
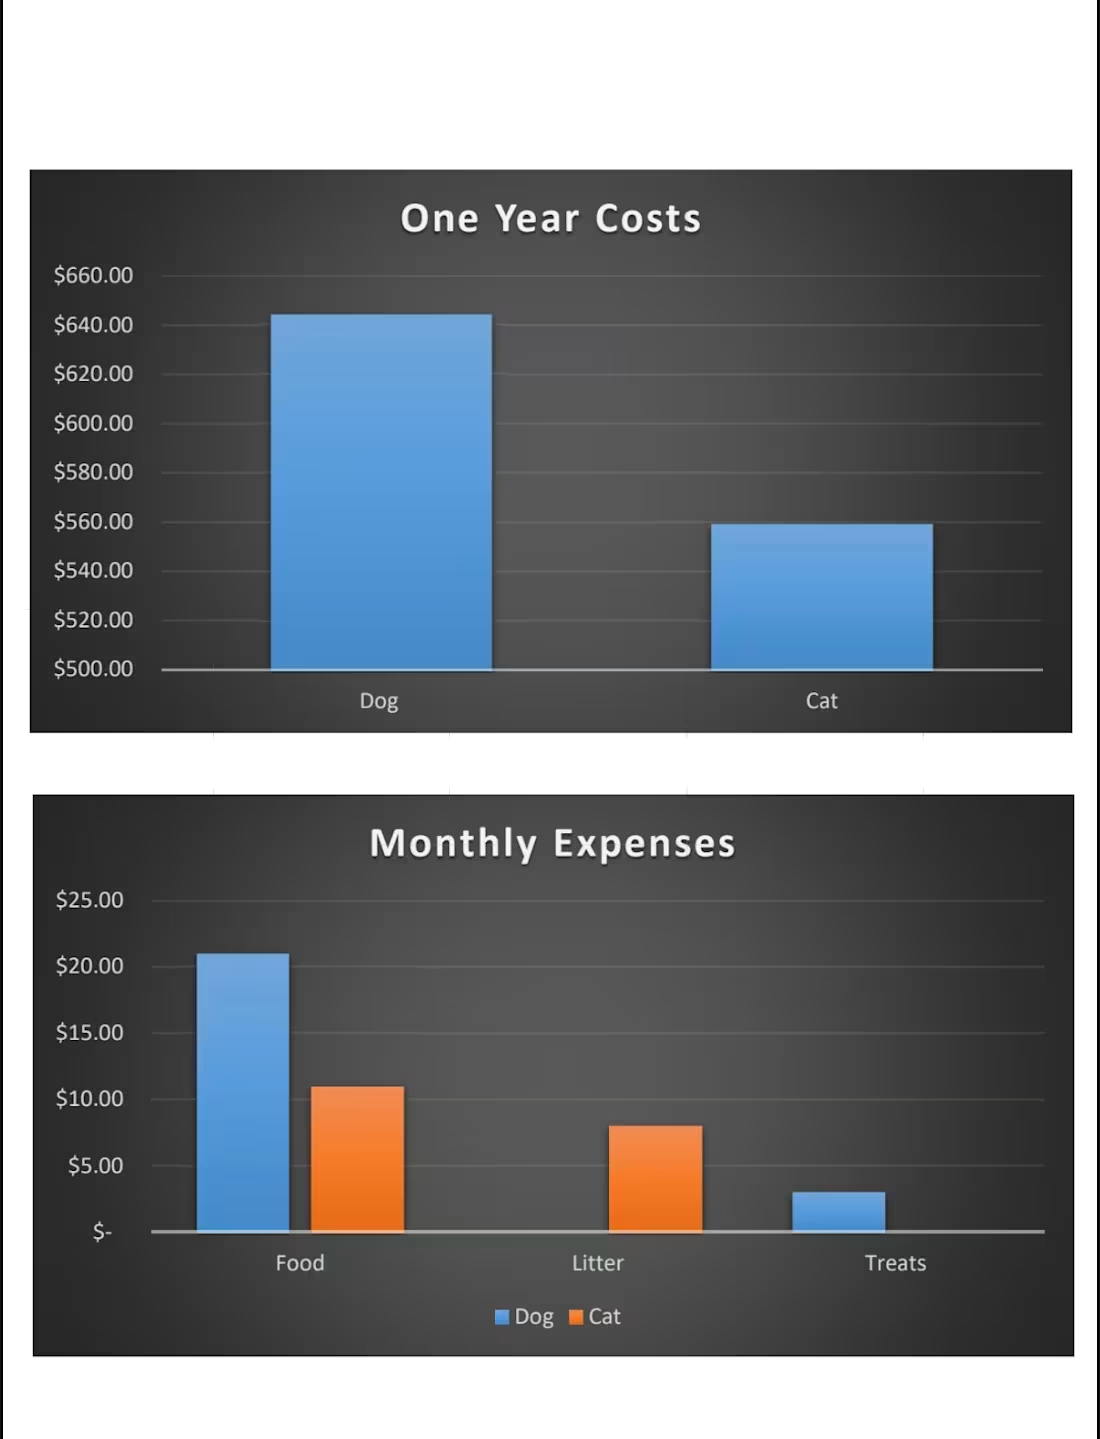
• Created a dashboard showing monthly expenses by category.
• Created a second dashboard comparing one-year total costs.
• Used charts to visualize the difference between the two options.
KEY INSIGHT DELIVERED:
Based on the assumption in the dataset, the estimated annual cost was $559.50 for the cat and $644 for the dog, a difference of $84.50.
RESULT:
The completed Excel model provided a clear breakdown of initial, monthly and annual costs, making it easier to compare the two pet ownership scenarios.
TOOLS USED: Microsoft Excel, SUM, Cost Modeling, Bar Charts and Comparative Analysis
0
26
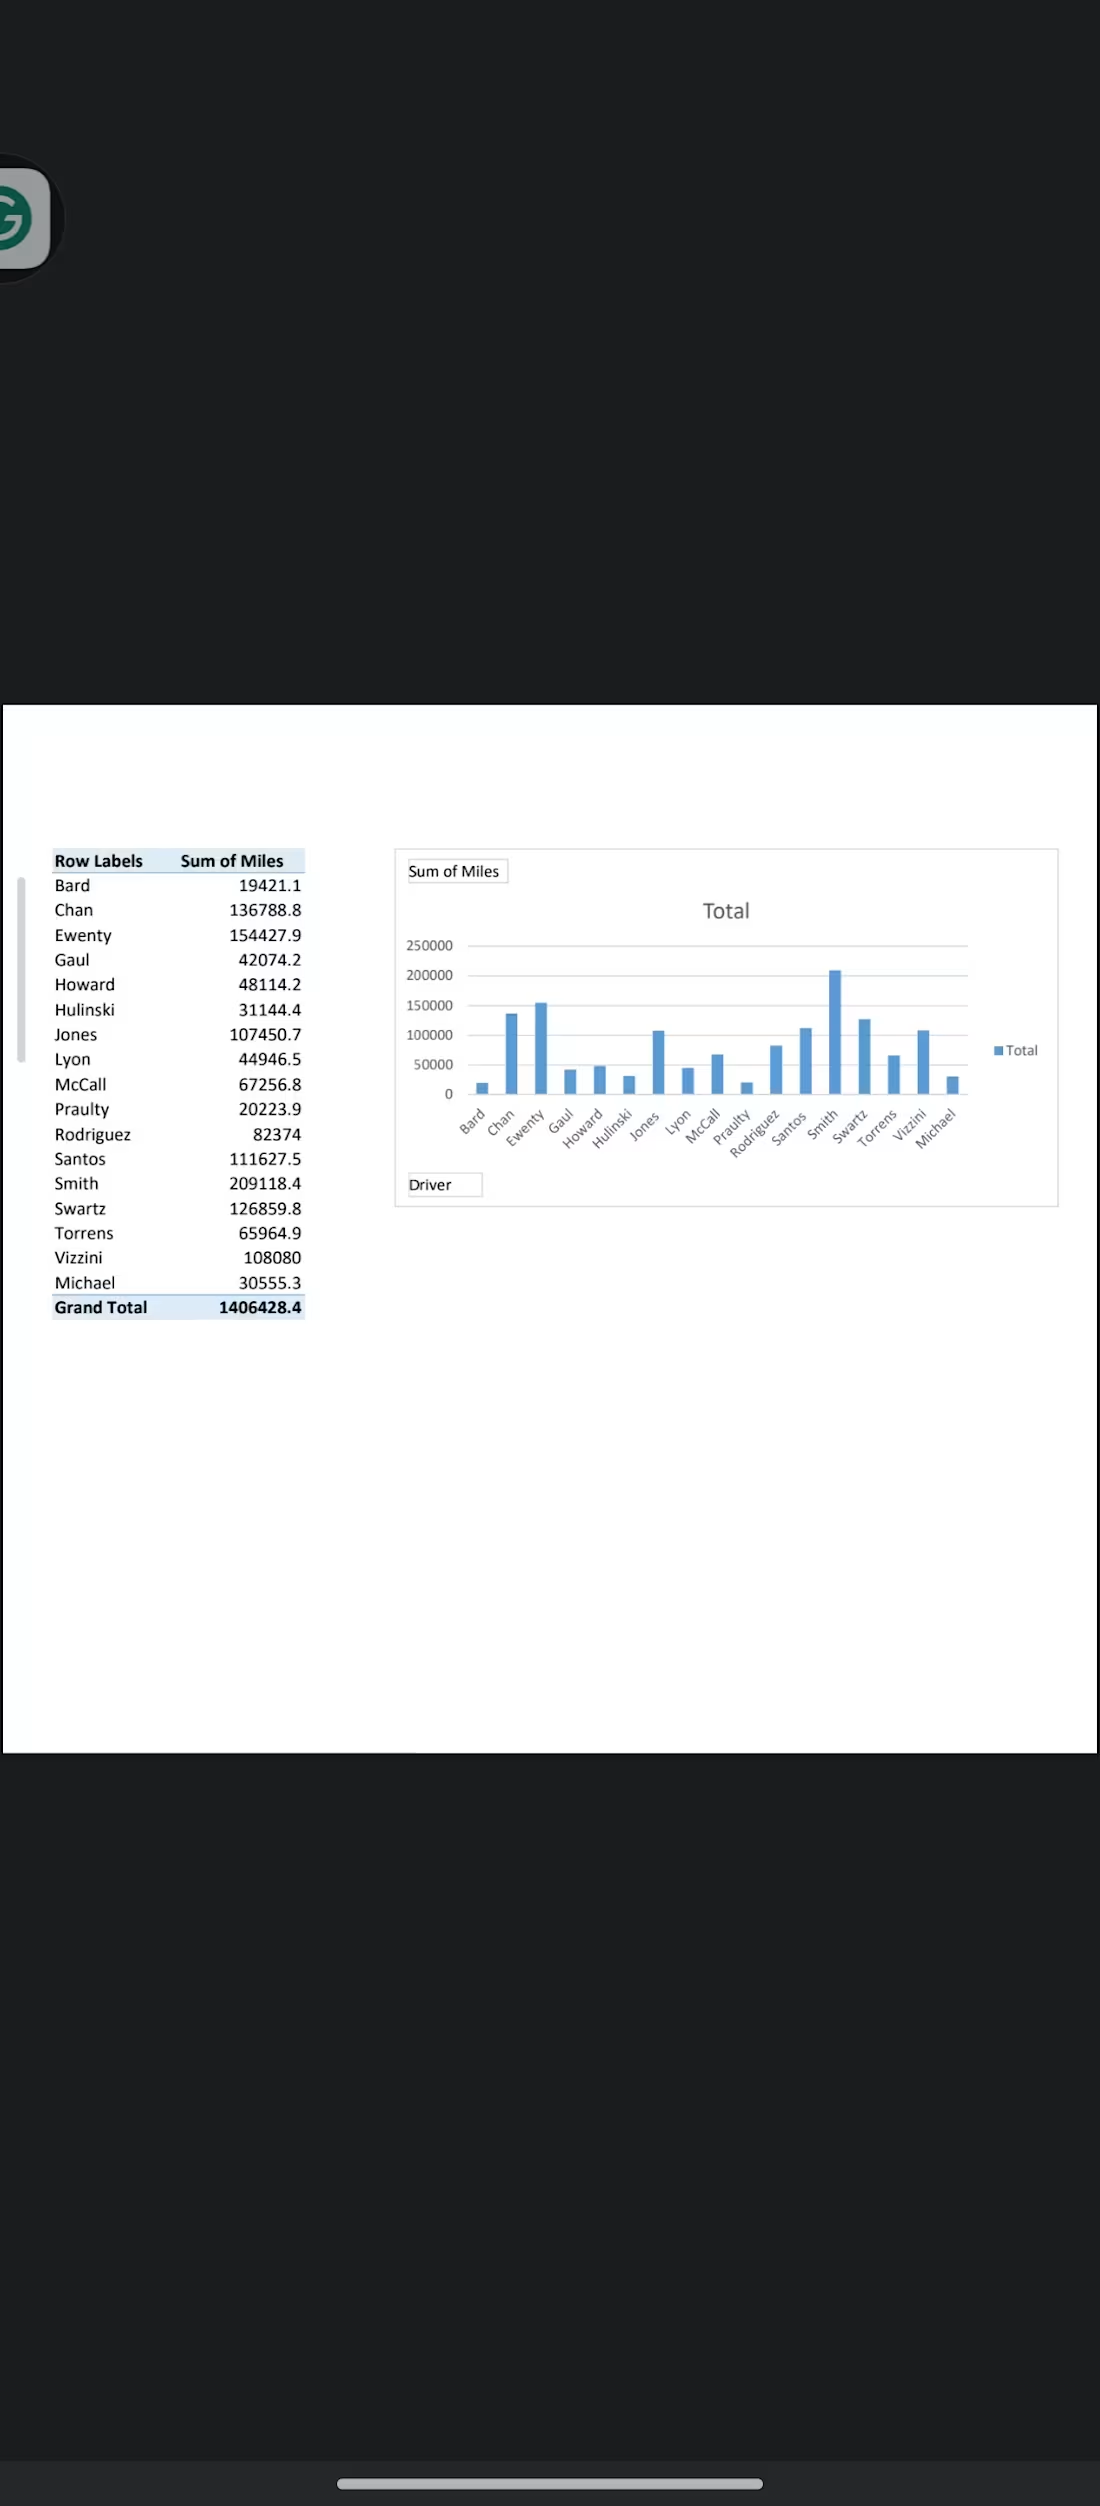
TITLE: Car Fleet Mileage Analysis - PivotTable & Excel Dashboard
PROJECT TYPE: Personal/Practice Project
DESCRIPTION/PROBLEM: I worked with a car inventory dataset containing vehicle and driver mileage records. The goal was to organize, clean and analyze the data using Microsoft Excel and create a clear dashboard for comparing driver mileage and supporting fleet-related decisions.
WHAT I DID:
Cleaned and Standardized car manufacturer names using VLOOKUP and IF.
Created a PivotTable to summarize total mileage by driver.
Used SUM to calculate the overall mileage of 1,406,428.4 miles.
Created a bar chart to compare driver mileage visually.
Used LEFT, MID and RIGHT to extract information from car IDs.
Used CONCATENATE to generate standardized car IDs (e.g., FD06MTGBLA001).
Applied Conditional Formatting and professional table formatting for easier interpretation.
RESULT: The completed Excel dashboard made the mileage data easier to understand and provided a quick visual comparison of driver activity.
TOOLS USED: Microsoft Excel, PivotTables, SUM, Charts, Conditional Formatting, VLOOKUP, IF, LEFT, RIGHT, MID and CONCATENATE
0
72