The network for creativity
Join 1.25M professional creatives like you
Connect with clients, get discovered, and run your business 100% commission-free
Creatives on Contra have earned over $150M and we are just getting started
Back to feedPost

TITLE: Car Fleet Mileage Analysis - PivotTable & Excel Dashboard
PROJECT TYPE: Personal/Practice Project
DESCRIPTION/PROBLEM: I worked with a car inventory dataset containing vehicle and driver mileage records. The goal was to organize, clean and analyze the data using Microsoft Excel and create a clear dashboard for comparing driver mileage and supporting fleet-related decisions.
WHAT I DID:
Cleaned and Standardized car manufacturer names using VLOOKUP and IF.
Created a PivotTable to summarize total mileage by driver.
Used SUM to calculate the overall mileage of 1,406,428.4 miles.
Created a bar chart to compare driver mileage visually.
Used LEFT, MID and RIGHT to extract information from car IDs.
Used CONCATENATE to generate standardized car IDs (e.g., FD06MTGBLA001).
Applied Conditional Formatting and professional table formatting for easier interpretation.
RESULT: The completed Excel dashboard made the mileage data easier to understand and provided a quick visual comparison of driver activity.
TOOLS USED: Microsoft Excel, PivotTables, SUM, Charts, Conditional Formatting, VLOOKUP, IF, LEFT, RIGHT, MID and CONCATENATE




The network for creativity
Join 1.25M professional creatives like you
Connect with clients, get discovered, and run your business 100% commission-free
Creatives on Contra have earned over $150M and we are just getting started





Related posts


Food Restaurant SaaS Dashboard
A SaaS dashboard concept designed for restaurant businesses to manage and understand their day-to-day operations.
The interface brings key business information into a structured workspace, with clear sections for performance, orders, sales and operational data.
The design approach focuses on hierarchy first — helping users find important information quickly without overwhelming them with unnecessary detail.
Design focus:
• SaaS Dashboard Design
• Restaurant Management UX
• Data Visualization
• Business Analytics
• UI/UX Design
• Product Design
Designed by WaxyWeb.


great

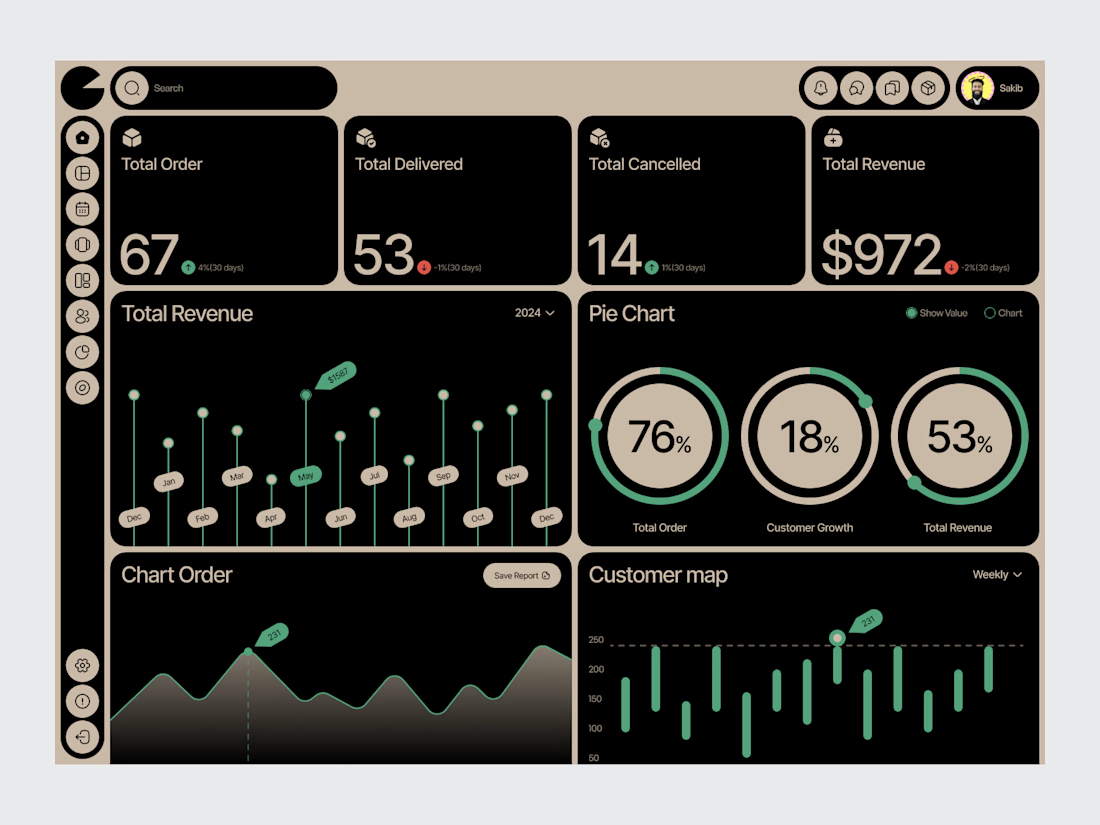
Renewable energy production changes constantly, and grid operators need faster ways to understand what is happening across load, generation, storage, and market conditions.
Gridora explores a SaaS dashboard experience built for energy forecasting and balancing.
The dashboard surfaces forecasted peak load, curtailment risk, available storage, spot market price, generation sources, and recommended next actions in one clear workspace.
Natural imagery, soft neutral surfaces, and green accents connect the interface to the renewable energy context while keeping the product practical and easy to scan.