
jyoti soni
i am data analyst for 3 month intern
- 2
- Followers



🏦 I built an interactive Bank Loan Report Dashboard entirely in Excel!
Is your loan data sitting in raw spreadsheets, making it hard to see which loans are performing and which are risky? I turned it into a clean, interactive dashboard that gives answers in seconds.
Key insights the dashboard reveals:
✅ Total loan applications, funded amount, and amount received at a glance
✅ Good loans vs bad loans (e.g. 86.18% good vs 13.82% bad overall)
✅ Average interest rate and DTI (Debt-to-Income) ratio tracking
✅ Month-to-Date (MTD) and Month-over-Month (MoM) performance
✅ Loan applications by month, state, term, employment length, purpose, and home ownership
✅ Loan status breakdown: Fully Paid, Current, and Charged Off
Features:
🔹 Multi-page dashboard: Summary, Overview, and Details
🔹 Interactive slicers to filter by loan grade and purpose
🔹 Dynamic KPIs, charts, and a state-wise map
🔹 Professional design that’s ready to present to management
Tools used: Microsoft Excel, Pivot Tables, Slicers, Dashboard Design, Data Analysis
💼 Need a custom Excel dashboard for your business data? Let’s connect!
📩 DM me or comment “EXCEL” to get started!
#Excel #DataAnalytics #DashboardDesign #BankLoan #FinancialAnalytics #DataVisualization #Freelancer #DataAnalyst #OpenToWork
0
15
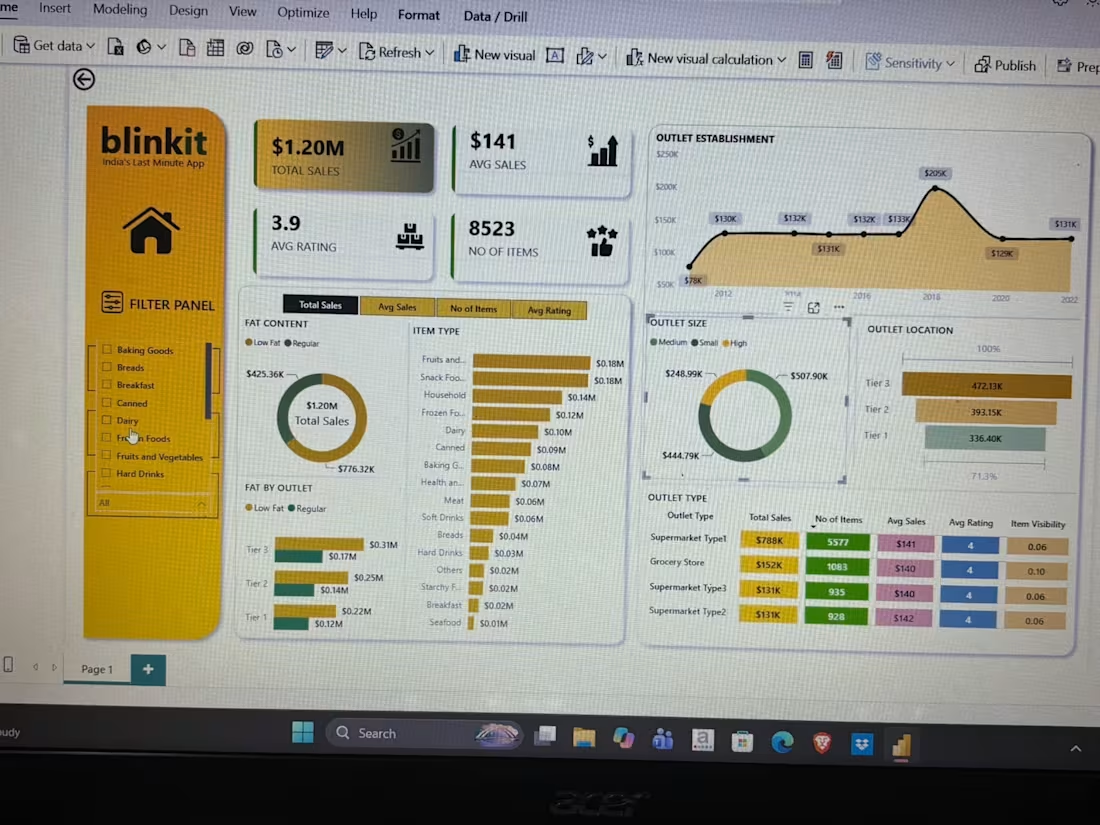
📊 I built an interactive Sales Dashboard for Blinkit using Power BI!
Is your business data buried in Excel sheets, leaving you unsure where your sales are really coming from? I turned Blinkit’s $1.2M sales data into a clean, interactive dashboard that answers those questions in seconds.
Key insights the dashboard reveals:
✅ Which item categories drive the most sales (Fruits & Vegetables and Snack Foods lead)
✅ Which city tier (Tier 1/2/3) generates the highest revenue
✅ Performance by outlet type, size, and establishment year
✅ Low Fat vs Regular items sales comparison
✅ Ratings, item visibility, and average sales, all in one place
Features:
🔹 Interactive filters to explore data category by category
🔹 One-click toggle between Total Sales, Avg Sales, No. of Items, and Avg Rating
🔹 Professional design that’s ready to present to management
Tools used: Power BI, DAX, Data Cleaning, Data Modeling
💼 Have data of your own? I can build a custom dashboard like this for your business.
📩 DM me or comment “DASHBOARD” to get started!
#PowerBI #DataAnalytics #DataVisualization #Freelancer #BusinessIntelligence #DataAnalyst #OpenToWork #Blinkit
0
31
this power bi dashboard for my linkedin profile
0
70

Hi , i am freelancer who can any do work in power BI, python, SQL, My SQL, Adv. Excel.
My contact
Phone no. 9990892967
Mail id : ramsoni212003@gmail.com
0
78