The network for creativity
Join 1.25M professional creatives like you
Connect with clients, get discovered, and run your business 100% commission-free
Creatives on Contra have earned over $150M and we are just getting started
Back to feedPost

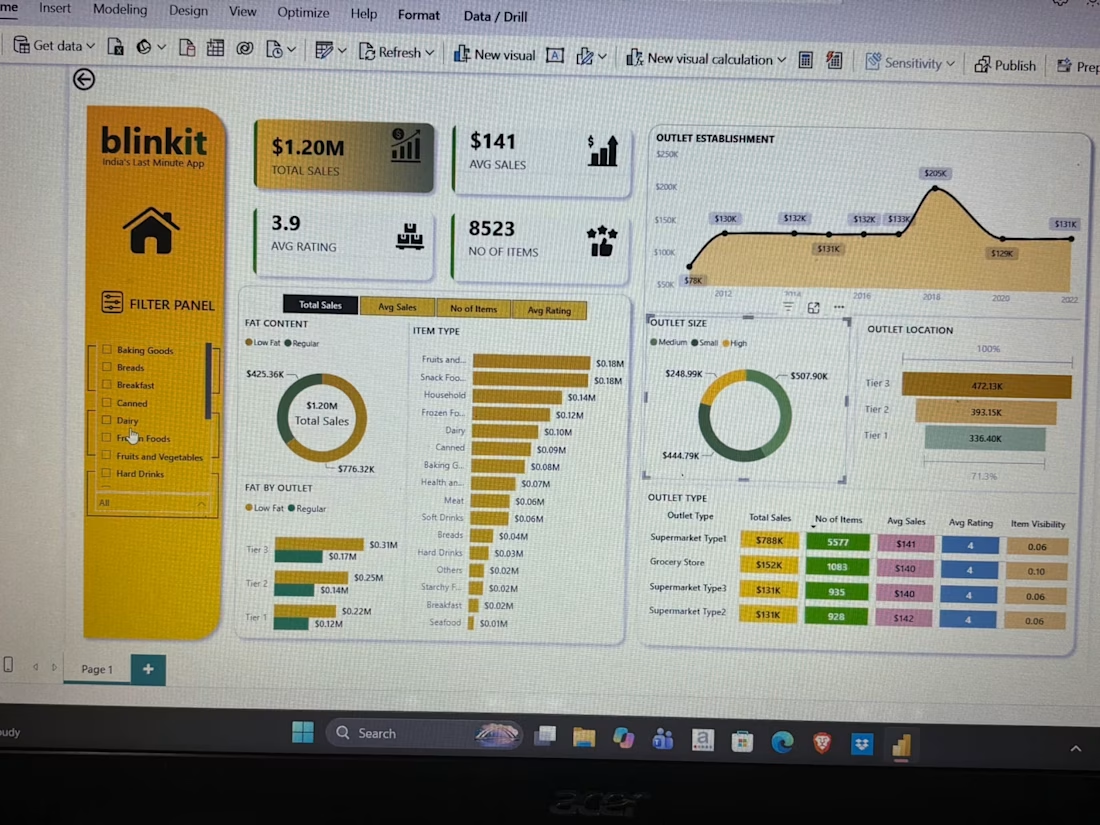
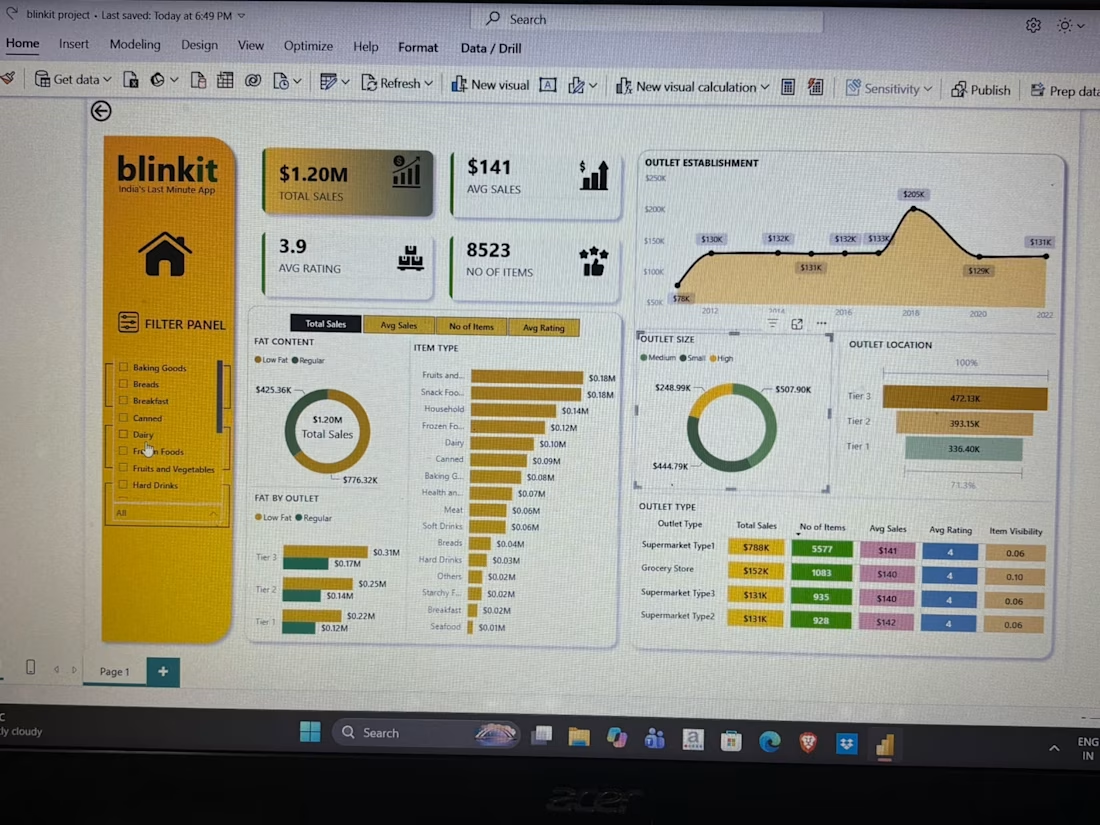
📊 I built an interactive Sales Dashboard for Blinkit using Power BI!
Is your business data buried in Excel sheets, leaving you unsure where your sales are really coming from? I turned Blinkit’s $1.2M sales data into a clean, interactive dashboard that answers those questions in seconds.
Key insights the dashboard reveals:
✅ Which item categories drive the most sales (Fruits & Vegetables and Snack Foods lead)
✅ Which city tier (Tier 1/2/3) generates the highest revenue
✅ Performance by outlet type, size, and establishment year
✅ Low Fat vs Regular items sales comparison
✅ Ratings, item visibility, and average sales, all in one place
Features:
🔹 Interactive filters to explore data category by category
🔹 One-click toggle between Total Sales, Avg Sales, No. of Items, and Avg Rating
🔹 Professional design that’s ready to present to management
Tools used: Power BI, DAX, Data Cleaning, Data Modeling
💼 Have data of your own? I can build a custom dashboard like this for your business.
📩 DM me or comment “DASHBOARD” to get started!
#PowerBI #DataAnalytics #DataVisualization #Freelancer #BusinessIntelligence #DataAnalyst #OpenToWork #Blinkit


The network for creativity
Join 1.25M professional creatives like you
Connect with clients, get discovered, and run your business 100% commission-free
Creatives on Contra have earned over $150M and we are just getting started



Related posts

Creator: Samin Sami (Samin Yasar Al Sami)
The Story Behind the Project:
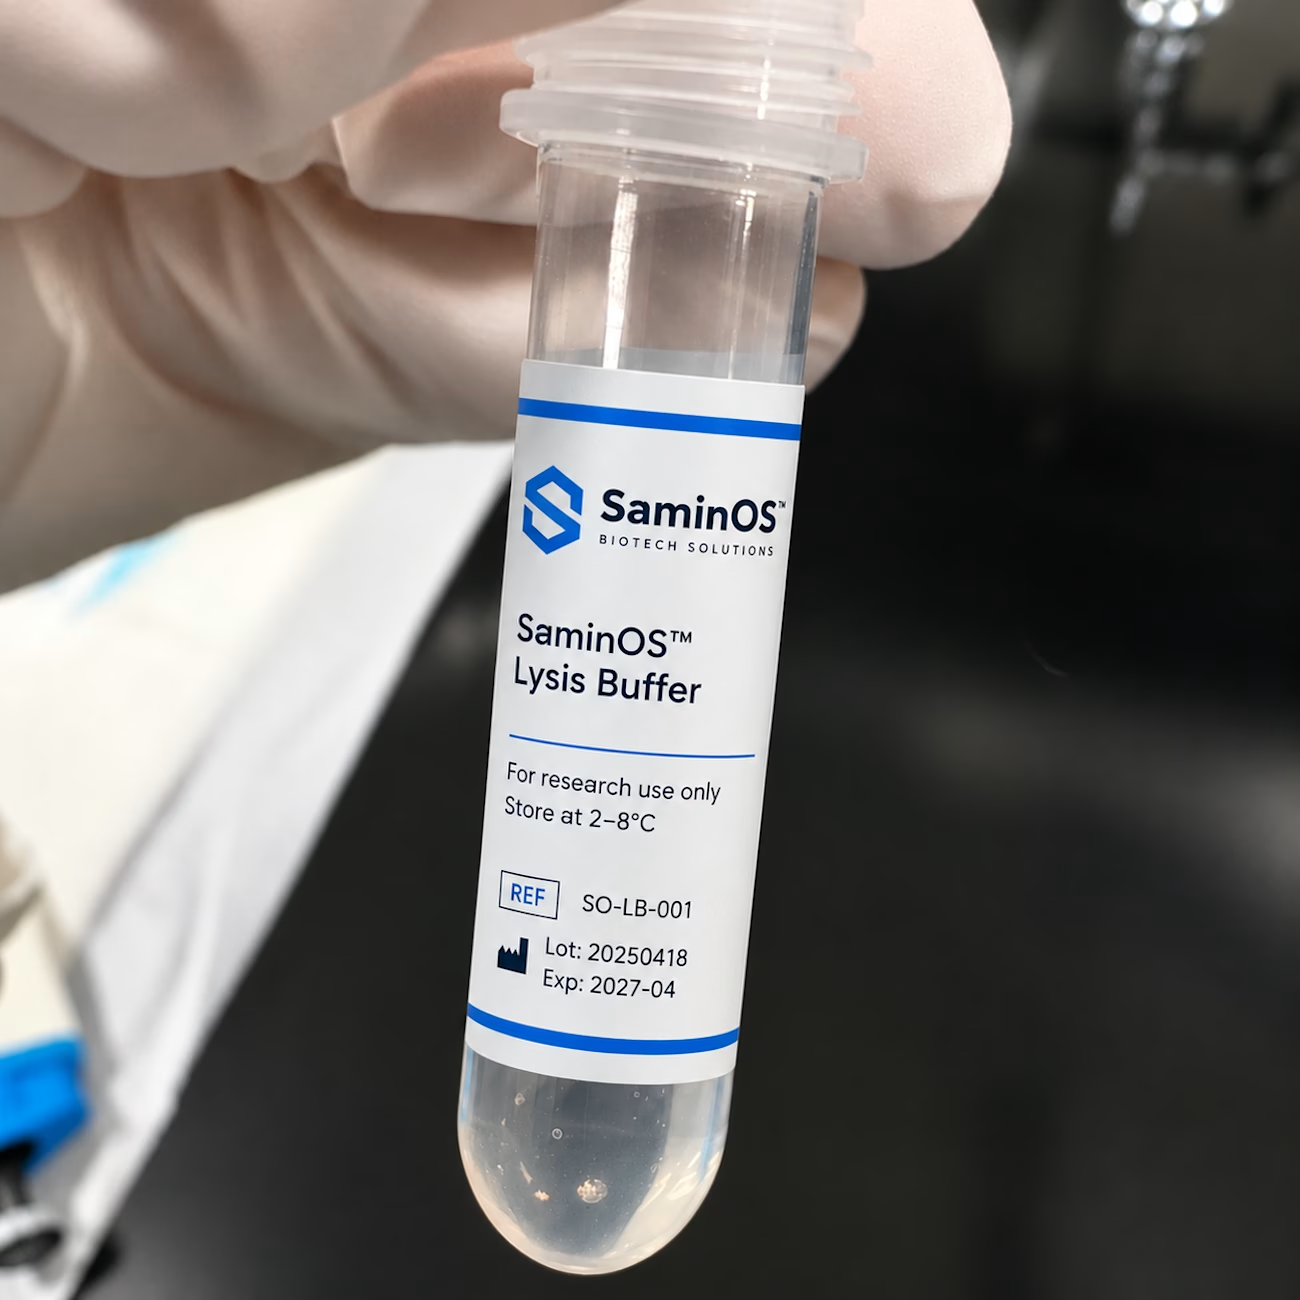
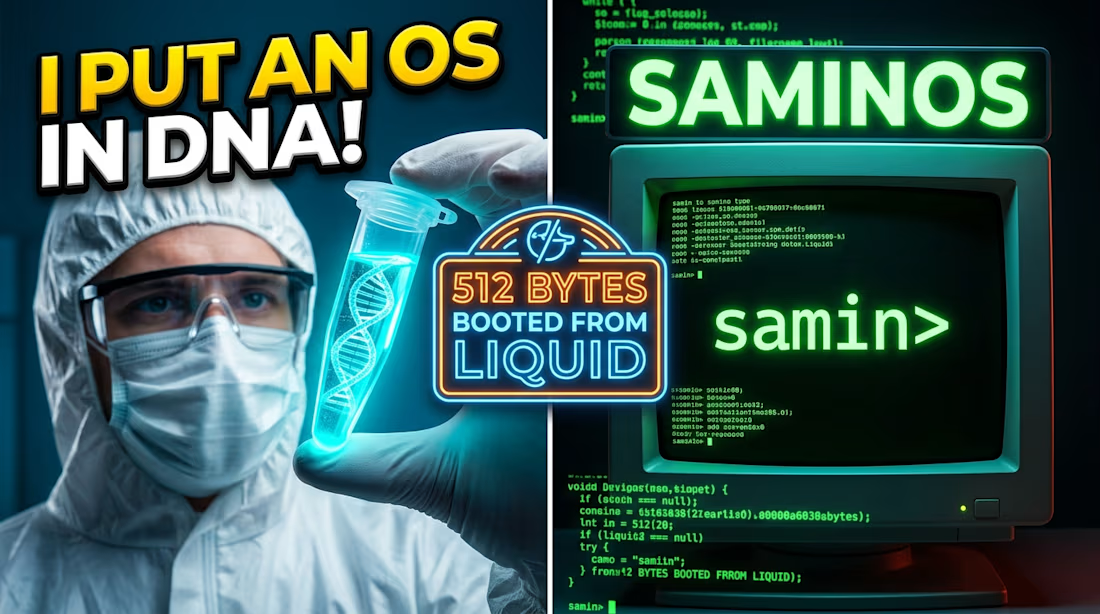
Hey there, first off sorry for being this delay in posting projects on Contra. Well in my Contra profile I had uploaded and shown numerous love towards browser based Operating systems. We had seen a famous Vanilla based Win 95. A perfect retro functioning operating system running in your browser. Then I thought it would be more crazier to have AetherOS, an AI agent based operating system running in a single HTML based file system! This year I decided I would build something different, something unique. Most operating systems today are massive. Windows and macOS take up tens of gigabytes of disk space and require gigabytes of memory just to show an empty desktop. Even a simple program usually carries megabytes of hidden background code.
I wanted to find out how small a real, interactive operating system could be.
I set a hard rule for myself: everything had to fit inside 512 bytes. That is the exact size of a single Master Boot Record sector on a computer hard drive. There is no room for bloat, third-party libraries, or sloppy instructions. Every single byte has to fight for its place.
I wrote SaminOS in raw 16-bit x86 assembly language. When a computer turns on, its motherboard BIOS looks for the first sector of a disk, checks for a two-byte signature at the end, and loads the code directly into memory address 0x7C00. SaminOS takes full control of the machine from that exact moment.
It does not just print a single line and freeze. SaminOS boots an interactive command line with a live blinking prompt. It draws a four-line bold ASCII art logo. It includes a keyboard driver that handles keystrokes, buffers characters in memory, and erases letters cleanly when you hit backspace. It reads the motherboard real-time clock chip, converts raw decimal numbers, and displays the local time in Dhaka. It gives you six working commands: help, info, time, say, cls, and reboot.
The entire system takes up 508 bytes of machine instructions and text, leaving two empty padding bytes and the two-byte boot signature. Exactly 512 bytes.
Then I realized something much bigger: that 512-byte operating system could live inside biology.
How Code Turns into DNA:
Computers think in binary numbers: 0 and 1. Living cells think in genetic letters: Adenine (A), Cytosine (C), Guanine (G), and Thymine (T).
Because there are four genetic bases, each letter can store exactly two binary bits:
- 00 becomes A
- 01 becomes C
- 10 becomes G
- 11 becomes T
Every byte of computer data contains eight bits. In my encoding system, each byte turns into a short four-letter genetic word. For example, the hex byte 0x55 (which is 01010101 in binary) turns into the letters CCCC. The hex byte 0xAA (which is 10101010) turns into GGGG.
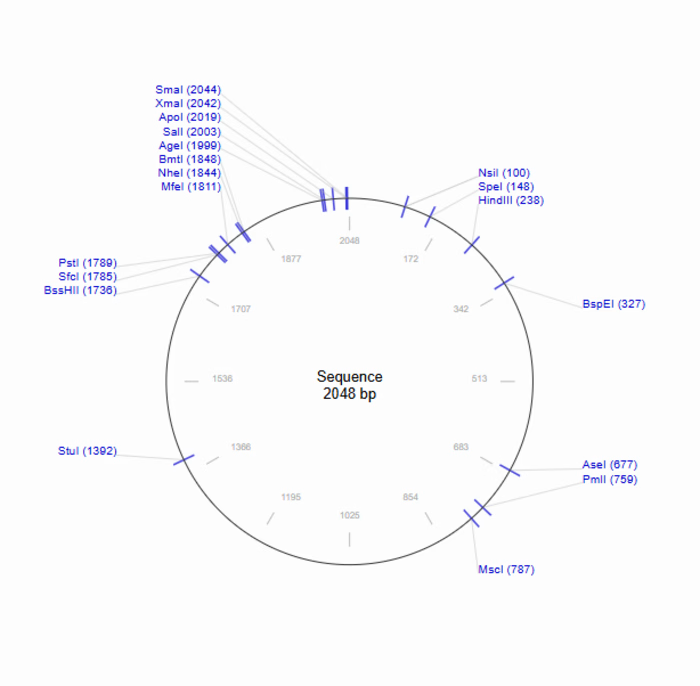
Because SaminOS is exactly 512 bytes long, the entire operating system translates into an exact strand of 2,048 DNA base pairs.
This number changes everything.
When large tech companies store data in DNA, such as movies or research archives, the files are millions of bytes long. Chemists cannot easily synthesize a million-letter strand of DNA in one piece. They must chop the data into thousands of tiny, scrambled fragments, store them in a pool, and rely on complicated mathematical algorithms to piece them back together later. If one piece gets lost, the whole file can break.
SaminOS does not have to be chopped up. In nature, 2,048 letters is the normal size of a single bacterial gene. That means SaminOS exists as one single, unbroken, continuous strand of DNA.
The entire bootloader, the kernel, the command engine, the clock math, the prompt, and the author metadata all fit onto one molecular polymer.
From a Glass Tube to a Laptop Screen:
People often ask: how can clear liquid in a tube run on a computer screen?
The link between biology and hardware works in five clear steps:
1. Digital Compilation: A Python tool reads the 512-byte binary file of SaminOS two bits at a time. It maps each pair to A, C, G, or T, producing a 2,048-letter text sequence.
2. Chemical Synthesis: A DNA synthesizer prints the sequence. Instead of paper and ink, it links real molecules together, base by base, building physical double-helix strands floating in purified water.
3. Biological Storage: The dry DNA forms an invisible salt crystal, or dissolves into clear water. A single molecule of SaminOS is only 696 nanometers long and weighs 1.26 attograms. That is so small that a single drop of water can hold billions of complete copies of the operating system.
4. Nanopore Reading: To boot the system, you pipette a tiny droplet of the liquid into a portable DNA sequencer, like an Oxford Nanopore MinION. This device is smaller than a smartphone and plugs directly into a laptop via USB. Inside the device, an electrical current pulls the DNA strand through a microscopic protein pore. As each letter passes through, it creates a distinct dip in the electric current.
5. Silicon Boot: Software on the laptop reads those electric signals and turns them back into the original 512 bytes of machine code. A script loads those bytes into Sector 0 of a virtual drive or USB flash stick. The computer BIOS checks the last two bytes, confirms the 0x55AA boot signature, loads the code into RAM at 0x7C00, and boots SaminOS live on screen.
Molecular Surgery: Using Enzymes as Hardware Switches:
Because the computer instructions map directly to physical genetic letters, we can do something impossible with ordinary silicon: we can modify software using biology.
In molecular biology, scientists use restriction enzymes. These are natural biological proteins that act like microscopic scissors. Each enzyme looks for one specific pattern of genetic letters and cuts the DNA strand at that exact spot.
When we map SaminOS into DNA, our assembly instructions accidentally create real recognition sites for known enzymes:
-SmaI and XmaI (They are the Boot Switch): The x86 boot signature 0x55AA translates into CCCCGGGG at base pairs 2041 to 2048. Both SmaI and XmaI cut the sequence CCCGGG. If you add SmaI to the vial, it snips the strand right inside the boot signature. It does not touch any of the commands or code, but the computer BIOS will refuse to boot the disk. It acts like a biological write-blocker or kill switch.
- NsiI (The Keyboard Lock): At base pair 100, NsiI cuts right where the code calls the BIOS keyboard interrupt. Adding this enzyme physically unplugs the keyboard handler at the molecular level.
- AseI, PmlI, and MscI (The Clock Cutters): All three enzymes cut inside the mathematical routine that decodes the motherboard real-time clock.
- AgeI and SalI (The Dhaka Marker): Bases 1989 to 2008 spell out the word "Dhaka" in ASCII. The letters of the city name form the exact cutting site for AgeI and SalI. Dropping these enzymes into the tube cuts the geographic origin marker out of the code.
- StuI (The Banner Cutter): This enzyme cuts through the exact middle of the ASCII art startup logo.
You do not need a compiler or a hex editor to disable features. You can modify the binary using drops of liquid on a laboratory bench.
Why I did this:
This project is not just a technical puzzle. It points toward solutions for real problems in computing:
1. Storage That Lasts for Millennia: Modern hard drives fail within ten years. Magnetic tapes degrade. Flash memory loses charge. Synthetic DNA stored in tiny glass beads can last for tens of thousands of years at room temperature with zero electricity. SaminOS proves that executable software, not just static text or images, can be archived for deep time.
2. Extreme Data Density: DNA can store more information per cubic millimeter than any silicon chip known to science. All 512 bytes of SaminOS fit into an object smaller than a wavelength of visible light. You could pack copies for every person on Earth into a single drop of liquid.
3. Living Servers: Because 2,048 base pairs is the size of a normal gene, you can insert SaminOS into a harmless bacterium like E. coli. As the bacteria feed on basic nutrients, they duplicate the operating system billions of times without drawing power from an electrical wall outlet.
4. Absolute Physical Security: A vial of SaminOS has no radio antenna, no network card, and no electrical emissions. It cannot be scanned through an airport X-ray or intercepted across the internet. It exists outside the electromagnetic spectrum until it is sequenced.
What This Project Demonstrates:
SaminOS shows what happens when low-level assembly language meets synthetic biology. It demonstrates:
1. Deep mastery of bare-metal x86 architecture, memory layouts, and hardware interrupts.
2. Clean algorithm design under a strict 512-byte constraint.
3. Creative cross-disciplinary engineering linking computer science, information theory, and molecular genetics.
4. Clear communication that turns complex biocomputing concepts into accessible, human ideas.
Ref and Source Links:
1. SaminOS Research at Zenodo: https://doi.org/10.5281/zenodo.23554876
2. SaminOS Github Repo with all tools and resources : https://github.com/Saminsami73/SaminOS_DNA
3. A 61 Page Guidebook of SaminOS DNA : https://github.com/Saminsami73/SaminOS_DNA/blob/main/SaminOS_Complete_Guidebook.pdf
4. SaminOS Main Research paper : https://github.com/Saminsami73/SaminOS_DNA/blob/main/SaminOS_Research_Paper_v2.pdf




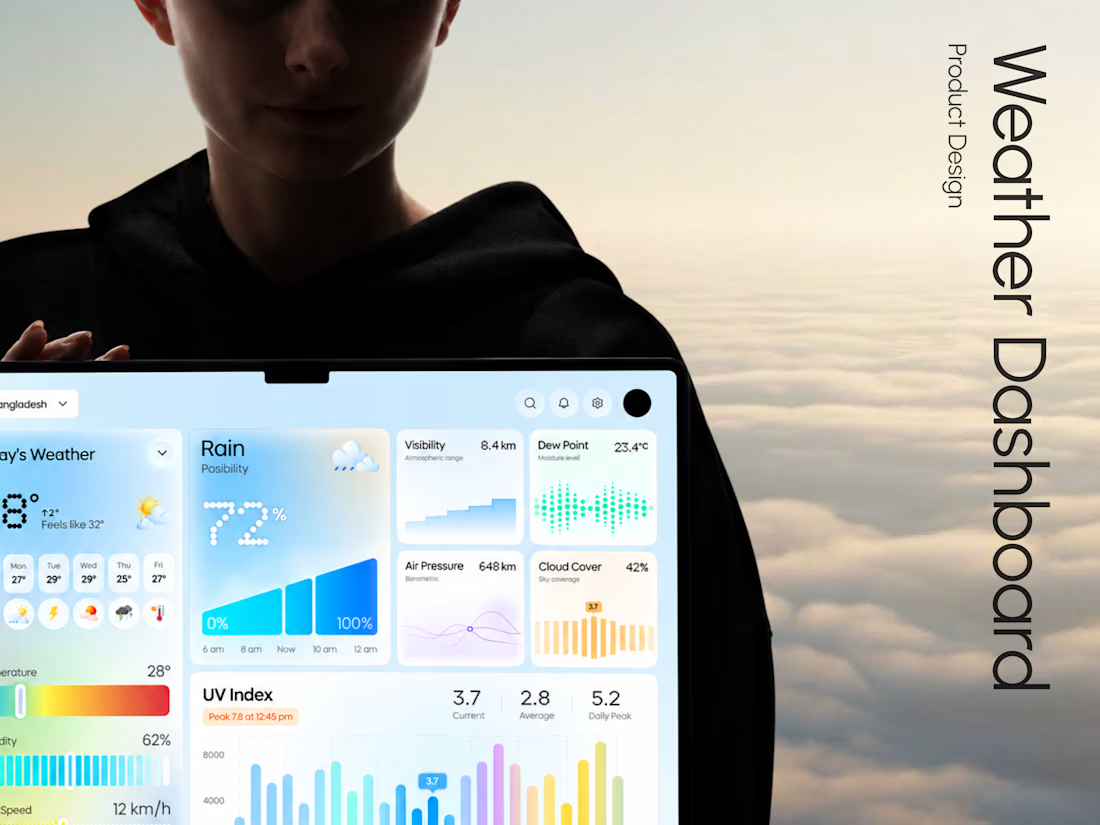
Weava - Making Weather Data Feel Effortless
Weather dashboards often display plenty of information.
The real challenge is making that information useful.
With Weava, we explored a modern weather dashboard concept that puts clarity, visual structure, and usability at the center of the experience.
The design direction focuses on:
• Clean and structured dashboard layouts
• Clear weather data visualization
• Intuitive information hierarchy
• Minimal, distraction-free interface design
The result is a design concept that explores how everyday weather information can become a more understandable digital experience.
Building a SaaS product, analytics dashboard, or custom web application?
At Taqwah, we specialize in designing modern, scalable UI/UX experiences for startups and growing businesses.
From product concepts to developer-ready interface designs, we help turn complex product ideas into intuitive digital experiences.
👉 Have a dashboard project in mind? Send us your requirements and let's discuss a custom UI/UX design solution.

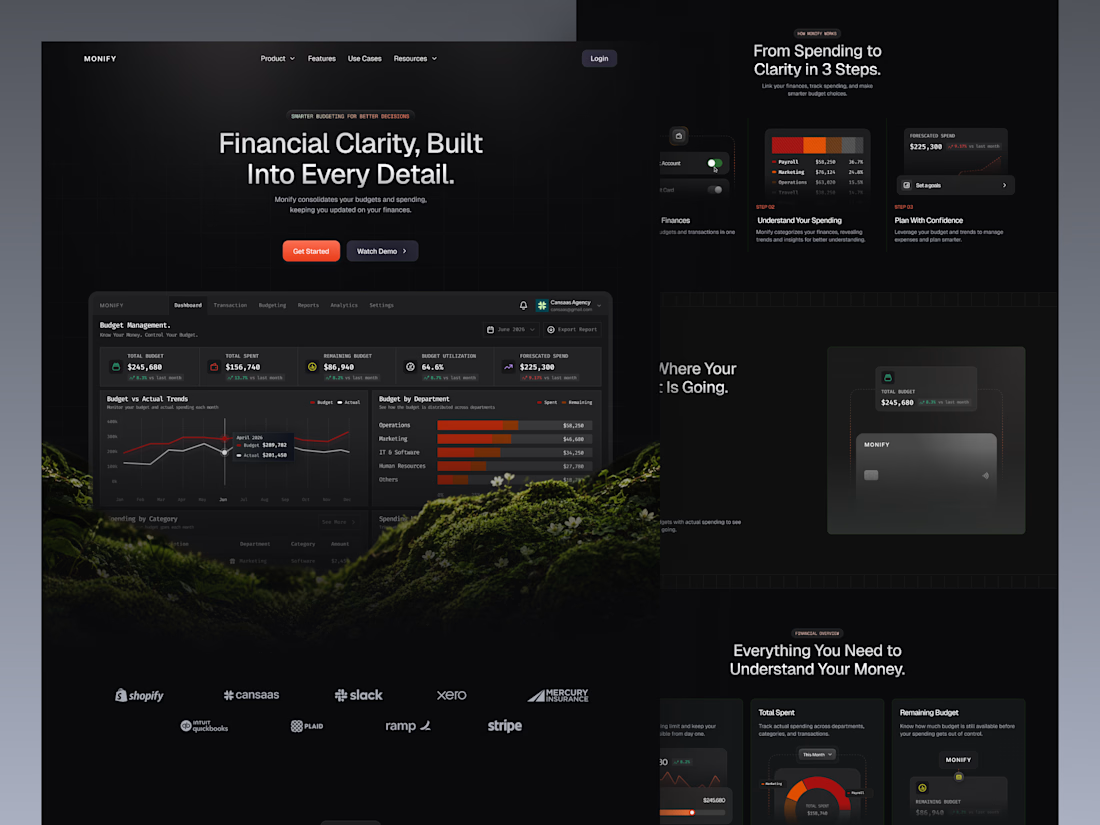
Monify is a modern budget management landing page designed to help businesses track expenses, monitor budgets, and understand financial performance with greater clarity. Featuring a sleek dark-mode interface, interactive financial dashboard previews, bold red-orange accents, intuitive data visualization, and clean typography, the design transforms complex financial information into a more accessible and engaging fintech experience.
📩 Collaborate with Us? Contra Cansaas Agency