The network for creativity
Join 1.25M professional creatives like you
Connect with clients, get discovered, and run your business 100% commission-free
Creatives on Contra have earned over $150M and we are just getting started
Back to feedPost

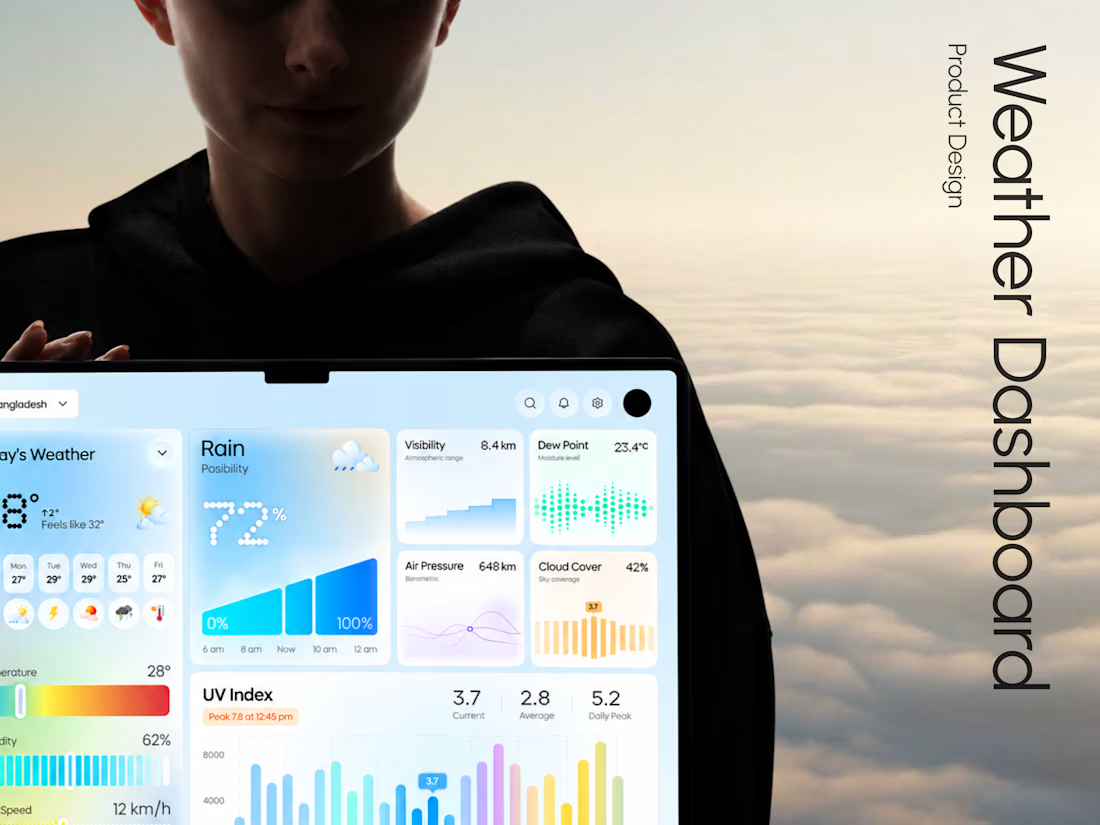
Weava - Making Weather Data Feel Effortless
Weather dashboards often display plenty of information.
The real challenge is making that information useful.
With Weava, we explored a modern weather dashboard concept that puts clarity, visual structure, and usability at the center of the experience.
The design direction focuses on:
• Clean and structured dashboard layouts
• Clear weather data visualization
• Intuitive information hierarchy
• Minimal, distraction-free interface design
The result is a design concept that explores how everyday weather information can become a more understandable digital experience.
Building a SaaS product, analytics dashboard, or custom web application?
At Taqwah, we specialize in designing modern, scalable UI/UX experiences for startups and growing businesses.
From product concepts to developer-ready interface designs, we help turn complex product ideas into intuitive digital experiences.
👉 Have a dashboard project in mind? Send us your requirements and let's discuss a custom UI/UX design solution.

Looks different

The UV index chart is a nice touch, easy to read.
The network for creativity
Join 1.25M professional creatives like you
Connect with clients, get discovered, and run your business 100% commission-free
Creatives on Contra have earned over $150M and we are just getting started











Related posts

Exploring a clean, modern SaaS dashboard UI. Focused on simple layouts, smooth interactions, and a better user experience 🚀


i had to like this, it got my attention, very nice build mate.

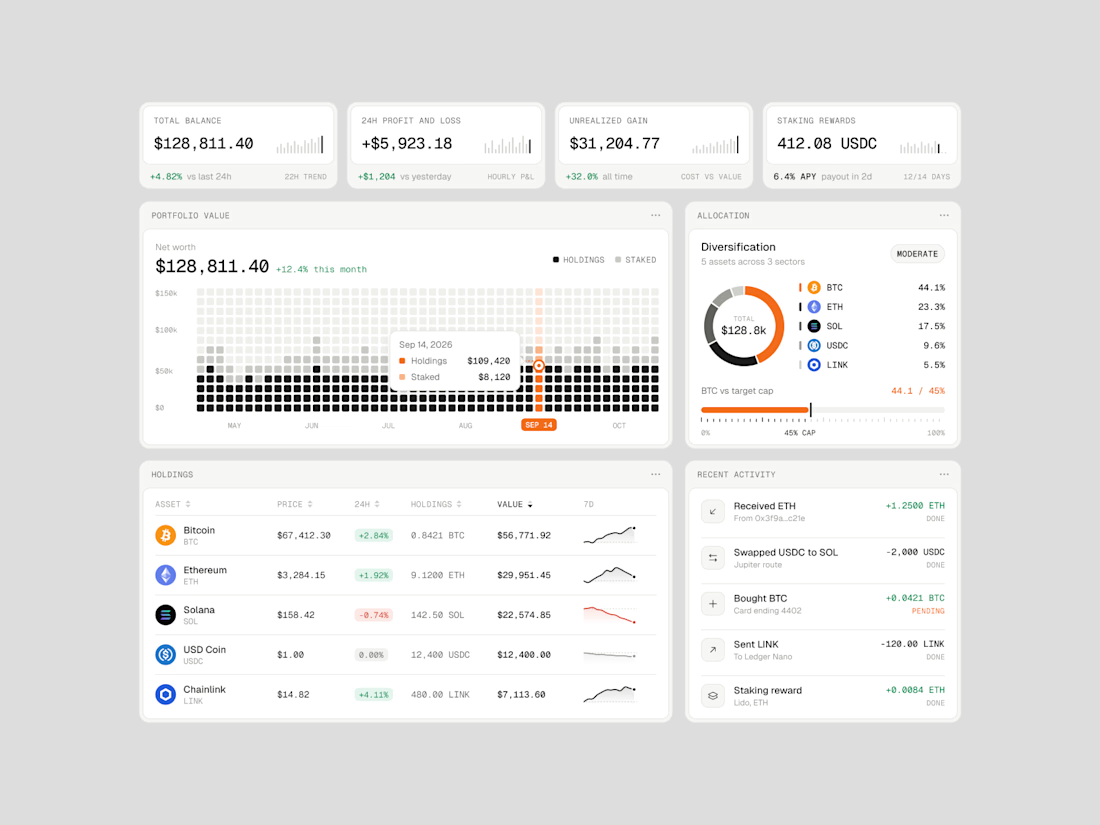
Exploring how complex financial data can feel simple, structured, and easy to navigate.
Vault One is a crypto portfolio dashboard concept that brings together asset performance, portfolio allocation, transaction history, and key financial metrics in one workspace.
I focused on visual hierarchy, information density, and data visualization, using a neutral color palette, subtle UI details, and selective accent colors to keep the interface clean without compromising functionality.
The goal was to make the data easier to understand, not just nicer to look at.
Would love to hear your thoughts on the visual direction and layout!
#ProductDesign #UIDesign #Fintech #DashboardDesign #UXDesign



WIP 🚧:
an architecture site for a studio that only builds where the weather decides.
The brief I set myself: make it feel like a set of drawing sheets. Every section is numbered, ruled and labelled like a title block, and every project carries real data: altitude, build window, snow load.
The hero is a small code component. A datum line follows the cursor and reads the altitude live off the scale.
Built in Framer. Still polishing motion and mobile.
#framer #webdesign #architecture
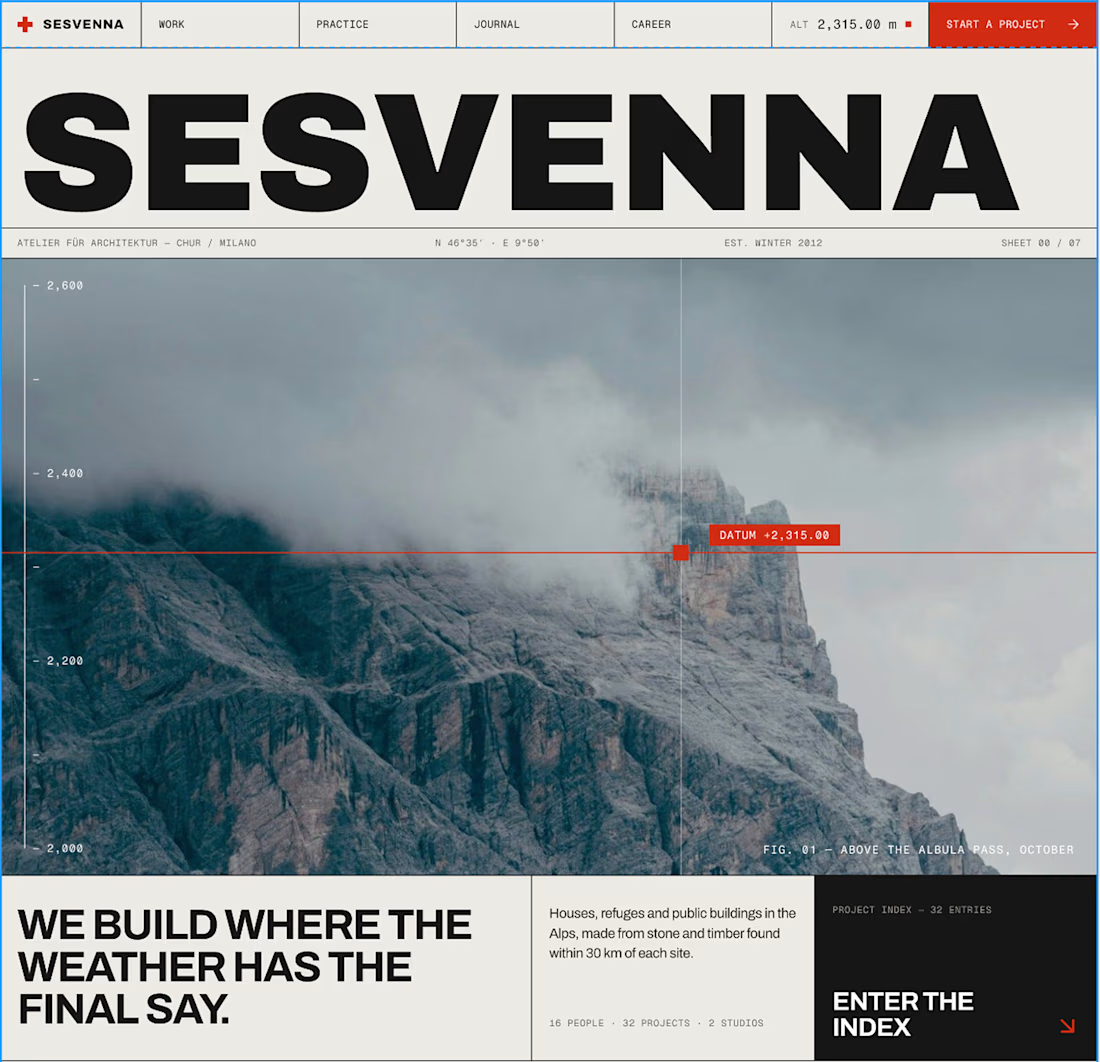

The drawing-sheets brief is such a charming concept for this site, Bright. That datum line reading altitude live off the scale in the hero is the perfect detail to anchor the whole thing.