Subin Saji
Data Analyst turning business data into clear insights
New to Contra
Subin is ready for their next project!


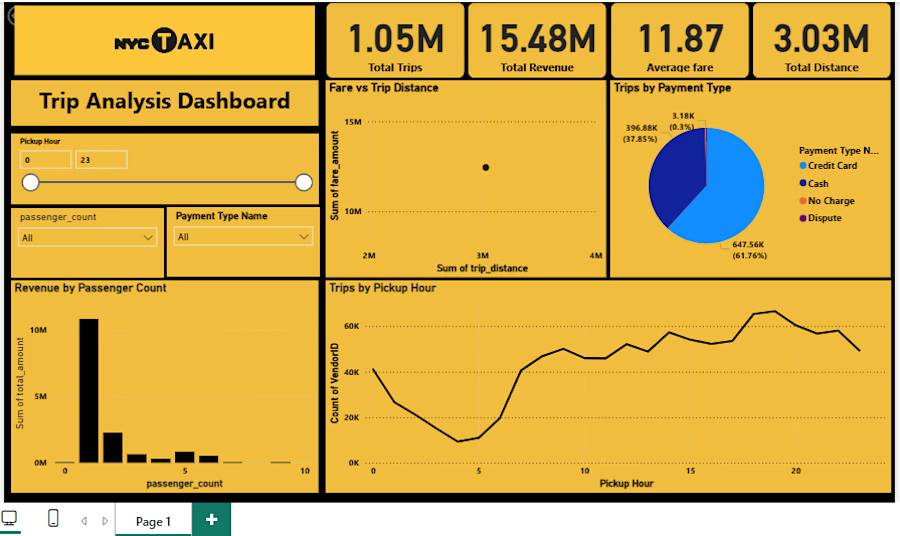
Explored over one million taxi trips for revenue analysis, payment methods, and passenger behaviour. Identified peak-hour demand using interactive visualisations.

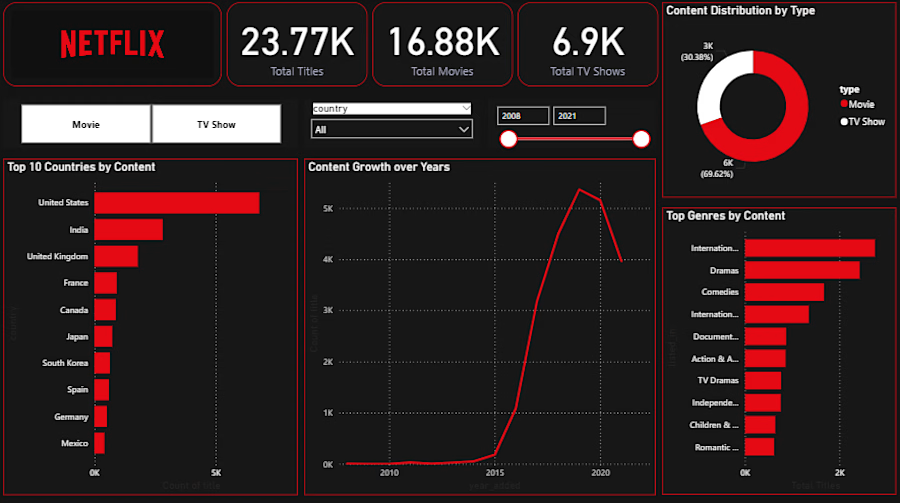
Analyzed Netflix content by country, genre, and release year. Explored movies vs. TV shows and growth trends with interactive filters, inspired by Netflix's UI.


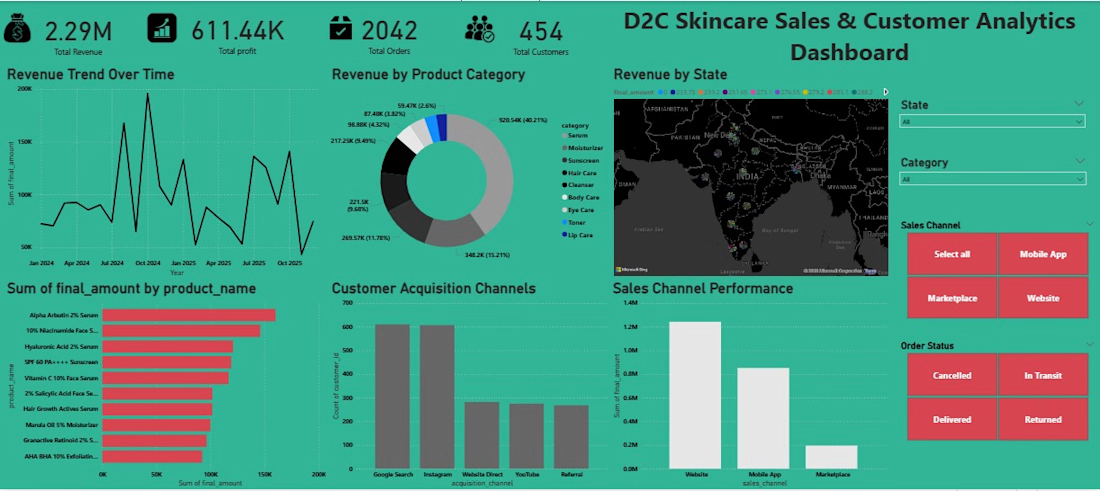
Interactive dashboard tracking revenue, profit, and customer behaviour across channels and regions. Includes KPI cards, trend analysis, and deep customer insights.